Common menu bar links
Breadcrumb Trail
ARCHIVED - Canada Revenue Agency - Report
 This page has been archived.
Archived Content
Information identified as archived on the Web is for reference, research or recordkeeping purposes. It has not been altered or updated after the date of archiving. Web pages that are archived on the Web are not subject to the Government of Canada Web Standards. As per the Communications Policy of the Government of Canada, you can request alternate formats on the "Contact Us" page.
Section III: Supplementary Information
Statement of Management Responsibility
We have prepared the accompanying financial statements of the Canada Revenue Agency according to accounting principles consistent with those applied in preparing the financial statements of the Government of Canada. Significant accounting policies are set out in note 2 to the financial statements. Some of the information included in the financial statements, such as accruals and the allowance for doubtful accounts, is based on management’s best estimates and judgments, with due consideration to materiality. The Agency’s management is responsible for the integrity and objectivity of data in these financial statements. Financial information submitted to the Public Accounts of Canada and included in the Agency’s Annual Report is consistent with these financial statements.
To fulfill its accounting and reporting responsibilities, management maintains sets of accounts which provide records of the Agency’s financial transactions. Management also maintains financial management and internal control systems that take into account costs, benefits, and risks. They are designed to provide reasonable assurance that transactions are within the authorities provided by Parliament, and by others such as provinces and territories, are executed in accordance with prescribed regulations and the Financial Administration Act, and are properly recorded to maintain the accountability of funds and safeguarding of assets. Financial management and internal control systems are reinforced by the maintenance of internal audit programs. The Agency also seeks to assure the objectivity and integrity of data in its financial statements by the careful selection, training, and development of qualified staff, by organizational arrangements that provide appropriate divisions of responsibility, and by communication programs aimed at ensuring that its regulations, policies, standards, and managerial authorities are understood throughout the organization.
The Board of Management is responsible for ensuring that management fulfills its responsibilities for financial reporting and internal control and exercises this responsibility through the Audit Committee of the Board of Management. To assure objectivity and freedom from bias, these financial statements have been reviewed by the Audit Committee and approved by the Board of Management. The Audit Committee is independent of management and meets with management, the internal auditors, and the Auditor General of Canada on a regular basis. The auditors have full and free access to the Audit Committee.
The Auditor General of Canada conducts an independent audit and expresses opinions on the accompanying financial statements.
Linda Lizotte-MacPherson
Commissioner and Chief Executive Officer
Stephen O’Connor
Chief Financial Officer and Assistant Commissioner, Finance and Administration
Ottawa, Ontario
August 23, 2010
Financial Performance Information – Parliamentary Appropriations
Introduction
This section of the CRA Performance Report 2009-2010 provides the details of the Agency’s resource management performance for the purpose of reporting to Parliament on the use of appropriations in 2009-2010. This complements the information provided in the spending profile sections under each Program Activity and satisfies the reporting requirements set for departmental performance reports.
Financial reporting methodologies
The CRA’s funding is provided by Parliament through annual appropriations (modified cash accounting basis) and, in this section, the CRA reports its expenditures and performance to Parliament, together with details on the management of Parliamentary appropriations on the same basis. In addition to the above reporting requirements, the CRA is also required to prepare its annual financial statements in accordance with the accounting principles applied in preparing the financial statements of the Government of Canada (full accrual accounting basis). Accordingly, the audited Statement of Operations – Agency Activities in our 2009-2010 Annual Report includes certain items such as services received without charge from other government departments and federal agencies. A reconciliation can be found in note 3b in the same report.
The CRA is participating in a Treasury Board Secretariat (TBS) pilot project to extend accrual accounting to the budgeting and appropriations process. As such, CRA prepared and included future oriented financial statements (FOFS) in the 2009-2010 Report on Plans and Priorities (RPP). This future-oriented financial information was prepared on an accrual basis to strengthen accountability and improve transparency and financial management. As part of the analysis of Net Cost of Operations, this DPR compares actual results to the initial future oriented financial statements contained in the 2009-2010 RPP.
CRA financial information
Activities of the Agency
|
Main Estimates[Footnote 1]
|
|
|
Planned Spending[Footnote 2]
|
|
|
Total Authorities[Footnote 3]
|
|
The Financial Statements – Agency Activities reports $3,985.2 million as total Parliamentary appropriations used (note 3b in our 2009-2010 Annual Report shows the reconciliation to the net cost of operations). The difference from the $4,406.5 million reported in this section is explained by three items reported in the Financial Statements – Administered Activities: the statutory disbursements to provinces under the Softwood Lumber Products Export Charge Act, 2006, $205.5 million; the Children’s Special Allowance, $215.3 million; and the Relief for Heating Expenses, $0.5 million (part of Vote 1, Program Expenditures).
Overview
For 2009-2010, Parliament approved $4,388 million through the Main Estimates, as shown in CRA’s 2009-2010 Report on Plans and Priorities.
The 2009-2010 Main Estimates were adjusted to include:
- $147.1 million for the carryforward from 2008-2009;
- $70.9 million for maternity and severance payments;
- $9.1 million for increased Respendable Revenue mainly to provide services to Service Canada;
- $56.6 million for Collective Agreements;
- $12.3 million for measures arising from the 2009 Federal Budget in support of Canada’s Economic Action Plan;
- $18.6 million transferred from Public Works and Government Services Canada for accommodation services;
- $11.0 million for the Government advertising programs;
- $1.6 million for Court Awards and Crown Assets Disposal;
- $0.9 million to increase Federal Public Service Student Employment;
- $6.3 million for the Financial Interoperability and Stewardship Initiative in support of the Corporate Administrative Systems;
- $40.0 million for the Provincial Sales Tax Administration Reform; and
- $56.0 million for the employee benefits plan costs.
These increases were offset by the following reductions:
- $223.5 million for the statutory disbursements to Provinces under the Softwood Lumber Products Export Charge Act, 2006;
- $2.0 million for private collection agencies;
- $5.7 million for statutory Children’s Special Allowance payments;
- $0.6 million for the Public Opinion Research;
- $0.2 million transferred to the Treasury Board Secretariat to support the National Managers’ Community; and
- $0.2 million transferred to Foreign Affairs and International Trade to support the CRA staff located at missions abroad.
This resulted in total approved authorities of $4,586.2 million for 2009-2010, representing an in-year increase of 4.5% over the Main Estimates.
Of the $4,586.2 million total authority, CRA’s actual spending totalled $4,406.5 million resulting in $179.6 million remaining unexpended at year-end. After deducting unused resources related to the proposed Offshore Trusts initiative, Accommodation and Real Property Services as well as costs for the Employee Benefits Plan associated with the conversion of Other Operating to Personnel costs, the remaining $150.3 million is available for use by the Agency in 2010-2011. This amount represents 3.3% of the total authority.
The $150.3 million carry forward to 2010-2011 will be directed primarily to selected priority investments related to:
- Major project and infrastructure spending (e.g., Compliance Systems Redesign, Tax Free Savings Account, Major Tenant Services and Information Technology Infrastructure);
- Special purpose funding (e.g., Provincial Sales Tax Administration Reform, Charities Partnership and Outreach Program, Minist�re du Revenu du Qu�bec for the Administration of the GST);
- Various other operational and workload pressures.
Revenues administrated by the Agency
Total revenues administered by the CRA amount to some $279 billion in 2009-2010, a decrease of 3% from the $287.5 billion administered in 2008-2009.
Financial Highlights
For the period ending March 31, 2010
Statement of Financial Position
For the period ending March 31, 2010
Statement of Operations
There are three significant program administration changes which have influenced the results in the Financial Statements.
1. Provincial Sales Tax Administration Reform
In 2009, the provinces of Ontario and British Columbia entered into Memoranda of Agreement with the Government of Canada to harmonize their provincial sales taxes with the federal Goods and Services Tax (GST) effective July 1, 2010.
The CRA received incremental funding of $47.5 million (including employee benefit plan contributions) in 2009-2010 to ensure that necessary systems and processes were in place for the implementation of HST in Ontario and British Columbia, to communicate the necessary information to businesses and individual taxpayers, and to prepare for the integration of the affected provincial employees into the Agency's workforce. The level of funding to be provided in subsequent years is expected to be confirmed by the Treasury Board in the near future.
The implementation of a harmonized administration and the successful transition of provincial employees will continue to be a priority for the CRA in 2010-2011.
2. Corporate Tax Administration for Ontario
The CRA has commenced processing Ontario T2 harmonized corporate income tax returns and is also providing related services, including audits, rulings, interpretations, objections and appeals. As such the administration of Ontario corporate tax is now fully integrated into the CRA’s base operations.
The CRA received $210.5 million of Federal Government funding over four years (2006-2007 to 2009-2010) for developmental and transitional costs relating to this initiative. Of this amount $83.2M was expended in 2009-2010. Under the Memorandum of Agreement Concerning a Single Administration of Ontario Corporate Tax, signed on October 6, 2006, the Governments of Canada and Ontario agreed to transfer the administration of Ontario corporate income tax from the Ontario Ministry of Revenue to the CRA starting in the 2009 taxation year. The Corporate Tax Administration for Ontario initiative has now met its key milestones, and all necessary agreements and systems changes have been in place since April 2009.
3. Investment in Information Technology systems
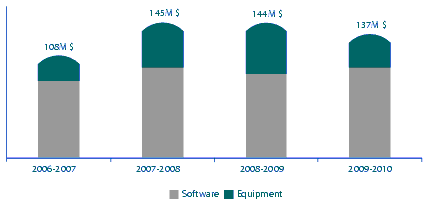
In fiscal year 2010, the CRA continued to invest in information technology (IT) systems in order to ensure modern and efficient program delivery. The Agency had several large-scale projects that required substantial investments in the development of IT systems. Combined with the acquisition of IT hardware, the Agency invested $137 million in IT related capital assets this fiscal year. The value of these new capital assets has been offset by amortization expenses of $87 million in 2009-10.
The following figure outlines investments in information technology that have been accounted for as capital assets in the last four years.
Figure 13 Information Technology Investment in Capital Assets
Analysis of Net Cost of Operations
The Agency’s 2009-2010 net cost of operations decreased by $24 million from 2008-2009. Agency expenses totalled $4,441 million in 2009-2010 (2008-2009 – $4,434 million) (see Note 9 of the Financial Statements – Agency Activities for the breakdown of expenses by type). When adjusting for non-tax revenue of $569 million (2008-2009 – $538 million), the net cost of operations amounts to $3,872 million, as illustrated below:
Table 1 Details on the net cost of operations
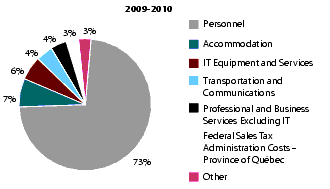
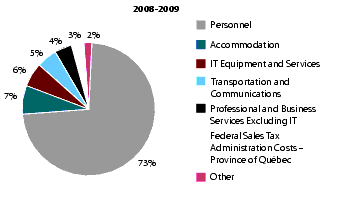
The Agency’s expenses are composed of 73% in personnel expenses (salaries, other allowances and benefits) and 27% in non-personnel expenses, as illustrated in the figure below
Personnel expenses are the primary drivers for the Agency. A number of factors contributed to the net decrease of $10 million for this type of expenses in 2009-2010. Additional costs were incurred for salary revisions pursuant to collective agreements provisions and in the staff complement due to new initiatives such as the Provincial Sales Tax Administration Reform, the Corporate Tax Administration for Ontario, Ontario Aggressive International Tax Planning and others announced in recent Federal Budgets but were offset by a decrease in the cost of severance benefits.
In total, non-personnel expenses increased by $18 million. Significant elements of non-personnel expenses are composed of accommodation, transportation and communication expenses. The reduction of $33 million in information technology costs is attributable to decreases in the purchase of computer equipment and software as well as decreases in loss on disposals and write offs of capital assets. Federal Goods and Services Tax administration costs by the Province of Qu�bec have increased due to higher salary costs.
Figure 14 Total Expenses by Type
Comparison of Future-oriented Financial Information and Actual Results
The Agency’s final net cost of operations for 2009-2010 was $124 million greater than was anticipated in the future-oriented financial statements included in the 2009-2010 RPP ($3,872 million – $3,748 million). This represents a 3.3% variance and is explained as follows:
- The future-oriented financial statements were prepared based on Parliamentary appropriations received as of the 2009-2010 Main Estimates and did not consider expenditures as a result of resources received for the remainder of the year for such items as:
- These incremental resources are offset by decreases arising mainly from statutory disbursements to the provinces under the Softwood Lumber Products Export Charge Act, 2006.
- Other explanations for the variance relate to accrual adjustments as a result of changes in asset acquisitions, amortization, loss on disposal /write-off of capital assets and personnel related costs for collective agreements; maternity and severance payments, and employee benefits plan.
Audited and Unaudited Financial Statements
For supplementary information on the CRA’s audited and unaudited financial statements, please visit www.cra.gc.ca/annualreport.
Comparison of future-oriented financial information can be found on CRA’s Web site at: www.cra.gc.ca.
Electronic Tables
The following tables can be found on the Treasury Board Secretariat Web site at
http://www.tbs-sct.gc.ca/dpr-rmr/2009-2010/index-eng.asp.
Sources of Respendable and Non-Respendable Non-Tax Revenue
Non-Respendable Non-Tax Revenue
User Fees Act – Advance Income Tax Ruling Fee
Policy on Service Standards for External Fees – Advance Income Tax Ruling Fee
User Fees Act – Taxation Statistical Analyses and Data Processing Fee
Policy on Service Standards for External Fees – Taxation Statistical Analyses and Data Processing Fee
User Fees Act – Access to Information Processing Fee
Policy on Service Standards for External Fees – Access to Information Processing Fee
Details on Transfer Payment Programs
Children’s Special Allowance Payments (Statutory)
Disbursements to Provinces under the Softwood Lumber Products Export Charge Act, 2006 (Statutory)
Reconciliation to the Statement of Operations
Response to Parliamentary Committees and External Audits
Internal Audits and Evaluations
Other Items of Interest
Rating Our Data Quality
In conjunction with the performance results ratings, we also assign each indicator a data quality rating.
For each indicator, we use consistent approaches in evaluating the information derived from our data collections systems and all other sources. We rely upon CRA managers to vouch for the completeness of the records for data integrity purposes (i.e., data belongs to the same category, is collected for the same period, and by the same method). We examine data for relevance, formulas for accuracy, and other factors that must be considered. We also use comparable information from prior years for the purpose of historical comparison, which often appears in the Canada Revenue Agency Departmental Performance Report. To ensure consistency, we perform the following tasks to verify that the information reported in our numerous reports is valid, reliable, and is accompanied by appropriate evidence:
- Validation: This is a process of verification to ensure that the data meets the requirements for its intended purposes. We review and evaluate data for completeness and plausibility (accuracy, timeliness, interpretability, coherence). We also identify contact information, check calculations, confirm system reliability (verifying the source of information), and note and correct any errors.
- Data quality assessment: We apply a data quality checklist and review prior years’ data to assess the quality of data for each indicator.
- Electronic filing system: We store data in a database for easy reference and further analysis for other purposes.
- Physical filing system: We maintain physical files of the evidence collected from all sources to provide validation and assurance that our data quality ratings are accurate and supported.
We always endeavour to use the most appropriate and reliable data when evaluating our results. There are two main data sources for the Canada Revenue Agency Departmental Performance Report: administrative data (normally communicated in aggregate or after some simple calculations are performed on them) and survey data. All data sources are validated for accuracy and a data quality rating of good, reasonable, or weak, as categorized below, is applied to each indicator.
We believe that these three levels of data quality ratings provide a reasonable assessment of the reliability of the data. Generally, our data sources provide reliable information. In situations where the supporting data is too imprecise to draw firm conclusions, it is reflected in the data quality rating.
Service Standards at the CRA
Our service standards regime is a vital and integral part of our planning, reporting, and performance management processes. Meeting our service standard targets demonstrates that we are responsive to the needs of taxpayers and benefit recipients. This helps establish credibility in our operations and contributes to increasing the level of confidence that Canadians can place in government.
For more information on CRA’s service standards, please visit
www.cra.gc.ca/servicestandards
Sustainable Development
Through the CRA Sustainable Development Strategy 2007-2010, we continued to modernize the way we acquire, use, and dispose of assets. Consistent with the strategy, we realized efficiencies, while reducing the environmental impacts of our operations and programs.
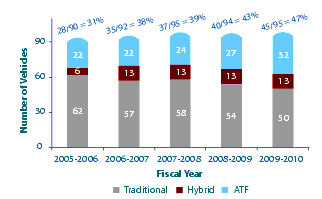
During 2009-2010, about 28% of the total spending on products was identified as green procurement in Synergy, the CRA’s Web-based purchasing system. Eighty percent of new vehicles bought were alternative transportation fuel capable or hybrids, increasing the overall proportion of the CRA vehicle fleet considered green from 43% in 2008-2009 to 47% in 2009-2010 (see figure below).
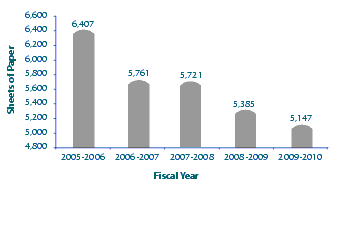
We reduced our use of office paper by an additional 4.4% to 5,147 sheets per employee, exceeding our sustainable development target of 5,643 sheets (see figure below). This resulted in savings of about $48,000 in office paper costs.
By expanding the No Waste program to six additional CRA facilities, we have now enabled 90% of CRA employees to reduce the amount of solid waste they generate in the workplace. Audits conducted in selected facilities showed that this program helped the CRA divert 84% of solid waste from landfill. To support sustainable service delivery, we also integrated sustainable development criteria into 85% of Memorandums of Understanding and Letters of Intent between the CRA and other organizations.
Strong senior management support and effective communications encouraged employees to apply sustainable development practices in their jobs. For example, 99% of the Executive Cadre had sustainable development commitments in their performance agreements. The Sustainable Development Innovation Fund, which supports employee-driven innovations, funded an additional six initiatives across the CRA. In modernizing the systems that support sustainable development, we enhanced its Web-based performance reporting tool and updated the nine programs that manage the CRA’s key environmental areas (e.g., paper, solid waste).
Figure 16 Sheets of Paper Purchased per CRA Employee
For more information on our sustainable development performance, please visit www.cra.gc.ca/sds.
Board Membership
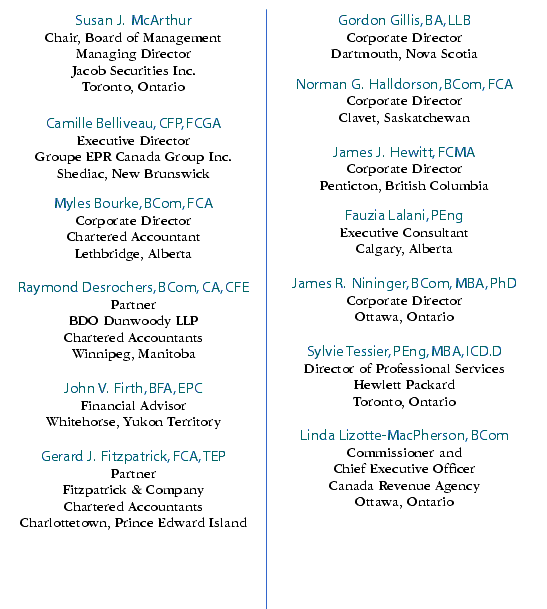
The Board of Management of the Canada Revenue Agency (CRA) comprises 15 members appointed by the Governor in Council. They include the Chair, the Commissioner and Chief Executive Officer, a director nominated by each province, one director nominated by the territories, and two directors nominated by the federal government. Members of the Board bring a private-sector perspective and business approach to management and, in this regard, champion a significant agenda for change within the CRA.
The following list shows the Board membership as of March 31, 2010.[Footnote 1]
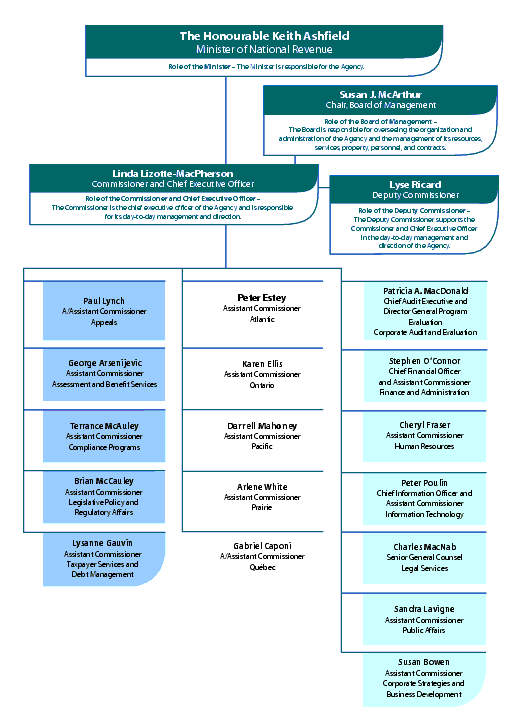
Organizational Structure (as of March 2010)
[Footnote 1] As of March 31, 2010, two positions on the Board were vacant.
