ARCHIVED - Human Resources and Social Development Canada
 This page has been archived.
Archived Content
Information identified as archived on the Web is for reference, research or recordkeeping purposes. It has not been altered or updated after the date of archiving. Web pages that are archived on the Web are not subject to the Government of Canada Web Standards. As per the Communications Policy of the Government of Canada, you can request alternate formats on the "Contact Us" page.
2008-09
Departmental Performance Report
Human Resources and Skills Development Canada
The original version was signed by
The Honourable Diane Finley, P.C., M.P.
Minister of Human Resources and Skills Development
The Honourable Rona Ambrose, C.P., député
Minister of Labour
Table of Contents
Ministers' Message
- Message from the Minister of Human Resources and Skills Development
- Message from the Minister of Labour
Section I - Departmental Overview
- 1.1 Raison d'�tre and Responsibilities
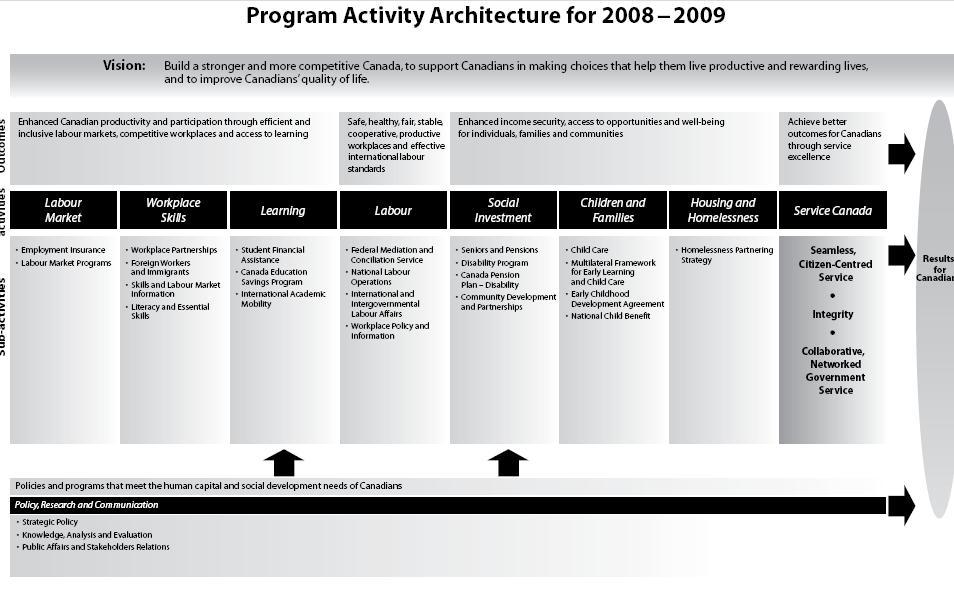
- 1.2 Program Activity Architecture
- 1.3 Socio-Economic Year in Review
- 1.4 Corporate Risk Analysis
- 1.5 Performance Summary Tables
- 1.6 Contribution of Priorities to Strategic Outcomes and Human Resources and Official Languages Indicators
- 1.7 Expenditure Profile
- 1.8 Voted and Statutory Items
Section II - Analysis of Program Activities by Strategic Outcome
- 2.1 Policies and programs that meet the human capital and social development needs of Canadians
- 2.2 Enhanced Canadian productivity and participation through efficient and inclusive labour larkets, competitive workplaces and access to learning
- 2.3 Safe, healthy, fair, stable, cooperative, productive workplaces and effective international labour standards
- 2.4 Enhanced Income security, access to opportunities and well being for individuals, families and communities
- 2.5 Achieve better outcomes for canadians through service excellence
Section III - Supplementary Information
- 3.1 Electronic Tables
- 3.2 Financial Performance Overview
- 3.3 Specified Purpose Accounts
- 3.4 Statutory Annual Reports
Section IV - Other Items of Interest
Erratum
The following table indicates where the revisions should be noted in the initial print version of the 2008-2009 HRSDC Departmental Performance Report.
| Location: Page 3 - Table of contents, title for Section 1.4. Revision: "Corporate Risk Analysis" replaces "Corporate Risk Profile" Rationale for revision: The table of contents did not reflect the proper title for section 1.4. |
| Location: Page 15 - Section 1.4, Corporate Risk Analysis, second paragraph, last sentence. Revision: "Furthermore, HRSDC launched a risk management intranet site…" replaces "Furthermore, HRSDC launched a risk management website…" Rationale for revision: The Department needed to clarify that the risk management homepage is not an external site. |
| Location: Page 20 - Section 1.5, Workplace Skills Performance Indicator, third indicator, the data source. Revision: "Survey of Labour and Income Dynamics" replaces "Survey of Labour and Income" Rationale for revision: The data source was incorrectly cited. |
| Location: Page 56 - Section 2.2.3, Strategic Outcome 2, Learning Program, Performance Analysis, second paragraph. Revision: "In 2008-2009, the Department invested $2.0 billion in loans and $143.2 million in 86,000 Canada Study Grants and Canada Access Grants, compared to investments of 1.9 billion in loans and 127.9 million in 75,300 grants in the year 2005-2006." replaces "In 2008-2009, the Department invested $2.0 billion in loans and $143.2 million in 86,000 Canada Study Grants and Canada Access Grants, compared to investments of 1.6 billion in loans and 64.5 million in 53,404 grants in the year 2005-2006" Rationale for revision: The initial figures cited were from the year 2004-2005 instead of 2005-2006. |
| Location: Page 59 - Strategic Outcome 3, Program Activity Description, last sentence. Revision: "Operating Expenditures for this program activity are funded from the Departmental Reference Levels" replaces "Operating Expenditures for this program activity are funded from the Departmental Reference" Rationale for revision: The funding source was incorrectly cited. |
| Location: Page 63 - Labour Performance Summary, first paragraph of the performance summary, last sentence. Revision: "However, the domestic contribution stream for social dialogue projects in Canada has had a lower take-up than expected" replaces "However, the domestic contribution stream for social dialogue projects in Canada has had a lower than expected" Rationale for revision: The addition of the word "take-up" clarifies the sentence. |
Message from the Minister of Human Resources and Skills Development

I am pleased to present the 2008-2009 Departmental Performance Report for Human Resources and Skills Development Canada. This year's Report underlines the impact of the global economic downturn on the Canadian economy and provides details on the measures put in place to help Canadian workers and their families.
Our Government is commited to helping Canadians who are out of work get back on their feet and find good jobs. That is why, through Canada's Economic Action Plan, we increased our investment in skills development to assist Canadians, in all regions of the country. We are providing an additional $1.5 billion to provinces and territories through existing agreements to ensure an estimated 150,000 Canadians receive training that will help them develop the skills to find jobs in the new economy. Through, Career Transition Assistance, we will help some 40,000 laid-off long tenured workers upgrade their skills to get a new job.
We're investing in Canadians of all ages and work experiences. That's why we increased our support to older workers by providing an additional $60 million over three years for the Targeted Initiative for Older Workers. We also made a $75 million investment to help newcomers get their credentials recognized faster and improve their integration into the labour market; and invested an additional $100 million over three years in the Aboriginal Skills and Employment Partnership to help Aboriginal Canadians find long-term employment.
We want to help students gain valuable experience and earn money for school. That's why we're helping out Canadian youth by increased funding of $20 million for the Canada Summer Jobs Program and a $15 million grant to the YMCA and YWCA for student work experience. We're also encouraging incentives for workers to complete their apprenticeship training in a Red Seal trade.
What's more is that we made post-secondary education more accessible by making important enhancements to the Canada Student Loans Program which will provide more upfront, non-repayable money to students and repayment assistance measures that are more responsive and fair. The grants alone will benefit over 245,000 students - that's 100,000 student's more than the previous program.
During the past year, we continued to support children, families and vulnerable Canadians seeking to improve their lives. For the third year in a row, we continue to help parents and families through the Universal Child Care Benefit. We are helping eligible people with severe disabilities, their families and others save for their long-term financial security by implementing the Registered Disability Savings Plan. In addition to supporting seniors through programs such as the Canadian Pension Plan, Old Age Security, and the Guaranteed Income Supplement, we helped promote the prevention of elder abuse through the New Horizons for Seniors Program. We also extended funding for the Homelessness Partnership Strategy to help homeless Canadians address their housing needs.
Service Canada plays an important role across the country in helping Canadians access the full range of government programs, services and benefits faster and easier. That's why we made significant efforts and investments to process increasing EI claims in a timely manner. This included improved automation of claim processing, hiring more staff, and increasing our hours of operations, where needed most.
Together, our Department's policies, programs and services are helping Canadians access the tools and supports they need to build a better, more secure and prosperous future for themselves and their families.
_______________________________________________
The Honourable Diane Finley, P.C., M.P.
Minister of Human Resources and Skills Development
Message from the Minister of Labour

Through the Labour Program, our government promotes safe, fair and productive workplaces and cooperative work relations across Canada by developing and implementing policies, programs and services in all sectors of the federal jurisdiction. By providing Canadian employers, workers and unions with the tools and resources they need, we are building a stronger and more competitive country.
The 2008-2009 Departmental Performance Report summarizes our recent efforts, put forth through the Labour Program, and highlights major accomplishments from the past year.
One such accomplishment was the resolution of 96.3% of all collective bargaining disputes without a work stoppage, thanks in large part to our mediation and conciliation services. In addition, our government launched the modernisation of Part III of the Canada Labour Code. The consultation process will allow us to gather the views of businesses, unions and employees regarding existing labour standards. The collected input will inform options for improving and updating the Code.
The design and implementation of the Wage Earner Protection Program (WEPP), which is a national program that reimburses eligible Canadian workers when their employer declares bankruptcy or becomes subject to receivership, was completed in 2008-2009. Through Canada�s Economic Action Plan, our government expanded the original legislation, which covered unpaid wages and vacation pay, to include termination and severance pay. The first payments to Canadians were processed in September 2008.
Promoting and protecting the success of Canadian businesses, the safety of Canadian workplaces and the well-being of Canadian employees are top priorities for our government, especially at this time of global economic difficulty. Through the Labour Program, we will continue to support Canada�s employers and workers and to foster safe workplaces and productive work relations to ensure the success of our economy now and in the future.
___________________________________________________
The Honourable Rona Ambrose, P.C., M.P.
Minister of Labour
Section I
Departmental Overview
1.1 Introduction: Raison d'�tre and Responsibilities
This document provides an account of the performance of Human Resources and Skills Development Canada (HRSDC) for the period from April 1, 2008 to March 31, 2009. It reports on the Department's achievements related to the commitments set out in the 2008-2009 Report on Plans and Priorities.
Section I is an overview designed to provide high-level information on the Department including the HRSDC, Service Canada and Labour Program missions. It includes the Program Activity Architecture; a description of the socio-economic environment; the corporate risk profile; a performance summary table; an outline of the contribution of priorities to strategic outcomes, including the Department's human resources and official languages indicators; the Department's expenditure profile; and its voted and statutory items. Section II includes detailed performance results by strategic outcome. Section III provides financial tables, a financial performance overview, information concerning specified purpose accounts, and consolidated financial statements for the Department. Section IV includes organizational information and website references.
Raison d'�tre
HRSDC's mission is to build a stronger and more competitive Canada, to support Canadians in making choices that help them live productive and rewarding lives, and to improve Canadians' quality of life.
To do this, HRSDC:
- develops policies that make Canada a society in which all Canadians can use their talents, skills and resources to participate in learning, work and their communities;
- creates programs and supports initiatives that help Canadians move through life's transitions � from families with children to seniors, from school to work, from one job to another, from unemployment to employment, from the workforce to retirement; and
- creates better outcomes for Canadians by providing service excellence through Service Canada and other partners.
The mission of the federal Labour Program is to ensure safe, fair, and productive workplaces and cooperative workplace relations, as well as effective international labour and employment standard.
To do this, the Labour Program:
- administers and enforces workplace legislation and regulations, such as health and safety standards; employment standards; and industrial relations under the Canada Labour Code; the Employment Equity Act, which promotes workplace equality by removing the barriers that women, Aboriginal peoples, people with disabilities and visible minorities face on the job and provided fire protection services in federal buildings and on reserves; administers the Government Employees' Compensation Act; and provides oversight of the Wage Earner Protection Program;
- develops innovative policy and program responses to changes in workplaces and employer-employee relations and carries out research and disseminates information and analysis on workplace, industrial relations, and labour law trends; and
- works closely with provincial and territorial governments, unions, employers, and international partners to enhance working conditions and ensure healthy and fair workplaces for all Canadians.
Human Resources and Skills Development Canada's programs and services are designed to achieve results across a broad range of social and labour market outcomes. Five strategic outcomes form the structure for reporting plans, priorities and resources in this report:
"Policies and programs that meet the human capital and social development needs of Canadians."
"Enhanced Canadian productivity and participation through efficient and inclusive labour markets, competitive workplaces, and access to learning."
"Safe, healthy, fair, stable, cooperative, productive workplaces and effective international labour standards."
"Enhanced income security, access to opportunities, and well-being for individuals, families and communities."
"Achieve better outcomes for Canadians through service excellence."
Responsibilities
Human Resources and Skills Development Canada is responsible for administering several Government of Canada laws under the following mandates:
- Improve the standard of living and quality of life of all Canadians by promoting a highly skilled and mobile labour force, and an efficient and inclusive labour market. The Minister of Human Resources and Skills Development has overall responsibility for the employment insurance program and the Employment Insurance Act, while the administration of that Act is the responsibility of the Canada Employment Insurance Commission.
- Promote social well-being and security. This includes the administration of the Canada Pension Plan, the Old Age Security Act, the Disability Savings Program and the Universal Child Care Benefit Act.
Furthermore, the Department of Human Resources and Skills Development Act provides for the appointment of a Minister of Labour who is responsible for the Canada Labour Code, the Employment Equity Act and the Government Employees Compensation Act, as well as other legislation on wages and working conditions. The mandate of the Minister of Labour is to promote safe, healthy, fair, stable, cooperative and productive workplaces.
The mandate of Service Canada is to work with federal departments, other orders of government and community service providers to bring services and benefits together in a single service delivery network to better serve Canadians.
The Human Resources and Skills Development Canada portfolio also includes the Policy Research Initiative, which leads horizontal research projects in support of the Government of Canada's medium-term policy agenda and identifies needs and priorities for future policy development
1.3 Socio-Economic Year in Review
The year 2008-2009 marked a significant shift in the economic conditions that characterized the Canadian economy and labour market. At the beginning of the year, the Canadian economy and labour market were defined by strong job creation, fiscal government surpluses largely due to high commodity prices, and strong domestic demand led by business investment and consumer spending on goods and services. In the summer of 2008, the Canadian economy hit the peak of 16 consecutive years of expanding economic growth. The economic fundamentals were considered strong, the unemployment rate was at its lowest level in 33 years, business and household finances were deemed robust by historical and international standards, and federal, provincial and territorial governments remained in strong fiscal positions.
The economic situation changed in the fall of 2008, with many of Canada's most important sectors shaken by the deep recession that began in the United States and has since spread to the global economy. The collapse of the U.S. housing market devastated exports of lumber and other construction materials, and U.S. household spending on Canadian exports of manufactured goods (most notably automobiles) stagnated. Housing and private investment also fell in 2008-2009 coupled with the decline in exports, spending and consumer goods.
The following gives a brief explanation of the socio-economic context as it pertains to each of the Department's Strategic Outcomes.
Enhanced Canadian productivity and participation through efficient and inclusive labour markets, competitive workplaces, and access to learning
The issues involved in ensuring an efficient labour market in early 2008 were related to slowing productivity and shortages of skilled labour in certain sectors. While productivity and skills shortages continue to remain long-term challenges, they have been overtaken by short-term growing unemployment rates, increased reliance on income support provided through the Employment Insurance (EI) program, and increased vulnerability of at-risk populations.
A huge decline in corporate profits has frozen Canadian business investment and hiring intentions and has resulted in the shedding of hundreds of thousands of jobs, particularly in the wholesale, retail trade, manufacturing and construction sectors. In turn, weak employment prospects have led households to curtail spending. In addition to a sharp drop in capital investment intensions, Canadian businesses cut back on payrolls. Employment dropped sharply at the start of 2009, largely in the construction and manufacturing sectors, and more prudent hiring results in a growing share of part-time employment at the expense of full-time jobs.
The reality of job losses and weak employment prospects has materialized, leading consumers to cut back sharply on spending in late 2008 and early 2009. After reaching a historical low of 5.8% in January 2008, Canada's unemployment rate rose rapidly to reach 8.0% in March 2009.
Canadians who are most at risk under normal economic conditions�such as Aboriginal people, workers without post-secondary education, people with disabilities, youth, students, low-income workers and older workers�can become further marginalized in the current economic climate. For instance, older workers are choosing to delay retirement and remain in the labour market longer, while employers are using early retirement as a tool to save money by reducing current workforce levels. For low-income workers and their families, reduced employment income is making it an even greater challenge to make ends meet. In other cases, workers with long employment histories are finding themselves permanently laid off and in need of transitional assistance or re-training opportunities to pursue alternative careers. Aboriginal people, who have traditionally had higher unemployment rates, are also finding it difficult to enter or remain in the labour market.
In the last quarter of 2008-2009, the Department implemented a broad-based strategy and operational measures to support workload requirements associated with the delivery of Canada's Economic Action Plan (Budget 2009) initiatives (e.g., EI measures, work-sharing arrangements, extension of the Wage Earner Protection Program, and enhanced funding support to provinces and territories for training and skills upgrading programs) while maintaining key performance indicators and service standards for HRSDC, Labour Program and Service Canada core programs during the economic downturn.
As a result of these three factors�rising unemployment rates, increased reliance on income support and vulnerability of at-risk populations�the Department's priorities shifted to a short-term focus that is immediately responsive to the economic downturn so that Canadian workers are able to re-enter the labour market as soon as possible.
Safe, healthy, fair, stable, cooperative, productive workplaces and effective international labour standards
Economic downturns�especially when they are as sudden and deep as the recession that began in October 2008�create significant tensions and uncertainties in the workplace. Employers begin to search for ways to support the survival of their businesses, often turning to layoffs, cost reduction measures and steps to boost efficiency. For their part, employees grow more concerned about the security of their jobs and incomes, as well as with preserving, as much as possible, the benefits provided to them and their families. These responses have the potential to generate heightened tensions between employers and employees, both at the bargaining table and in the workplace. If these tensions are not managed well, there is a significant risk that workplace relations will deteriorate, thereby diminishing the economy's capacity to recover and be well positioned for economic growth and strong work force relations when the recession ends.
The Labour Program rapidly shifted gears as the economic situation began to deteriorate in the fall of 2008. In an effort to avoid work stoppages that might make economic recovery more difficult, emphasis was placed on providing timely and proactive mediation and conciliation services to employers and unions entering into collective bargaining against the backdrop of declining profitability and slackening demand for labour. Resources were directed towards strengthening front line services in view of the fact that economic difficulties typically increase frictions, thereby heightening demand for timely inspections, investigations and adjudications with respect to workplace health and safety, dismissals and terminations. As a result of the Budget Implementation Act 2009 enhancements were made to the Wage Earner Protection Program, which provides support to workers whose employer declares bankruptcy or goes into receivership, to include termination and severance pay, along with the original coverage for unpaid wages and vacation pay. Finally, in view of the global nature of the downturn and the importance of free trade for a prosperous economic future, labour cooperation agreements with new free trade partners were made stronger.
Enhanced income security, access to opportunities, and well-being for individuals, families and communities
Faced with the pressures of global competition, employers have shifted risk to employees. More work is temporary, part-time or contracted out than in the past, and the demands on many regular employees have intensified. More work is in smaller firms and in the service sector, where unionization rates and wages have tended to be lower. In addition, projected demographic trends point to an aging society, which has placed unique pressures on the Income Security System, as well as on families assuming caregiving responsibilities.
Circumstances such as these bring unique pressures for communities, employers and workers. These pressures lead employers to adjust their workforce and task orientation in response to shifting conditions and cause workers to exercise all available options to obtain financial security, including re-training, EI and labour mobility. This is particularly relevant in communities that rely almost exclusively on one or two employers, such as the auto industry.
During this time of economic challenge and uncertainty, both consumers and business have cut spending and are investing less. Going forward, households are likely to remain cautious in their purchase and investment decisions. Reliance on Canada's public pension system has become ever more relevant for Canada's seniors. Ensuring that investments in Canada's pension system are secure is vital to the financial stability of Canada's seniors.
The difference in after-tax income (adjusted for family size and composition) between the top and bottom 20 percent of families in Canada widened during the past decade. While already a cause for concern, the income gap between the richest and poorest segments of society is at risk of growing substantially larger as many middle-income Canadians fall to the lower-income tax brackets as a result of current socio-economic pressures. Income tends to become more polarised in economic downturns. We can therefore expect income to become less evenly distributed as individuals in low-paying or more cyclically sensitive sectors lose their jobs while others remain employed. The recent increases in hourly wage rates suggest that the current recession may already be driving a wedge between employed and unemployed Canadians. The Department recognizes these trends and has ensured that financial assistance and services were provided to low-income families through the National Child Benefit and Canada Social Transfer in an effort to support early childhood development.
Achieve better outcomes for Canadians through service excellence
Through its Service Canada initiative, the Department has always been committed to delivering Government of Canada services with integrity, fairness and respect for personal privacy.
Over the past year, the number of unemployed workers and other people who require access to government services increased substantially, resulting in a growing workload in applications and processing. The global economic downturn increased the number of Canadians at risk of losing employment and facing a reduced standard of living. The result has been unprecedented volumes of EI claims and increased benefit processing workloads. Service Canada received a total of 3.1 million EI claims in 2008-2009, compared to 2.6 million in 2007-2008, a year-over-year increase of 19.3%.
The increase in demand for services was characterized by additional requests for Employment Insurance and labour market information. Consequently, Service Canada engaged in measures to ensure the Department was well-positioned to maintain service excellence to Canadians. Stronger partnerships with the regions, resulted in more effective management of workload and resources for benefit processing and payment. As well, extended hours of service to Call Centres and Service Canada Centers increased access and presence of the Department in rural communities. Human resource strategies, such as hiring additional staff, extended agreements with other federal departments and improved internet services through the citizen-centred service initiative were also implemented.
Demographic trends continue to present unique challenges as they continuously alter Service Canada's client base and demand for its services. In Canada's aging society, an older demographic means a greater number of clients and increased demand for Old Age Security and Canada Pension Plan services.
In keeping with the Department's commitment to sound stewardship of public funds, efforts were made to ensure overall service quality and integrity, which includes emphasizing core service delivery values such as personalization, open communication, security and privacy of personal information.
1.4 Corporate Risk Analysis
Over the past year, the Department continued to strengthen its risk management practices to manage its corporate risks effectively and support the implementation of integrated risk management across the organization. A risk management internal audit was conducted in 2008 and tabled at the Departmental Audit Committee along with the departmental management action plan to respond to the audit recommendations.
The Department has also established a process that requires periodic senior management discussions to review and assess corporate risks and the overall adequacy of the way these identified risks are managed. The new Portfolio Corporate Services Committee includes risk management roles and responsibilities in its terms of reference. Risk management arrangements were presented and discussed at the Departmental Audit Committee. Furthermore, HRSDC launched a risk management intranet site and published a handbook on integrated risk management to facilitate a more standard and consistent approach to risk management across the Department.
The Department identified four corporate risks with respect to achieving its objectives and commitments for 2008-2009. A summary of the key risks and the progress achieved in implementing their respective mitigation strategies is outlined below. The four areas identified by the Department as being susceptible to risks are:
- enhancing delivery of responsive policies, programs and services;
- managing existing information technology infrastructure;
- exercising appropriate governance and oversight; and
- recruiting and retaining a skilled and knowledgeable workforce.
Enhancing Delivery of Responsive Policies, Programs and Services
The growing and diverse range of funding instruments and service delivery partners poses a risk to the Department's ability to enhance delivery of responsive policies, programs and services to Canadians.
In 2008, the Department streamlined its governance structure to better reflect the relationships within the organization and thereby support its focus on excellence in policy development, program policy and design, service delivery, enabling services, and management. It also streamlined its management of grants and contributions and continued to implement the departmental action plan created in response to the Blue Ribbon Panel on Grants and Contributions. Further, the Department has focused its efforts on improving the overall quality of the Departmental Performance Measurement Framework by ensuring that it is both comprehensive in breadth and depth, and of high quality and relevance. In this respect, each branch has developed its own performance measurement framework, including logic model, performance indicators and data collection strategies. A department-wide Performance Measurement Roundtable has been established to improve the overall coordination and management of performance measurement and reporting activities throughout the Department. Finally, improvements have been made to multi-lateral and bi-lateral management structures, in the implementation of Labour Market Development Agreements (LMDAs) and Labour Market Agreements (LMAs), by way of regular bilateral discussions with provinces and territories.
Managing Existing Information Technology Infrastructure
Given the important role that information technology plays in supporting departmental priorities, the Department must manage the risk that the existing information technology infrastructure and recovery capability might not be adequate to ensure continued quality front-line service delivery to all Canadians.
Work continued on the Department's Information Technology Strategy to ensure that its information technology (IT) is fully aligned with departmental strategies and priorities, to provide additional insight into the current state of IT services, and to explore opportunities to innovate by leveraging knowledge and using technology more effectively across the organization. The Department developed a renewal road map to facilitate modernization of its technology infrastructure and associated software applications.
Exercising Appropriate Governance and Oversight
At risk is the Department's capacity to exercise appropriate governance and oversight of financial resources within an environment of transformation.
The Department completed its long-term capital plan and implemented a more thorough investment process; this included the establishment of an Investment Review Board. The Board has been operating since October 2008 and is responsible for overseeing the development of the investment plan, monitoring its implementation and providing executive oversight of the investment management process. The plan allows the organization to meet its obligations and responsibilities with respect to effective asset management responsibilities. The Department also adopted a Stage-Gate process for investment review. This process guides investment decisions, particularly in the area of information technology. Furthermore, the implementation of a more collaborative approach to planning�one that integrates business priorities, human resources plans and budgets�provides the foundation for assessing and understanding departmental financial needs.
Recruiting and Retaining a Skilled and Knowledgeable Workforce
There is a risk that the Department may not be able to ensure sustainable leadership and a skilled and knowledgeable workforce that would enable it to deliver on its mandate successfully and meet Canadians' expectations for accountable and responsive programs and services.
In line with the Clerk of the Privy Council's call to action to strive for excellence through public service renewal, the Department created the Renewal Secretariat in 2008-2009. The mandate of the Secretariat is to ensure that public service renewal is prevalent throughout the organization by engaging employees across the country. To address labour and skills shortages, the Department continues to use staffing flexibilities and strategies to align human resources with the current and future needs of the Department; this includes increased use of collective staffing and targeted recruitment, as well as efforts focused on attracting new talent. Senior management undertook a series of executive talent management reviews during 2008-2009, with follow-up actions and corresponding strategies to be presented at the 2009-2010 mid-year review.
The Department has continued to implement its Service Management Structural Model, a set of standardized organizational structures and work descriptions applied to the service management arm of Service Canada. On completion, the model reduced the number of work descriptions in the regions from approximately 3,500 to fewer than 30. The model sets a foundation on which increasingly transparent and efficient human resource management practices will be built. Such practices include standardized performance expectations, the delineation of career paths and competency certification. As a result, employees will know what is expected of them today, what opportunities will be available tomorrow, and which competencies they must develop to prepare for those opportunities.
The Department is also continuing to develop a more integrated corporate approach to risk management in order to manage ongoing strategic and operational risks effectively in delivering programs and services.
1.5 Performance Summary Tables
Total financial and human resources
Human Resources and Skills Development Canada's vision is to build a stronger and more competitive Canada, to support Canadians in making choices that help them live productive and rewarding lives, and to improve Canadians' quality of life. The tables below provide the organization's total financial and human resources.
| 2008-2009 | ||
|---|---|---|
| Planned Spending | Total Authorities | Actual Spending |
| 87,125.7 | 88,520.2 | 88,264.2 |
| 2008-2009 | ||
|---|---|---|
| Planned | Actual | Difference |
| 24,215 | 23,778 | 437 |
Financial information associated with strategic outcomes, performance indicators and 2008-2009 performance
The tables below provide information related to strategic outcomes, along with associated performance indicators and 2008-2009 performance. Financial information related to the implementation of these strategic outcomes is included.
| (millions of dollars) | 2007-2008 Actual Spending |
2008-2009 | ||||
|---|---|---|---|---|---|---|
| Main Estimates |
Planned Spending |
Total Authorities |
Actual Spending |
Alignment to Government of Canada Outcomes | ||
| Please note that no performance measurement targets for this strategic outcome were included in the 2008-2009 Report on Plans and Priorities. This strategic outcome was re-profiled as an internal service with Policy, Research and Communications. For performance results, please refer to Section II, pages 40 to 42. | ||||||
| Financial Resources (Gross) | ||||||
| Policy, Research and Communications | 199.3 | 185.0 | 185.2 | 193.4 | 192.3 | Income Security and employment for Canadians |
| (millions of dollars) | 2007-2008 Actual Spending |
2008-2009 | ||||
|---|---|---|---|---|---|---|
| Main Estimates* |
Planned Spending |
Total Authorities |
Actual Spending |
Alignment to Government of Canada Outcomes | ||
| * Employment Insurance Benefits (EI Part I and EI Part II) are excluded from Main Estimates number. | ||||||
| Financial Resources (Gross) | ||||||
| Labour Market | 14,908.3 | 1,327.1 | 16,375.7 | 17,704.9 | 17,629.8 | Income Security and employment for Canadians |
| Workplace Skills | 139.4 | 273.9 | 273.8 | 275.2 | 199.0 | An innovative and knowledge based economy |
| Learning | 2,283.8 | 2,096.6 | 2,096.6 | 2,136.2 | 2,134.4 | An innovative and knowledge based economy |
| Total Financial Resources (Gross) | 17,331.5 | 3,697.6 | 18,746.1 | 20,116.3 | 19,963.2 | |
| Performance Indicators | 2008-2009 Performance and Historical Results | |||||||||||||||||||||||||||||||||||||||||||||||
|---|---|---|---|---|---|---|---|---|---|---|---|---|---|---|---|---|---|---|---|---|---|---|---|---|---|---|---|---|---|---|---|---|---|---|---|---|---|---|---|---|---|---|---|---|---|---|---|---|
| 1 Please note
SLID data is for the 25-64
age group and participation ratios are computed based on annual employment levels. 2 Please note SLID data is for the 25-64 age group and participation ratios are computed based on annual employment levels. |
||||||||||||||||||||||||||||||||||||||||||||||||
| LABOUR MARKET | ||||||||||||||||||||||||||||||||||||||||||||||||
| Participation rate- [Data Source: Labour Force Survey] |
|
|||||||||||||||||||||||||||||||||||||||||||||||
| Percentage of unemployed looking for work for one year or more (52 weeks and over) [Data Source: Labour Force Survey ] |
|
|||||||||||||||||||||||||||||||||||||||||||||||
| Percentage of youth (aged 15-24) not in the labour force nor in school - [Data Source: Labour Force Survey] |
|
|||||||||||||||||||||||||||||||||||||||||||||||
| Unemployment Rates by Designated Group [ Data Source: Labour Force Survey ] * Labour Force Survey April 2009 ** Participation and Activity Limitation Survey - PALS 2006 (latest available) |
|
|||||||||||||||||||||||||||||||||||||||||||||||
| WORKPLACE SKILLS | ||||||||||||||||||||||||||||||||||||||||||||||||
| Labour productivity growth, for business sector- based on annual averages [ Data Source: Centre for the Study of Living Standards] |
|
|||||||||||||||||||||||||||||||||||||||||||||||
| Canada's productivity level as a percentage of the United States productivity level [Data Source: Centre for the Study of Living Standards] |
|
|||||||||||||||||||||||||||||||||||||||||||||||
| Percentage of working-age Canadians who score below the literacy level which is considered the minimum to cope in today's economy and society - [Data Source: Adult Literacy and Life Skills Survey] | The performance data is collected every ten years by Statistics Canada. The most recent data, from 2003, indicated that 42% of working-age Canadians score below the literacy level which is considered the minimum to cope in today's economy and society. Updated results will be available in 2013. | |||||||||||||||||||||||||||||||||||||||||||||||
| Percentage of adult workforce who participated in job-related formal training [Data Source: Survey of Labour and Income Dynamics]1 |
|
|||||||||||||||||||||||||||||||||||||||||||||||
| Percentage of adult workforce who participated in employer-supported job-related training [Data Source: Survey of Labour and Income Dynamics - Note that in future years, the ASETS survey will be used]2 |
|
|||||||||||||||||||||||||||||||||||||||||||||||
| LEARNING | ||||||||||||||||||||||||||||||||||||||||||||||||
| Percentage of the Canadian labour force (age 15 and older)) who have attained a post-secondary education certificate, diploma or degree (64.3% in 2008 for 25-64 year olds) - (For Canadians in the labour market) |
Historical data: Over the past five years, the percentage of the Canadian labour force (age 25-64) that has attained a post-secondary education has increased steadily, rising from 60.4% in 2004 to 64.3% in 2008 (44.2% in 1990). |
|||||||||||||||||||||||||||||||||||||||||||||||
| Proportion of Canadians (15-64) who were attending university or college, by age group (For school months: January to April and September to December) |
Historical data:Over the past five years, the proportion of Canadians, aged 17-21, who were attending university or college has steadily increased from 37.6% in 2004 to 38.1% in 2008 (30.4% in 1990). |
|||||||||||||||||||||||||||||||||||||||||||||||
| Percentage of Canadians (15 years and older) who have attained a post-secondary education certificate, diploma or degree by age group (results for 25 to 64 year olds can be compared to all other OECD countries) (For all Canadians) |
Historical data: Over the past five years, the percentage of Canadians age 25-64 who have attained a post-secondary education has increased steadily, rising from 56.9% in 2004 to 60.8% in 2008 (39.6% in 1990). |
|||||||||||||||||||||||||||||||||||||||||||||||
| (millions of dollars) | 2007-2008 Actual Spending |
2008-2009 | ||||
|---|---|---|---|---|---|---|
| Main Estimates |
Planned Spending |
Total Authorities |
Actual Spending |
Alignment to Government of Canada Outcomes | ||
| Financial Resources (Gross) | ||||||
| Labour | 239.3 | 237.9 | 271.4 | 262.7 | 261.2 | A Fair and Secure Marketplace |
| Performance Indicators | 2008-2009 Performance and Historical Results | |||||||||||||||||||||
|---|---|---|---|---|---|---|---|---|---|---|---|---|---|---|---|---|---|---|---|---|---|---|
| LABOUR | ||||||||||||||||||||||
| Percentage of total working days lost due to work stoppages. [Data source: Labour Program Records and files] |
|
|||||||||||||||||||||
| Representation of designated groups in all occupations and workforce availability,
employers covered under the Legislated Employment Equity Program [Data Sources: Representation of Designated Groups - derived from annual reports submitted by federally regulated employers to the Labour Program on June 1st covering the previous calendar year. The federal public sector submits directly to Parliament.] [Workforce availability - Census of Canada and the Physical demands limitation survey 2001 and 2006]. |
|
|||||||||||||||||||||
|
||||||||||||||||||||||
| (millions of dollars) | 2007-2008 Actual Spending |
2008-2009 | ||||
|---|---|---|---|---|---|---|
| Main Estimates* |
Planned Spending |
Total Authorities |
Actual Spending |
Alignment to Government of Canada Outcomes | ||
| *Canada Pension Plan Benefits are excluded from Main Estimates number. | ||||||
| Financial Resources (Gross) | ||||||
| Social Investment | 59,902.7 | 33,783.7 | 63,028.0 | 62,593.8 | 62,565.7 | Income Security and employment for Canadians |
| Children and Families | 2,482.1 | 2,488.3 | 2,488.2 | 2,554.1 | 2,553.9 | Income Security and employment for Canadians |
| Housing and Homelessness | 116.6 | 165.6 | 165.6 | 183.7 | 150.7 | Strong Economic Growth |
| Total Financial Resources (Gross) | 62,501.4 | 36,437.6 | 65,681.8 | 65,331.6 | 65,270.3 | |
| Performance Indicators | 2008-2009 Performance and Historical Results | |||||||||||||||||||||
|---|---|---|---|---|---|---|---|---|---|---|---|---|---|---|---|---|---|---|---|---|---|---|
| SOCIAL INVESTMENT | ||||||||||||||||||||||
| Number of and proportion of individual aged 65 years + who had low family income *[Statistics Canada, Survey on Labour and Income Dynamics (SLID)] |
|
|||||||||||||||||||||
| Number and proportion of individuals aged 65 years+ who would have had low income without public pension support [Statistics Canada, Survey on Labour and Income Dynamics (SLID)] |
|
|||||||||||||||||||||
| Percentage of recipient's individual income provided by the CPP-Disability benefit [Produced by Statistic Canada with T1 Tax File from Canada Revenue Agency (CRA)] |
|
|||||||||||||||||||||
| CHILDREN AND FAMILIES | ||||||||||||||||||||||
| Primary child care arrangements for children aged 1 to 5 years [Data source: Statistics Canada, 2001 and 2006 Census] * Census of Canada and the Physical demands limitation survey 2001. ** Census Census of Canada and the Physical demands limitation survey 2006. |
|
|||||||||||||||||||||
| Percentage of young children with average to advanced levels of verbal development [Data source: National Longitudinal Survey of Children and Youth (NLSCY) 2006-2007] |
|
|||||||||||||||||||||
| Percentage of young children living in families exhibiting positive family functioning [Survey of Children and Youth (NLSCY) 2006-2007] |
|
|||||||||||||||||||||
| Incidence of Low Income - Change in the number and percentage of families and children that fall below the post-tax low income cut-offs (post-tax LICOs), due to the National Child Benefit, in one year. | The National Child Benefit (NCB) initiative was responsible for preventing an estimated 59,000 families with 125,000 children from living in low income in 2004. This is a 12.1% reduction in the number of families with children living in low income that year. | |||||||||||||||||||||
| Depth of Low Income - Change in the aggregate amount of income that low-income families would need to reach the post-tax low income cut-offs (post-tax LICOs), due to the National Child Benefit, in one year. | The NCB reduced the depth of low income, or low-income gap, for families with children who received the NCB Supplement in 2004. NCB income benefits closed the low-income gap by a total of $740 million, or 18.5%, in 2004. They decreased the low-income gap by $310 million for single parents living in low income (a reduction of 17.7%) and by $430 million for two-parent families (a reduction of 19.0%). | |||||||||||||||||||||
| HOUSING AND HOMELESSNESS | ||||||||||||||||||||||
| Core Housing Need [Working availability - Census of Canada and the Physical demands limitation survey 2001 and 2006]. |
|
|||||||||||||||||||||
| (millions of dollars) | 2007-2008 Actual Spending |
2008-2009 | ||||
|---|---|---|---|---|---|---|
| Main Estimates |
Planned Spending |
Total Authorities |
Actual Spending |
Alignment to Government of Canada Outcomes | ||
| Financial Resources (Gross) | ||||||
| Seamless, Citizen-Centered Service | 2,581.6 | 594.1 | 602.2 | 860.5 | 836.9 | Government Affairs |
| Integrity | 903.9 | 880.2 | 880.2 | 973.9 | 971.1 | Government Affairs |
| Collaborative, Networked Government Service | 228.4 | 232.4 | 232.4 | 249.7 | 245.7 | Government Affairs |
| Total Financial Resources (Gross) | 3,713.9 | 1,706.7 | 1,714.8 | 2,084.1 | 2,053.7 | |
| Note: The same performance indicators are used at the strategic outcome and program activity levels. To avoid repetition, these indicators are included once in Section II (pages 77-78, 80-81 and 84). | |
| Service Indicators | 2008-2009 Performance and Historical Results |
|---|---|
1.6 Contribution of Priorities to Strategic Outcomes
| Operational Priorities | Type | Status | Links to Strategic Outcome(s) |
|---|---|---|---|
| PRIORITY: BUILDING THE KNOWLEDGE ADVANTAGE | |||
| Implement a new labour market training architecture. | Ongoing | MET ALL A new labour market training architecture was implemented, as demonstrated by the conclusion of three devolution Labour Market Development Agreements with Nova Scotia, Prince Edward Island and Newfoundland and Labrador to assist EI eligible clients, as well as by the conclusion of new bilateral Labour Market Agreements with six provinces and territories to assist people who are not eligible for EI. |
Enhanced Canadian productivity and participation through efficient and inclusive labour markets, competitive workplaces and access to learning. |
| Improve governance and management of the Employment Insurance Account. | Ongoing | MET ALL The Department provided policy, legislative and operational leadership in response to the Budget 2008 commitment to establish the Canada EI Financing Board (June 20, 2008). This included supporting the work of the nominating committee (July 2008) for the Board of Directors. |
Enhanced Canadian productivity and participation through efficient and inclusive labour markets, competitive workplaces and access to learning. |
| Address labour market challenges and opportunities faced by traditional industries. | Ongoing | MET ALL The Department supported sectoral initiatives by developing new approaches to improve workplace partnerships. A new Forestry Sector Council was launched in the summer of 2008 to work on critical human resources issues for the Canadian forest products sector. Among other responsibilities, this new council is engaged in sector-wide human resources strategic planning and the production of best practice guides and other tools that can be used readily by business and labour. |
Enhanced Canadian productivity and participation through efficient and inclusive labour markets, competitive workplaces and access to learning. |
| Support labour market integration of foreign-trained workers and facilitate entry of temporary foreign workers. | Ongoing | MET ALL The Foreign Credential Recognition (FCR) program engaged all provinces in discussions about strengthening their FCR capacity and launched work on a new Foreign Qualification Recognition Framework for presentation to First Ministers. In collaboration with Citizenship and Immigration Canada, the Temporary Foreign Worker Program (TFWP) negotiated Temporary Foreign Worker Annexes (Ontario and Alberta), which are enabling mechanisms to facilitate the entry of foreign nationals. The TFWP increased protection for foreign nationals through the development of letters of understanding (Alberta and Manitoba) to share information related to provincial legislation on labour standards. The TFWP also engaged with several provinces on region-specific entry and protection issues that temporary foreign workers face. The Expedited Labour Market Opinion Pilot Project was successfully implemented in British Columbia and Alberta. |
Enhanced Canadian productivity and participation through efficient and inclusive labour markets, competitive workplaces and access to learning. |
| Reduce barriers to mobility. | Ongoing | MET ALL The Department collaborated with provinces and territories to amend Chapter 7 (Labour Mobility) of the Agreement on Internal Trade to achieve full mobility across Canada. |
Enhanced Canadian productivity and participation through efficient and inclusive labour markets, competitive workplaces and access to learning. |
| Help Aboriginal peoples to obtain skills and training. | Ongoing | MET ALL Sixteen Aboriginal Skills and Employment Partnership (ASEP) projects were approved for the expansion and extension of the program to March 31, 2012. Work was also undertaken in support of Budget 2009 initiatives pertaining to further expansion of ASEP for up to 25 new projects and to the new Aboriginal Skills and Training Strategic Investment Fund. |
Enhanced Canadian productivity and participation through efficient and inclusive labour markets, competitive workplaces and access to learning. |
| Negotiate and implement labour cooperation agreements. | Ongoing | MET ALL The Department supported key governmental free trade and international human rights priorities and addressed key labour issues in the negotiation and implementation of labour cooperation agreements (LCAs). Three LCAs were concluded, and two of them-the Canada�Peru LCA and the Canada�Columbia LCA were signed during 2008-2009. |
Safe, healthy, fair, stable, cooperative workplaces and effective international labour standards. |
| Modernize Federal Financial Assistance to students as announced in the Advantage Canada Plan. | Ongoing | MET ALL Budget 2008 announced $123 million over four years to streamline and modernize the Canada Student Loans Program (CSLP) through measures such as a new Service Delivery Vision and a consolidated Repayment Assistance Program and a new Canada Student Grant Program. In addition, the Department reviewed Registered Education Savings Plan (RESP) industry practices and completed the transition to a single service provider for CSLP borrowers. |
Enhanced Canadian productivity and participation through efficient and inclusive labour markets, competitive workplaces and access to learning. |
| Develop policy options and instrument choices related to financial and non-financial barriers to learning. | Ongoing | MET ALL The Department finalized details of the new Canada Student Grants Program and Repayment Assistance Plan announced in Budget 2008. It also analyzed policy options to improve support for under-represented groups, renewed the International Academic Mobility initiative and implemented an outreach strategy targeted at low- and middle-income families. |
Enhanced Canadian productivity and participation through efficient and inclusive labour markets, competitive workplaces and access to learning. |
| PRIORITY: SUPPORTING CHILDREN, FAMILIES AND VULNERABLE CANADIANS | |||
| Develop policies to invest in families and those seeking to break free from poverty. | Previous commitment | MET ALL The Universal Child Care Plan gives parents the flexibility to balance work and family as they see fit. Through the Universal Child Care Benefit, parents receive $100 per month (up to $1,200 per year) for each child under the age of six. |
Enhanced income security, access to opportunities and well-being for individuals, families and communities. |
| Address issues facing people with disabilities through the development and implementation of initiatives such as the Canada Disability Savings Grant, Canada Disability Saving Bonds and Enabling Accessibility Fund. | Previous commitment | MET ALL The Grant and Bond were made available to Canadians beginning December 1, 2008. More than 12,500 Registered Disability Savings Plans were applied for or opened in 2008-2009. The first call for proposals for the Enabling Accessibility Fund was completed. A total of 816 proposals were reviewed, 166 small projects and 2 major projects were approved. All projects must meet EAF eligibility requirements and those of other applicable federal programs. |
Enhanced income security, access to opportunities and well-being for individuals, families and communities. |
| Develop transitional and supportive housing and improve programs that increase self-sufficiency. | Ongoing | MET ALL The percentage of all Homelessness Partnering Strategy investments in regionally delivered projects targeted to longer-term transitional and supportive housing and services increased to 78%, exceeding the 65% target. In 2008-2009, a total of nine housing units were created under the Surplus Federal Real Property for Homelessness Initiative. Of these, 78% were supportive housing and 22% were longer-term. |
Enhanced income security, access to opportunities and well-being for individuals, families and communities. |
| Address issues with a special emphasis on the issue of elder abuse and the implementation of the capital expansion component of the New Horizons for Seniors Program. | Previous commitment | MET ALL Sixteen contribution agreements were implemented under the Elder Abuse Awareness component of the New Horizons for Seniors Program. A call for proposals was completed for the two New Horizons for Seniors Program grant funding streams: Capital Assistance, and Community Participation and Leadership. As a result, the program supported a total of 1,714 grants for total funding of $26.3M. |
Enhanced income security, access to opportunities and well-being for individuals, families and communities |
| Protect Reservists' employment. | Ongoing | MET ALL On April 16, 2008, new legislation was passed to provide job protection for federally regulated reservists. |
Safe, healthy, fair, stable, cooperative workplaces and effective international labour standards. |
| Implement the Wage Earner Protection Program. | Ongoing | MET ALL The Wage Earner Protection Program and the legislative amendments announced in Budget 2009 to expand coverage of the Wage Earner Protection Program Act were successfully implemented. |
Safe, healthy, fair, stable, cooperative workplaces and effective international labour standards. |
| PRIORITY: PROVIDING THE HIGHEST LEVEL OF SERVICES TO CANADIANS | |||
| Focus on citizen centred service in the official language of choice. | Ongoing | MET ALL The Department implemented an action plan and a directive on active offer to ensure a consistent national approach in serving Canadians. Complaints regarding "Communication with and services to the public" received through the Commissioner of Official Languages have dropped by 60%. Several Service Canada College courses now include modules on official languages. Telephone services are consistently offered in both official languages. |
Achieve Better Outcomes for Canadians through Service Excellence. |
| Better cost management while enhancing quality of service. | Previous commitment | MET ALL Continued effort was dedicated to guide the location of points of service across Canada. This includes Service Canada Centres, Service Canada Community Offices and Scheduled Outreach Services. Work was also completed to improve the presentation and accessibility of information on the Service Canada Web site. Furthermore, the National Quality Assurance program was introduced in all call centres. |
Achieve Better Outcomes for Canadians through Service Excellence. |
| Simplify, standardize and automate processes to transform service delivery. | Previous commitment | MET ALL The progress made on Canada Pension Plan and EI automation and electronic services, along with the standardization of claims processing, has resulted in an effective response to increased volumes. There was an increase of 12 556 applications for the CPP and an increase of 508 260 applications for EI. |
Achieve Better Outcomes for Canadians through Service Excellence. |
| Invest in risk management and secure information sharing. | Ongoing | MET ALL Risk management has expanded services to assist clients in assessing and mitigating risk to service delivery at the front end and throughout the various stages of the service delivery life cycle. The Department has enhanced "My Service Canada Account" by combining multiple online services (EI, CPP/OAS) into a single security framework. It has also developed integrity risk management strategies to address operational risk in perspective to ensure that the right person receives the right service or benefit at the right time, and for the intended purpose. Information Sharing Agreements governing the exchange of information to and from the Social Insurance Register are being updated to ensure compliance with current legal, privacy and security requirements. |
Achieve Better Outcomes for Canadians through Service Excellence. |
| PRIORITY: STEWARDSHIP AND ACCOUNTABILITY | |||
| Demonstrate results and outcomes through new performance measurement strategies to address requirements of the Expenditure Management System. | Ongoing | MET ALL Progress is being made towards developing a robust and comprehensive performance measurement framework that emphasizes reporting on outcomes and trends over time. |
Policies and programs that meet the human capital and social development needs of Canadians. |
| Streamline management of grants and contributions and respond to the Blue Ribbon Panel on Grants and Contributions. | Previous commitment | MET ALL In 2008-2009, a 10% reduction was achieved in the total number of audits in 150 projects. This generated savings of approximately $2.25M and 3,000 work days for our partners and for HRSDC staff, as well as a reduction of 7,500 audit pages. This addresses the recommendations of the Blue Ribbon Panel on Grants and Contributions by reducing the administrative and paper burden and beginning to break through the web of rules. |
Policies and programs that meet the human capital and social development needs of Canadians. |
| Support the Deputy Minister in role as Accounting Officer. | Previous commitment | MET ALL A number of departmental financial management policies�including policies on membership fees, hospitality, commitment control, account verification and payment requisitioning, departmental bank accounts, and international travel�were developed or revised. Financial delegation instruments were reviewed, and a number of improvements for both streamlining and strengthening financial authorities across the Department were recommended. The Department will invest in the Departmental Action Plan to Modernize the Administration of HRSDC's Grants and Contributions Program. Deliverables for 2008-2009 include a more than 10% reduction in the paper and administrative burden within select programs. The Department has established an external Departmental Audit Committee (DAC), chaired by the Deputy Minister. The DAC is a key element of the Department's governance regime and plays a strategic advisory role to the Deputy Minister. |
Internal Services - Supports all Strategic Outcomes. |
| Decrease the paper burden on employers and ease administrative burden on taxpayers. | Previous commitment | EXCEEDED Significant changes were made to EI regulations in March 2009 which reduced the administrative and paper burden and support claims processing efficiency. This included two significant changes to the EI regulations for employers who submit Records of Employment online and changes that will improve the speed of payment to work-sharing claimants and reduce the administrative and paper burden on them and their employers. |
Achieve Better Outcomes for Canadians through Service Excellence. |
| Improve IT investment and planning processes. | New | MET ALL IT investment and planning processes have improved; this is substantiated by the creation of the Long-Term Capital Plan and the establishment of the IT Investment Management Process and the governance to oversee large information management and IT investments. |
Internal Services - Supports all Strategic Outcomes. |
| PRIORITY: HUMAN RESOURCE MANAGEMENT | |||
| Integrate HR considerations in business planning through a collaborative and partnering process that recognizes the current and future HR needs of the Department. | Ongoing | MET ALL Human resources planning framework has been improved to enhance support for integrated planning as well as for the development of collaborative networks. Developed an integrated planning process that links human resources planning to business objectives to enable the Department to assess the current business situation, anticipate changes, and identify corresponding current and future human resources needs and solutions. |
Internal Services - Supports all Strategic Outcomes |
| Use post-secondary recruitment to address skills shortages as well as recruitment of middle and senior managers. | Previous commitment | MET ALL The 2008-2009 commitment was met by hiring 615 post-secondary recruits. Furthermore, all executives have commitments in their Performance Management Agreements to focus on recruitment development. |
Internal Services - Supports all Strategic Outcomes. |
| Implement employee development activities as part of a retention strategy to maintain a skilled and knowledgeable workforce. | Previous commitment | MET ALL Programs for developing leadership capacities and promoting knowledge transfer and talent management were implemented in the Department. Developed an integrated EX Talent Management Framework entitled "Lead with Confidence, Deliver with Pride: The Cycle of Excellence" to provide governance on talent management for all executives. |
Internal Services - Supports all Strategic Outcomes. |
| Develop an organizational learning policy, to guide the required investments in learning and development of the workforce and deliver on commitment to service excellence. | Previous commitment | MET ALL A harmonized portfolio learning policy was developed to create one vision and mandate for the Department, across all business lines. |
Internal Services - Supports all Strategic Outcomes. |
| Expand the use of technology infrastructure and process transformation to support the modern and effective management of human resources. | Previous commitment | MET ALL Implementation of the Service Management Structural Model is on track, and the Regional Structural Model is also being implemented. The Enterprise Resource Planning project office, team and governance model were established along with an executive steering committee in order to replace the current human resources management information system. Innovative methodology and an innovative toolset were applied to manage short-term solutions such as Express Lane Staffing, the Integrated Staffing Log, and compensation and benefits process improvement. |
Internal Services - Supports all Strategic Outcomes. |
| Meet employment equity and official language requirements. | Ongoing | EXCEEDED The Department exceeded the expected representation targets; all of them were overachieved. Corporate second language training was delivered to help employees attain the language proficiency they need for their position and career progression. Official languages awareness sessions on parts V and VI and section 91 of the Official Languages Act were delivered to managers and employees |
Internal Services - Supports all Strategic Outcomes. |
| EMPLOYMENT EQUITY | |||
|---|---|---|---|
| Rating | Performance Indicators | 2008 - 2009 Target (Workforce Availability)a | Results |
| a WFA% is the external workforce availability estimate and is based on information collected in the 2001 Census. A comparison between the internal representation of designated group members in an employer's workforce and the external labour pool of designated group members from which the employer can reasonably be expected to recruit. This external labour pool takes into consideration occupational qualifications, eligibility and geographic recruitment area. | |||
| Exceeded expectations | Representation of visible minority persons | 9.4% | 9.6% |
| Exceeded expectations | Representation of Aboriginal persons | 3.1% | 3.9% |
| Exceeded expectations | Representation of people with disabilities | 3.4% | 6.8% |
| Exceeded expectations | Representation of women | 59.2% | 70.4% |
| OFFICIAL LANGUAGES COMPLAINTS | |||
|---|---|---|---|
| Rating | Performance Indicators | 2008 - 2009 Target | Results |
| Historical Data: Official languages complaints with regards to "Communication with and services to the public" and "Language of work" have decreased by over 50% compared with results reported in 2007-2008 DPR. In 2007-2008, the number of official complaints reported for "Communication with and services to the public" was 34 complaints and the number of complaints reported for "Language of work" was 15. | |||
| n/a | Communications with and services to the public | Actual results to be reported | 14 |
| n/a | Language of work | Actual results to be reported | 7 |
1.7 2008-2009 Expenditure Profile
Human Resources and Skills Development Canada (HRSDC) expenditures on programs and services total more than $88 billion, of which $83 billion, or 94%, directly benefits Canadians through Employment Insurance (EI), the Canada Pension Plan (CPP), Old Age Security (OAS), Universal Child Care Benefit, loans disbursed under the Canada Student Financial Assistance Act and other statutory transfer payment programs. Departmental expenditures were $1.6 billion in voted grants and contributions; $36.9 billion in statutory grants and contributions; and $2.1 billion for Employment Insurance Part II.
Consolidated Total: $88,264.2M
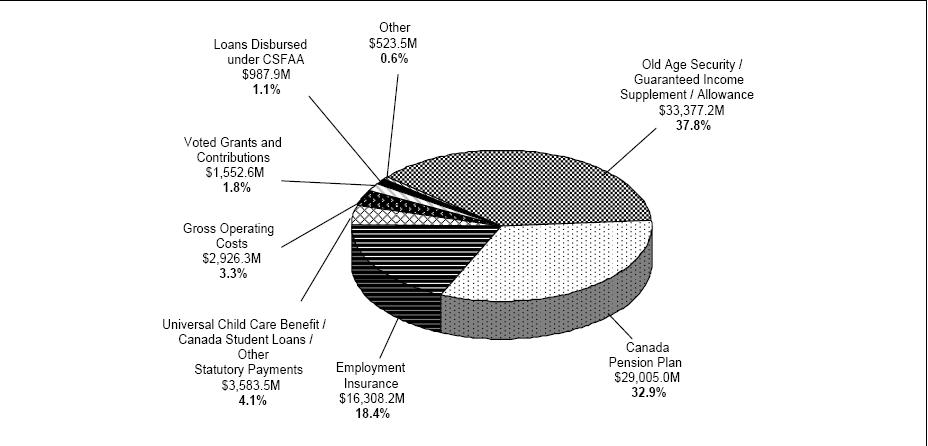
| Human Resources and Skills Development Canada - Gross Expenditures (in millions of dollars) |
Statutory Transfer Payments (in millions of dollars) |
||||
|---|---|---|---|---|---|
| a This amount ncludes payments related to Government Annuities Account and the Civil Service Insurance Fund. | |||||
| Budgetary | Grants and Contributions: | ||||
| Net Operating Costs | 1,093.5 | Old Age Security | 25,334.5 | ||
| Add Recoveries in relation to: | Guaranteed Income Supplement | 7,511.5 | |||
| Canada Pension Plan | 291.1 | Allowances | 531.2 | ||
| Employment Insurance Account | 1,427.1 | Other Statutory Payments: | |||
| Workers' Compensation | 106.1 | Universal Child Care Benefit | 2,547.8 | ||
| Other | 8.5 | 1,832.8 | Canada Education Savings Grant | 580.7 | |
| Gross Operating Costs | 2,926.3 | Canada Student Loans | 361.1 | ||
| Voted Grants and Contributions | 1,552.6 | Canada Learning Bond | 47.8 | ||
| Total Gross Expenditures | 4,478.9 | Wage Earner Protection Program | 3.7 | ||
| Canada Disability Savings Grant | 0.1 | 3,541.2 | |||
| Sub-Total | 36,918.4 | ||||
| Other � Workers' Compensation and | Canada Pension Plan Benefits | 29,005.0 | |||
| EI/CPP Charges and Recoveries | 523.5 | Employment Insurance Benefits | |||
| Non-Budgetary | Part I | 14,196.2 | |||
| Loans disbursed Canada Student | Part II | 2,112.0 | 16,308.2 | ||
| Financial Assistance Act(CSFAA) | 987.9 | Other Specified Purpose Accounts | 42.3a | ||
| Total Statutory Transfer Payments | 82,273.9 | ||||
Spending Trend
The figure below illustrates Human Resources and Skills Development Canada trend from 2006-2007 to 2008-2009. For the 2008-2009 fiscal year, Human Resources and Skills Development Canada spent $88.3 billion to meet the expected results of its program activities.
The 2006-2007 to 2008-2009 total authorized spending includes all Parliamentary appropriation and revenue sources, Main Estimates, Supplementary Estimates. The 2006-2007 to 2008-2009 planned spending corresponds to the forecasted planned spending presented in Report on Plans and Priorities from each respective year.
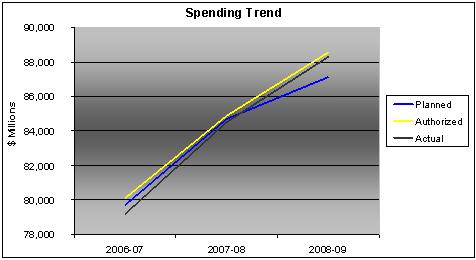
| Total Consolidated Expenditures (in millions of dollars) | |||
|---|---|---|---|
| 2006-2007 | 2007-2008 | 2008-2009 | |
| Planned | 79,713.2 | 84,700.4 | 87,125.7 |
| Authorized | 80,136.2 | 84,867.4 | 88,520.2 |
| Actual | 79,225.1 | 84,504.4 | 88,264.2 |
From 2006-2007 to 2007-2008, the increase in the actual and authorized spending is mainly attributable to a one time payment of $1.9 billion for the implementation of the Indian Residential Schools Settlement Agreement for 2007-2008 as well as an increase in statutory payments such as Old Age Security benefit payments of $1.7 billion and Canada Pension Plan costs of $1.4 billion.
From 2007-2008 to 2008-2009, the increase in the actual and authorized spending is mainly due to an increase of $2.0 billion in Employment Insurance costs, $1.6 billion for Canada Pension Plan costs and $1.4 billion for Old Age Security benefit payments.
For the planned spending, the increase from one year to the other is mostly explained by changes in forecasted statutory expenditures such as Canada Pension Plan benefits and Old Age Security benefit payments.
1.8 Voted and Statutory Items
| Vote # or Statutory Item (S) | Truncated Vote or Statutory Wording | 2006-2007 Actual Spending |
2007-2008 Actual Spending |
2008-2009 Main Estimatesa |
2008-2009 Actual Spending |
|---|---|---|---|---|---|
| 1 | Operating expenditures | 613.2 | 2,500.9 | 606.1 | 709.5 |
| 5 | Grants and contributions | 1,031.7 | 1,027.3 | 1,675.3 | 1,552.6 |
| 7 | Write-off of Debts | - | 0.4 | - | - |
| (S) | Minister of Human Resources and Social Development - Salary and motor car allowance | 0.1 | 0.1 | 0.1 | 0.1 |
| (S) | Minister of Labour and Minister of the Economic Development Agency of Canada for the Regions of Quebec - Salary and motor car allowance | 0.1 | 0.1 | 0.1 | 0.1 |
| (S) | Old Age Security Payments | 22,878.8 | 24,029.8 | 25,321.0 | 25,334.5 |
| (S) | Guaranteed Income Supplement Payments | 6,901.1 | 7,406.7 | 7,696.0 | 7,511.5 |
| (S) | Allowance Payments | 504.1 | 518.2 | 573.0 | 531.2 |
| (S) | Payments related to the direct financing arrangement under the Canada Student Financial Assistance Act | 246.4 | 292.3 | 328.0 | 298.2 |
| (S) | The provision of funds for interest payments to lending institutions under the Canada Student Loans Act | 0.1 | 0.1 | - | 0.1 |
| (S) | The provision of funds for liabilities including liabilities in the form of guaranteed loans under the Canada Student Loans Act | (17.8) | (19.1) | 6.8 | (14.5) |
| (S) | The provision of funds for interest and other payments to lending institutions and liabilities under the Canada Student Financial Assistance Act | 53.8 | 36.3 | 24.1 | 22.9 |
| (S) | Canada Study Grants to qualifying full and part-time students pursuant to the Canada Student Financial Assistance Act | 146.4 | 161.5 | 142.9 | 143.2 |
| (S) | Supplementary Retirement Benefits - Annuities agents' pensions | - | - | - | - |
| (S) | Universal Child Care Benefit Payments | 1,784.4 | 2,474.3 | 2,470.0 | 2,547.8 |
| (S) | Childcare transfer to Prov. & Terr. | 650.0 | - | - | - |
| (S) | Civil Service Insurance actuarial liability adjustments | 0.1 | - | 0.1 | 0.1 |
| (S) | Payments of compensation respecting government employees and merchant seamen | 48.8 | 39.5 | 43.0 | 46.2 |
| (S) | Canada Learning Bond payments to Registered Education Savings Plans (RESPs) trustees on behalf of RESP beneficiaries to support access to post-secondary education for children from low-income families | 21.8 | 35.8 | 34.0 | 47.8 |
| (S) | Canada Education Savings Grant payments to Registered Education Savings Plans (RESPs) trustees on behalf of RESP beneficiaries to encourage Canadians to save for post-secondary education for their children | 505.0 | 579.7 | 588.0 | 580.7 |
| (S) | Wage Earner Protection Program payments to eligible applicants owed wages and vacation pay from employers who are either bankrupt or in receivership as well as payments to trustees and receivers who will provide the necessary information to determine eligibility | - | - | - | 3.7 |
| (S) | Energy Cost Benefits | 3.7 | 0.1 | - | - |
| (S) | Canada Disability Savings Bond payments to Registered Disability Savings Plan (RDSP) issuers on behalf of RDSP beneficiaries to encourage long-term financial security of eligible individuals with disabilities | - | - | - | - |
| (S) | Canada Disability Savings Grant payments to Registered Disability Savings Plan (RDSP) issuers on behalf of RDSP beneficiaries to encourage long-term financial security of eligible individuals with disabilities | - | - | - | 0.1 |
| (S) | Spending of proceeds from disposal of Crown Assets | 0.3 | 0.1 | - | 0.1 |
| (S) | Labour Adjustment benefits in accordance with the terms and conditions prescribed by the Governor in Council to assist workers who have been laid off as a result of import competition, industrial restructuring, or severe economic disruption in an industry or region | - | - | - | - |
| (S) | Spending pursuant to section 12(4) of the Canada Education Saving Act | - | - | - | 0.1 |
| (S) | Contributions to employee benefit plans | 226.0 | 236.9 | 232.7 | 248.5 |
| Total Budgetary | 35,598.1 | 39,321.0 | 39,741.2 | 39,564.5 | |
| Plus: Non-Budgetary | |||||
| Loans disbursed under the Canada Student Financial Assistance Act | 1,231.9 | 1,099.5 | 906.3 | 987.9 | |
| Total Department | 36,830.0 | 40,420.5 | 40,647.5 | 40,552.4 | |
| Plus: Specified Purpose Accounts: | |||||
| Employment Insurance costs | 15,814.6 | 16,063.2 | - | 18,136.5 | |
| Canada Pension Plan costs | 26,689.2 | 28,135.7 | - | 29,699.1 | |
| Other Specified Purpose Accounts costs | 48.6 | 45.2 | - | 42.3 | |
| Departmental Employee Benefit Plan recoverable from Employment Insurance Account and Canada Pension Plan | (157.3) | (160.2) | - | (166.1) | |
| Total Consolidated Expenditures | 79,225.1 | 84,504.4 | 40,647.5 | 88,264.2 | |
| a. As published in Main Estimates 2008-2009. | |||||
Section II
Analysis of Program Activities by Strategic Outcomes
2.1 Strategic Outcome 1: Policies and programs that meet the human capital and social development needs of Canadians
Note: As a result of revision to the Department Program Activity Architecture, the Policy, Research and Communications program activity has been re-profiled as an internal service. This strategic outcome had no indicators or strategic results stated in the 2008-2009 Report on Plans and Priorities (RPP). This section will report only on the plans in support of the strategic outcome, which were developed for the 2008-2009 RPP.
Description of Strategic Outcome: Canada has a strong base of social programs to address the specific needs of particular segments of the Canadian population, such as seniors, children and families, and people with disabilities. To make effective choices for current and future policy and program action, HRSDC identifies emerging issues and opportunities, reviews the potential role of governments and non-governmental organizations in addressing these issues and opportunities, and identifies priority areas where policy action by HRSDC will add the greatest value.
2.1.1 Program Activity - Policy, Research and Communications
Program Activity Description
This program activity provides strategic policy advice and leadership by promoting key Government of Canada human resources and skills development policies, by developing and implementing key departmental frameworks and strategies, by engaging by collaborating with partners and Canadians through stakeholder relations and by advancing social and economic policy and knowledge development across the Department.
Benefits to Canadians
Policy, Research and Communications supports HRSDC programs delivered to Canadians by providing quality research to inform policy and program decisions, effective communication with the general public, and by carrying out assurance functions such as performance measurement, risk management and evaluation.
| 2008-2009 Financial Resources (millions of dollars) |
2008-2009 Human Resources (FTEs) |
||||
|---|---|---|---|---|---|
| Planned Spending |
Total Authorities |
Actual Spending |
Planned | Actual | Difference |
| 185.2 | 193.4 | 192.3 | 1,039 | 1,185 | (146) |
Plans and Achievements 2008-2009 - Policy, Research and Communications
| PLANS | 2008�2009 ACHIEVEMENTS |
|---|---|
| Strategic advice and policy research to support a Knowledge Advantage for Canada. | A large volume of research projects were completed during the 2008-2009, in many cases projects began 2 to 3 years earlier. In particular, considerable research was completed on the Retirement Income System and how to promote later retirement for an ageing workforce. Considerable research resources were shifted towards better understanding the extent and implications of the recession that developed in the Fall of 2008. Progress was made in demonstrating the value of smaller scale laboratory and field research experiments to better determine "what works" in targeted program interventions, particularly in the domain of Labour Market Information (LMI). The Department strengthened evidence-based dialogues and discussions through better synthesis products, policy research discussions and improved monitoring. |
| Advance knowledge development and management to support informed policy development and sound decision-making. | An HRSDC Policy Research Needs Assessment, a document identifying gaps in our knowledge was completed as a basis for planning upcoming research activities and finalizing the Research Plan for the central Policy Research Directorate. The Department completed the launch of key new tools tools to ensure knowledge is shared and preserved via the Knowledge Portal, which is now being populated with a rich array of Research Reports, Policy Research Notes, Policy Research Summaries and knowledge synthesis products (Findings, Knowledge Newsletter, Indicator and Data Bulletin). The toolkit also includes tools for management, development and sharing activities in development of the research plan and the HRSDC Data Plan and for information exchanges and policy development through online 'Communities'. Numerous knowledge sharing events were also held, ranging from dozens of smaller conferences to a program of Knowledge Talks. |
| Strategic advice and policy research on Children, Families and Seniors. | Developed a diagnostic on poverty and income security issues and provided policy advice
and research that advanced departmental thinking on housing and homelessness issues. Research conducted also identified
the Working Income Tax Benefit and Universal Child Care Benefit as poverty reduction and labour market tools. Comprehensive diagnostic work was undertaken, based on Census and other updated data, on under-represented groups in the labour market, including Aboriginal peoples, people with disabilities, women and immigrants. This work included an analysis of likely recession impacts on these groups. Advised the Expert Panel on Older Workers. |
| Increase Canadians' awareness of HRSDC programs and policies in support of Government of Canada priorities. | In 2008-2009, HRSDC
increased Canadians' awareness of its programs and policies by staging over 560 events for Ministers and the Department;
handling 834 media requests; making 3,200 updates to the departmental Web site; and producing 3 ministerial newsletters
and 500 print, audiovisual and multimedia projects of all sizes and types. One advertising campaign was aired. The Plan and Pay campaign encouraged youth to plan and save for their post-secondary education and to make use of Government of Canada resources, such as the Canada Student Loans Program (CSLP) and Canada Study Grants, to attend universities, colleges, trade schools or apprenticeship programs. |
| Increase engagement and collaboration with provinces, territories, partners and Canadians through stakeholder relations and other activities to ensure better, more innovative and more complementary policy initiatives. | Increased engagement and collaboration with provinces, including an increase of over 35
percent in multilateral teleconferences and face-to-face meetings relating to the Forum of Labour Market Ministers
(FLMM) and the Deputy Ministers for Financial Assistance
to Students. This increase in meetings led to new involvement at the ministerial level; to the inclusion of
FLMM announcements in the January 16, 2009, First Ministers'
Meeting and Budget 2009; and to the official F/P/T signing of Agreement on Internal Trade amendments relating to
labour mobility. Collaborative work with provinces and territories continued, as evidenced by a successful federal, provincial, and territorial (F/P/T) Deputy Ministers Responsible for Social Services retreat in June 2008. This retreat led to additional F/P/T work on poverty and vulnerable groups, social inclusion, horizontal policy development, and early childhood development. F/P/T work in this sector continued in areas of joint interest including people with disabilities, income security and child welfare. With respect to multilateral F/P/T engagement on seniors, officials continued to move forward on the work mandated by F/P/T Ministers in 2007 with a view to reporting back to Ministers in September 2009. Areas of focus for F/P/T work on seniors include financial security, safety and security of seniors, positive images of aging, and healthy and active aging. F/P/T Deputy Ministers Responsible for Seniors held teleconferences in June 2008, August 2008 and March 2009. |
2.2 Strategic Outcome 2: Enhanced Canadian productivity and participation through efficient and inclusive labour markets, competitive workplaces and access to learning
Description of Strategic Outcome: This strategic outcome has three Program Activities: Labour Market, Workplace Skills and Learning. The aim of this strategic outcome is to strengthen the Canadian economy by supporting and assisting individual Canadians in shaping their economic future. To achieve this goal, HRSDC assists Canadians with income support during labour market challenges such as the current economic downturn, funds skills and training development to enable Canadians to pursue new employment opportunities, and provides financial assistance and incentives to help Canadians access the post-secondary education they need to participate in the knowledge economy.
2.2.1 Program Activity - Labour Market
Program Activity Description
This program activity is comprised of EI and labour market programs. EI programs promote individual well-being, economic stability and a flexible labour market by providing temporary income support to unemployed workers who qualify under Part I of the Employment Insurance Act. EI encompasses a wide range of benefits to address the needs of workers and the labour market, including Canadians who are sick, pregnant, or caring for a newborn or adopted child, as well as those who must care for a family member who is seriously ill with a significant risk of death. Labour market programs provide programs and services that are funded from Departmental Reference Levels and, for those programs established under Part II of the Employment Insurance Act, the Employment Insurance Account. These programs enable Canadians, including unemployed adults and targeted groups such as youth, persons with disabilities and Aboriginal peoples, to develop their skills; they also encourage Canadians to invest in themselves and become self-reliant and more adaptable to labour market changes.
Benefits to Canadians
Labour market programs are essential to help workers and those who are seeking employment to maximize their potential during changing circumstances-both personal and in the labour market. By giving Canadian workers the flexibility and support necessary to pursue skills and employment opportunities, programs such as EI enable them to become more self-reliant and better able to adapt to labour market change. Furthermore, labour market programming enables Canadians, including under-represented groups and vulnerable workers, to become part of an inclusive labour force by helping them acquire the skills they need to find and maintain productive employment.
| 2008-2009 Financial Resources (millions of dollars) |
2008-2009 Human Resources (FTEs) |
||||
|---|---|---|---|---|---|
| Planned Spending |
Total Authorities |
Actual Spending |
Planned | Actual | Difference |
| 16,375.7 | 17,704.9 | 17,629.8 | 328 | 263 | 65 |
| Labour Market Program Performance Summary | ||||
|---|---|---|---|---|
| Expected Results |
Performance Indicators |
Targets | Performance Status and Historical Results |
Performance Summary |
| Efficient and inclusive labour market. | Number of clients employed and / or returns to school following an employment program intervention and as a proportion of the total number of clients who complete their employment program intervention(s).Clients Employed/Returns to School. | 207,000 - 227,000 | EXCEEDED 242,682 Historical results 2007: 221,787 2006: n/a |
Through Labour Market Development Agreements in place across the country, HRSDC supports
programming that enables Canadians, including under-represented groups and vulnerable workers, to acquire skills
to find and maintain productive employment. Emphasis has been placed on ensuring that programs respond to the needs
of workers, employers and stakeholders in a challenging economic environment. The total number of clients who became employed or returned to school following an intervention was 242,682, which exceeded the target and represented an increase of 9.4% over the previous year. This includes clients in regular Employment Benefits and Support Measures, Aboriginal and youth programming, and in the Opportunities Fund. The impact of the current economic downturn on results was not felt until the last quarter of the fiscal year, when clients employed results began to decline. Overall, this decline was offset by increases in the number of returns to school. A total of 32,713 Aboriginal and youth clients either became employed or returned to school after completing an intervention, an increase of 6.9% compared to the previous year. The Opportunities Fund helped 1,869 clients obtain employment, an increase of 15.7% compared to the previous year. |
| Proportion: 55-60% | EXCEEDED 61.2% Historical results 2007: 60.76% 2006: n/a |
A total of 300,378 client action plans were completed. Of these, 61.2% either found work or returned to school, which exceeded the target and represented an increase of 1.1% compared to the previous year. | ||
| Number of clients who become employed or return to school as a result of their participation in support programs geared to facilitate entry into the workforce or school (Job Ready/ Job Search) | 87,000 - 95,000 | EXCEEDED 113,548 Historical results 2007: 105,296 2006: n/a |
A total of 113,548 clients became employed or returned to school as a result of participating in support programs designed to help clients find a good job match as quickly as possible. This exceeded the target and represented an increase of 7.8% compared to the previous year. | |
| Proportion of the total number of Job Ready/Job Search clients who complete their employment program intervention. | Proportion: 55-60% | MET ALL 58.9% |
Of the 181,974 client action plans closed, 107,188 clients completed their employment program intervention. This met the target and represented an increase of 3.7% compared to the previous year. | |
| Number of clients who become employed or return to school as a result of their participation in benefit programs geared towards gaining work experience, improving job skills or starting a new business (Developmental). | 118,000 - 130,000 | MET ALL 129,952 Historical results 2007: 123,845 2006: n/a |
A total of 129,952 clients either found work or returned to school after participating in benefit programs designed to provide work experience, obtain training on the job, or support in starting their own business. This met the target and represented an increase of 4.9% compared to the previous year. | |
| Number of clients participating in Skills Development programming; and proportion of the total number of clients participating in programs geared towards gaining work experience, improving job skills or starting a new business (Developmental). | 80,000 - 89,000 | MET ALL 82,606 Historical results 2007: 75,203 2006: n/a |
A total of 82,606 clients participated in Skills Development - Regular, which met the target and represented an increase of 9.8% compared to the previous year | |
| Proportion: 65-70% | EXCEEDED 75.8% |
Of all clients participating in developmental programming (also referred to as employment benefits: Targeted Wage Subsidies, Self-Employment, Job Creation Partnerships, Skills Development), 75.8% participated in Skills Development - Regular. This exceeded the target and was 3.6% higher than the previous year | ||
| Number of apprenticeship clients who received Benefits provided through EI Part I or II (Developmental). | 53,000 - 59,000 | EXCEEDED 65,879 Historical Results 2007: 58,195 2006: n/a |
A total of 65,879 clients participated in Skills Development - Apprentice training. This exceeded the target, and was 13.2% higher than the previous year. | |
Performance Analysis
Much of the 2008-2009 performance analysis of the Labour Market program activity pertains to responses to Budget 2007, 2008 and 2009 announcements. In support of these announcements, the Department made significant contributions to the development of new labour market architecture to support the Government of Canada's goal of creating the best-educated, most highly skilled and most flexible workforce in the world and to help Canadians (including the under-represented groups and vulnerable workers) acquire skills to find and maintain productive employment.
The first of three contributions to this commitment was the transfer of the remaining co-managed Labour Market Development Agreements (LMDA) to the provinces and territories (Nova Scotia, Prince Edward Island, and Newfoundland and Labrador) in recognition of the fact that they are best placed to design and deliver labour market training to individuals. In 2008-2009, 242,682 clients were employed or returned to school following an EI Part II employment program intervention through the LMDAs.
Secondly, four new bilateral Labour Market Agreements were concluded with provinces and territories (Nova Scotia, Prince Edward Island, Quebec, and Manitoba) in 2008-2009 to implement Budget 2008 commitments to extend employment and skills training to those who are not eligible for EI-funded training.
Finally, the third contribution towards a new labour market architecture involved exploring the feasibility of transferring federal labour market programs for older workers, youth and people with disabilities to provinces and territories. While progress was made in outlining the scope and content of HRSDC's work in this regard, the work was put on hold while the Department focused on the 2009 economic stimulus package, which involved several new budgetary initiatives delivered in partnership with the provinces and territories.
Improvements were also made to the management of the EI account through the establishment of the Canada Employment Insurance Financing Board as committed to in Budget 2008. HRSDC was instrumental in providing policy, legislative and operational leadership in establishing the Board; this included bringing sections of the Canada Employment Insurance Financing Board Act into force by Order in Council.
HRSDC recognizes the importance of partnerships with other federal departments, agencies, governments and external stakeholders to meet the needs of Canadians who face barriers to labour force participation. A 2008-2009 commitment for the Department was to assess, develop and implement options for a post-2009 Aboriginal labour market strategy. Progress was made on this commitment, with the completion of a performance measurement framework and reporting strategy as well as a policy framework for a new Aboriginal Employment and Training Program.
In 2008-2009, the Aboriginal Human Resources Development Strategy assisted 59,782 Aboriginal clients to find, obtain and keep employment. Of the approximately 500,000 Aboriginal clients assisted since 1999, over 160,000 have found meaningful productive jobs (this includes 66,543 Aboriginal youth), and over 53,000 returned to school.
In addition to the initial 9 projects under the Aboriginal Skills and Employment Partnership (ASEP) program which began in 2003 and all ended by March 31, 2009, another 16 projects were approved throughout 2008-2009, for the $105 million expansion and extension of the program to March 31, 2012. In 2008-2009, 2,667 Aboriginal clients were served through the ASEP projects for a total of 6,826 served by the projects since 2003. In addition 3,716 training interventions took place in 2008-2009 resulting in a total of 9,187 training interventions under the existing projects by March 31, 2009. In 2008-2009, 2,092 individuals were employed bringing the total of number of employed to 3,272 Aboriginal individuals as a result of the existing ASEP projects.
While the Department followed through on priorities and Budget 2007 and 2008 commitments, it also supported announcements made in Budget 2009 in response to dramatic changes in the economy and the labour market.
Multiple initiatives requiring stakeholder engagement, policy work and program development. Those new initiatives undertaken within the Labour Market program activity include:
- extending EI Part I Duration;
- extending Work-Sharing Agreement weeks;
- Career Transition Assistance initiative;
- training enhancements for Labour Market Development Agreements;
- sustained funding for the Aboriginal Human Resources Development Strategy into 2009-2010;
- establishment of the new Aboriginal Skills and Training Strategic Investment Fund;
- extension of the Aboriginal Skills and Employment Partnerships program;
- an increase to the Canada Summer Jobs budget (YMCA and YWCA Grants for Youth Internships);
- enhancing access to skills training and adjustment needs of older workers; and
- creation of the Strategic Training and Transition Fund.
With the Budget 2009 announcement, the Government is providing an extra five weeks of EI benefits nationally and increasing the maximum duration of EI benefits from 45 to 50 weeks. The Government also announced the Career Transition Assistance initiative, which provides extended EI income benefits to long-tenured workers participating in longer-term training (Extended EI and Training Incentive) and will allow earlier access to benefits for eligible workers who invest in their own training using some or all of their severance package (Severance Investment in Training Initiative).
Also included in Budget 2009 were the new Aboriginal Skills and Training Strategic Investment Fund, which will include post 2010 Aboriginal labour market policy directions, and additional funding for the ASEP program. An additional $100 million was committed to ASEP for up to 25 additional projects. As a result, five projects recommended from the 2007 request for proposals were further developed, and a new request for proposals was launched in mid-March 2009.
Further examples of 2008-2009 accomplishments for the 2009 initiatives listed above can be found at http://www.fin.gc.ca/pub/report-rapport/2009-1/index-eng.asp.
Lessons Learned
Since the Labour Market and Workplace Skills program activities were managed together in 2008-2009, the following information pertains to both, and as such, it will not be repeated in the "Lessons learned" section under Workplace Skills. The lessons learned for these program activities pertain to a need for increased performance measurement and to areas where program changes can be improved as informed by evaluations and/or review of delivery or services.
Performance Measurement
As noted in past Management and Accountability Framework assessments by the Treasury Board of Canada Secretariat, there is an increased focus on accountability. In recognition of the fact that work in this area would improve reporting significantly, a 2008-2009 Performance Measurement Framework (PMF) was developed for the Labour Market and Workplace Skills program. Additionally, the Treasury Board of Canada Secretariat approved a 2009-2010 Program Activity Architecture that revised the strategic outcome and combined the Labour Market and Workplace Skills program activities to one program activity: Skills and Employment.
While development of the PMF improved reporting, it also highlighted the need for a more focused and detailed framework that would better respond to requirements for a full evidence-based Management, Resources and Results Structure. Throughout 2008-2009, a significant amount of work was undertaken to develop a logic model and storyline that would provide a more robust and comprehensive depiction of the programs managed under the new Skills and Employment program activity. This exercise proved very worthwhile, since it also served as a means to perform improved analysis of program outcomes and expenditures.
Awareness - The Opportunities Fund for Persons with Disabilities
As part of the summative evaluation of the Opportunities Fund conducted in 2008, a qualitative assessment of program duplication with other jurisdictions was conducted. Some medium-level overlap with other available programming was noted in the areas of eligible activities and sources of funding. Overall, however, the assessment noted that the Opportunities Fund and the Labour Market Agreements for Persons with Disabilities are complementary from a process, clientele, eligibility and intervention perspective. Furthermore, based on administrative data analysis, the evaluation shows that there is minimal client overlap between the Opportunities Fund and other HRSDC employment programs, as well as minimal overlap between Opportunities Fund interventions and other HRSDC employment program interventions (6.6 percent).
However, evidence indicates that greater promotion of the Opportunities Fund program is necessary. Although specific projects may have built-in awareness activities, there is no systematic approach to promoting the Opportunities Fund program to clients, employers and service providers. According to Opportunities Fund program officials, demand for programs currently exceeds program funding. Overall, clients, employers and sponsors were satisfied with the programs and services received: 71 percent of clients surveyed were satisfied or very satisfied with their participation in the Opportunities Fund; 14 percent were dissatisfied or very dissatisfied; and 20 percent were dissatisfied or very dissatisfied with the extent to which they were informed about what training and employment programs and services are available and how to access them. The Opportunities Fund website and promotional/communication products are currently being updated to make them easier to understand, and in particular to use plain language. Standard communication and wording that explains program eligibility and the reasons for approval or rejection have also been developed and are used to explain decisions to proponents or individuals.
Program Administration - Literacy programming
Levels of adult literacy and essential skills have a significant impact on a wide variety of social and economic outcomes. Labour markets recognize and value these skills, and at the same time, adult literacy and essential skills are strongly associated with social participation and well-being. Three former HRSDC programs-namely, the National Literacy Program, the Office of Learning Technologies and the Learning Initiatives Program-have all contributed to enhancing literacy and essential skills for Canadians. It was determined that a single set of terms and conditions that harmonized these objectives and outcomes would improve spending efficiency and programming effectiveness.
As a result, the Adult Learning, Literacy and Essential Skills Program (ALLESP) was developed in 2006 to realign and integrate the programs. The ALLESP is administered by the Office of Literacy and Essential Skills. The realignment is resulting in increased efficiency and effectiveness as a result of improved coordination of program activities, streamlined procedures and better allocation of resources. The ALLESP builds on past successes, but it also addresses shortcomings identified through stakeholder experiences and evaluations, namely by increasing the targeting of particular groups, building and sharing expertise, and increasing program coordination and coherence by identifying strategic priorities.
Program Delivery - Temporary Foreign Worker Program
The Temporary Foreign Worker Program was restructured to maximize efficiency and introduce significant changes to the way the program is delivered. With this, operational improvements and a monitoring and compliance regime are being implemented in the program. Internally, a new monitoring and compliance division was established and a robust and evolving suite of tools and processes for tracking employer performance and responding to violations of program requirements was set up. The changes received positive media coverage, and employers have been very cooperative. Additionally, collaboration with regions was strengthened and significant progress was made in addressing regional inconsistencies in program delivery.
Plans and Achievements 2008-2009 - Labour Market
| PLANS | 2008�2009 ACHIEVEMENTS |
|---|---|
| Increase workforce participation and develop the skills of Canadians by working with provinces, territories and partners in the implementation of strategies that will eliminate barriers to employment and improve choices and opportunities. This was achieved through the following: | |
| Lead development of a new labour market training architecture to make labour market training more widely available. | Negotiated the transfer of non-devolved Labour Market Development Agreements to provinces
and territories for delivery of training programs to EI-eligible
clients. New devolution Labour Market Development Agreements were signed with Nova Scotia, Prince Edward Island, and Newfoundland and Labrador. Negotiated a new generation of labour market agreements for non-EI-eligible clients to support social assistance recipients, immigrants, people with disabilities, youth, older workers and Aboriginal people. New bilateral labour market agreements were signed with Prince Edward Island, Nova Scotia, Quebec and Manitoba to implement commitments to extend employment and skills training to individuals who are not eligible for EI-funded training. |
| Ensure that the EI program continues to respond to the temporary income support needs of working Canadians | Provided policy, legislative and operational leadership in establishing the Canada Employment
Insurance Financing Board. Developed options and plans to support decisions related to EI pilot projects. The five-year review of EI regional boundaries was concluded, resulting in the current EI regional boundaries remaining in place. The EI transitional measures were extended for 18 months to complete the adjustment period for the current EI regional boundaries. Through the Budget 2009 announcement made in January, the Government made an extra five weeks of EI benefits available nationally; this extension was previously offered in EI regions with high unemployment as part of a pilot project. The Government is also increasing the maximum duration of EI benefits from 45 to 50 weeks. Measures that provide extended EI income benefits for long-tenured workers participating in longer-term training (Extended EI and Training Incentive) and that allow earlier access to benefits for eligible workers who invest in their own training using some or all of their severance package (Severance Investment in Training Initiative) were also announced in Budget 2009. |
| Develop and implement strategies to enhance the skills of Aboriginal people. | Implemented an additional 16 partnerships as a result of the 2007 expansion and extension
of the Aboriginal Skills and Employment Partnership program. Budget 2009 committed an additional $100 million, which
is expected to result in up to 25 additional partnerships. Co-sponsored an Ontario forum on innovative approaches to increasing Aboriginal health human resources. Worked with Indian and Northern Affairs Canada and four Aboriginal Human Resources Development Agreement holders. Worked with the Aboriginal Apprenticeship Board of Ontario, the Industry Training Authority of British Columbia and new developments in Nova Scotia to support innovative pan-Canadian initiatives to ensure the participation of Aboriginal people in skilled trades and apprenticeships. The Aboriginal Skills and Training Strategic Investment Fund, which will include the post 2010 Aboriginal labour market policy directions and additional funding for the Aboriginal Skills and Employment Partnerships, were approved in Budget 2009. |
| Assessed, developed and implemented options for a post - 2009 Aboriginal labour market strategy. | A policy framework for a new Aboriginal Employment and Training Program is 90 percent complete.
However, this work has been delayed due to preparations required to support the Government's development of an economic
stimulus package and associated reporting requirements. The Aboriginal Skills and Training Strategic Investment Fund was developed and was announced in Budget 2009 as a bridge to the successor strategy of Aboriginal Human Resources Development Agreements. The terms and conditions for the Aboriginal Human Resources Development Strategy were extended to March 31, 2010, to maintain current AHRDS funding so that a successor strategy can be developed, and they were ratified by the Budget 2009 announcement. In collaboration with internal partners, engagement and communications strategies were developed for both the budget stimulus (Aboriginal Skills and Training Strategic Investment Fund) and Aboriginal Human Resources Development Strategy successor programs. |
2.2.2 Program Activity - Workplace Skills
This program activity involves collaboration with industry partners and stakeholders through workplace partnerships to identify address and promote workplace skills development. Workplace Skills improves immigrant integration outcomes through programs such as Foreign Credential Recognition, the Going to Canada Immigration Portal and the Foreign Worker Program. Workplace Skills also develops and disseminates knowledge and information, which is vital to informing a well-functioning labour market through skills and labour market information, including National Occupational Classification and essential skills. Funding is administered through voted contributions. Workplace Skills operating expenditures are funded from the Departmental Reference Levels and the Employment Insurance Account.
Benefits to Canadians
By providing skills development opportunities to Canadians-and with the support of workplace skills development by employers and other stakeholders-we are ensuring the existence of a skilled labour force that responds to workplace challenges. The facilitation of sectoral and labour mobility enables Canadians and newcomers alike to access meaningful employment, contributing to increased labour market efficiency.
| 2008-2009 Financial Resources (millions of dollars) |
2008-2009 Human Resources (FTEs) |
||||
|---|---|---|---|---|---|
| Planned Spending |
Total Authorities |
Actual Spending |
Planned | Actual | Difference |
| 273.8 | 275.2 | 199.0 | 515 | 625 | (110) |
| Workplace Skills Program Performance Summary | ||||
|---|---|---|---|---|
| Expected Results |
Performance Indicators |
Targets | Performance Status and Historical Results |
Performance Summary |
| Skills and employment opportunities for workers in Canada | Percentage of Sector Councils that meet or exceed expected level of performance. | 90% | EXCEEDED 97% Historical results 2007: 95% 2006: n/a |
This result shows an increase over the target as a result of Departmental improvements to the application of a comprehensive and rigorous assessment process that provide sector councils with clear annual performance targets. |
| Increase in the number of trades people who are fully mobile in Canada through Red Seal endorsement. | 17,000 | EXCEEDED 23,187 Historical results 2007: 21,087 2006: 20,386 |
The target was exceeded given that apprenticeship registrations have been rising steadily over the past decades, leading to a greater number of certified trades people with Red Seal endorsement. There are now 50 Red Seal trades, up from 47 in 2006. The 50 Red Seal trades account for almost 88% of registered apprentices in Canada. | |
| Portion of skilled immigrants in occupations targeted by systemic foreign credential recognition interventions. | 55% | EXCEEDED 57% Historical results 2007: 53.7% 2006: n/a |
The performance indicator is based on Citizenship and Immigration Canada statistics on skilled immigrants and the occupations in which the majority of this group self-identify, collectively referred to as the Immigrant Labour Market (ILM). Upon achieving 53% coverage of the ILM in 2007-2008, the FCR program established a forecasted target of 55% for the 2008-2009 fiscal year. To date, the program has accomplished ILM coverage of 57% thereby exceeding its forecasted target due to additional investments in the following occupations: Financial Managers in the non-regulated sector, and trades occupations within the tourism sector | |
| Number of employees, employers and partnering organizations participating in innovative Workplace Skills Initiatives (WSI). | 80,000 | MOSTLY MET 77,675 |
The target was not met due to a suspension of funding for new projects for WSI. The current performance status reflects 29 funded projects involving 233 partners (associations, employers, unions, universities) and 77,675 participants (employers, employees). | |
Performance Analysis
The Workplace Skills program activity contributes in many ways to skills and employment opportunities for workers in Canada. This program activity implemented innovative and key workplace skills initiatives in collaboration with provinces, territories, the private sector and stakeholders to improve the quality and efficiency of the labour market by supporting workplace skills development that respond to workplace challenges. Throughout 2008-2009, HRSDC provided leadership on national economic issues and contributed to a more efficient labour market by facilitating labour mobility and thereby ensuring that Canadians and newcomers can access meaningful employment on a national basis. In collaboration with provinces and territories, the Department helped reduce or eliminate barriers to interprovincial mobility for workers in regulated professions and trades. The Department worked with provinces, territories and regulated professions to achieve compliance with Chapter 7 of the Agreement on Internal Trade. Under the amended Chapter, provincial/territorial governments and the Government of Canada agreed to full labour mobility and immediate mutual recognition of qualified workers.
To ensure a consistent labour market information function across Canada, HRSDC improved labour market information products and services and made them more widely available to Canadians. This information helps various groups�such as workers, employers and other stakeholders�to make informed choices, whether related to career counselling, to educational choices or to assisting newcomers both abroad and newly arrived in Canada in learning about where to live and work. Online support was enhanced through the relaunch of the National Occupation Classification and Career Handbook Web sites and the improvement of the Going to Canada Immigration Portal (www.workingincanada.gc.ca). Improvements to the Portal included content enhancements, full updates to the Guide to Working in Canada, development of a listing of Service Canada and Citizenship and Immigration Canada link centres, creation of a logging mechanism for organizations to use, and launching of third-party tool versions for the Foreign Credential Referral Office and Success BC. The Department also participated in the Forum of Labour Market Ministers Labour Market Information Advisory Panel engagement.
The Department also made progress in improving the quality of industry-driven approaches with regard to workplace skills. For example, advancements were made to support skilled trades and apprenticeships through renewed funding aimed at strengthening the Red Seal Program and thus promoting a national standard for training excellence in the skilled trades. To demonstrate continued federal support of the Red Seal Program in the context of the amended Agreement on Internal Trade, both the Apprenticeship Incentive Grant and the Apprenticeship Completion Grant are tied to the designated Red Seal trades. The number of trades people who are fully mobile in Canada through Red Seal endorsement was reported to have increased to 23,187 in 2008, compared to 21,087 people in 2007 and 20,386 in 2006.
Seventeen new tools and supports were developed and have become widely used among learners, employers and practitioners. In 2008-2009, there were approximately 400,000 (33,000 per month) warehouse orders and web site downloads for these products, six of which rank in the top ten most-ordered HRSDC publications. Feedback from users and stakeholders was positive, and an increasing number of stakeholders are sharing best practices on integrating or using literacy and essential skills tools. The Office of Literacy and Essential Skills provided core funding to 22 organizations to help them achieve administratively sound and accountable management.
The Department supported announcements made in Budget 2009 in response to dramatic changes in the economy and the labour market. Multiple initiatives were announced requiring significant stakeholder engagement, policy work and program development. New initiatives undertaken within the Workplace Skills program activity include the Apprenticeship Completion Grant and Foreign Credential Recognition.
The Government of Canada continues to help individuals become skilled trades people and ensure that Canada has the highly skilled and mobile workforce needed to fill available jobs in the skilled labour market. Under a $40-million-per-year investment in the Apprenticeship Completion Grant, worker mobility will be increased, as the Red Seal Program is recognized as a standard of excellence in training and certification and is highly valued by employers.
The January 2009 First Ministers' Meeting directed the Forum of Labour Market Ministers to take concerted action toward timely assessment and recognition of foreign qualifications. Through the Foreign Credential Recognition program, the Government of Canada is working with partners and key stakeholders to break down barriers to the recognition of foreign credentials and enhance labour market outcomes for skilled workers. Under the Budget 2009 announcement, this program also includes the Foreign Credential Recognition initiative combining HRSDC-level work and joint federal-provincial/territorial work to fulfill First Ministers' commitment to develop a common approach to foreign credential assessment and recognition.
A reporting strategy for all Budget 2009 initiatives was developed to obtain further details and information on progress to date. For additional information on these initiatives, please refer to http://www.fin.gc.ca/pub/report-rapport/2009-1/index-eng.asp.
Lessons Learned
Please refer to the "Lessons learned" section under the Labour Market program activity as these program activities were managed together in 2008-2009.
Plans and Achievements 2008-2009 - Workplace Skills
| PLANS | 2008�2009 ACHIEVEMENTS |
|---|---|
| Implement innovative and key workplace skills initiatives in collaboration with provinces, territories, private sector and stakeholders to improve the quality and the efficiency of the labour market. This was achieved through the following: | |
| Provide leadership on national economic union issues, contributing to a more efficient labour market. | Through Federal/Provincial/Territorial working groups, the Foreign Credential Recognition
(FCR) program engaged all provinces in discussions about
strengthening their foreign credential recognition capacity. The
FCR program has signed or is in the midst of negotiating contribution agreements with seven provinces
(Newfoundland and Labrador, Prince Edward Island, Nova Scotia, New Brunswick, Manitoba, Saskatchewan and British
Columbia). The Department implemented the 2007-2009 Forum of Labour Market Ministers work plan on the Agreement on Internal Trade according to set timelines and established a work plan for the 2009-2010 timeframe. The amended Labour Mobility chapter of the Agreement on Internal Trade was approved at the January 2009 First Ministers' Meeting. |
| Improved the labour market information (LMI) products and services that are available to Canadians. | The Department realigned functional guidance for local and regional
LMI into
HRSDC and also relaunched the National
Occupation Classification and Career Handbook Web sites (http://www5.hrsdc.gc.ca/NOC/English/NOC/2006/Welcome.aspx
and http://www5.hrsdc.gc.ca/NOC/english/CH/2001/Welcome.aspx). HRSDC completed research into the use of LMI by employers and intermediaries and initiated research into methods of measuring the impact of LMI. Enhanced the Going to Canada Immigration Portal (www.workingincanada.gc.ca). Improvements included content enhancements, full updates to the Guide to Working in Canada, development of a listing of Service Canada and Citizenship and Immigration Canada (CIC) link centres, creation of a logging mechanism for organizations, and launching of third-party tool versions for the Foreign Credentials Referral Office, the Government of Manitoba, CIC, and Success BC. |
| Improve the quality of industry-driven approaches with regard to workplace skills. | Developed the next phase of the Trades and Apprenticeship Strategy. Advanced and completed the work negotiated with the provinces and territories as part of the one-year extension of the Trades and Apprenticeship Strategy, which is designed to strengthen and harmonize apprenticeship systems in the Red Seal trades. Additional resources were secured in 2008-2009 to strengthen the Red Seal Program. Developed a common core curriculum to harmonize technical apprenticeship training in key Red Seal trades. The Red Seal Program is a convergence of federal and provincial interests in apprenticeship. The 50 Red Seal trades account for 89 percent of registered apprentices in the country. |
| Supported sectoral initiatives, for example through adjustments made in all industry sectors, including traditional industries, and developed new approaches to improve workplace partnerships | The sector council network broadened the scope of the Seafood Sector Council to cover food
processing, evaluated the governance systems of the Culture Sector Council, and expanded the scope of the Aviation
Maintenance Sector Council to include airports, pilots and some aerospace manufacturers. In the year ending March 31, 2008,1 Councils leveraged approximately $39 million from stakeholders, including $20.7 million in cash and $18.3 million in in-kind contributions, towards projects and activities. During this same time period, the Sector Council Program invested $73.2 million. Some 11,941 employees met the occupational standards developed by nine sector councils. There were 56,319 employees enrolled in sector-specific occupational standards courses or programs developed or modified by councils in cooperation with academic institutes. Over 6,200 employers established or upgraded training programs as a result of sector council efforts. Nearly 12,000 people attended over 300 workplace skills development events convened by sector councils. There were 92,174 employees enrolled in 568 online courses currently offered by nine councils. |
| Facilitated the entry of temporary foreign workers while continuing to ensure that Canadians have first access to job opportunities, and developed employer monitoring and compliance measures. | Developed and implemented a "minimum advertising requirement" policy to ensure that employers
have made reasonable efforts to hire or train Canadians and permanent residents giving them first access to jobs
prior to engaging Temporary Foreign workers for outside Canada. Successfully launched monitoring and compliance pilot projects in British Columbia and Alberta (Expedited Labour Market Opinion) and a voluntary national program. Finalized the majority of work with CIC and the Canada Border Services Agency on amendments to the Immigration and Refugee Protection Regulations to enhance Temporary Foreign Worker Program integrity. Training and guidance were also provided to case managers and investigators. In partnership with CIC, improvements were made to the management and delivery of the Temporary Foreign Worker Program through the negotiation and implementation of Temporary Foreign Worker Annexes to federal-provincial/territorial immigration agreements for Ontario and Alberta. Letters of understanding on information sharing were signed with the governments of Alberta and Manitoba. Temporary Foreign Worker Program federal-provincial working groups were established in Newfoundland and Labrador, Quebec, Ontario, Manitoba and Saskatchewan. Developed and implemented a policy to ensure that employers engage temporary foreign workers only when appropriate. Created stakeholder advisory groups with labour and employers to develop a new prevailing wage methodology. |
| Developed tools and other support mechanisms to raise Canadians' literacy and develop their essential skills. | The Offices of Literacy and Essential Skills (OLES) reached its objectives in terms of streamlining assessment,
approval and monitoring processes for proposals. It is piloting the Risk Assessment, Management and Mitigation approach,
which greatly increases the efficiency of the assessment process by implementing early management-level assessment
of proposals. OLES provided core funding to 22 organizations to help them achieve administratively sound and accountable management and to thereby facilitate their ongoing activities in support of their mandate and of the needs of the literacy and essential skills field. Performance-based agreements were established to provide support to these organizations and to organizations receiving project-based funding in order to help them improve their capacity and measure results. OLES's partnership development activities help to build and share knowledge and expertise and to further the development of tools, supports and best practices. |
| 1 The Sector Council Program conducts the Annual Survey of Performance Indicators (ASPI). Data collection, analysis and reporting for the fiscal year ending in March 2009 will be complete in the fall of 2009. Consequently, at the time the Departmental Performance Report was prepared, the Sector Council Program could only report performance data from the 2007-2008 ASPI report. | |
2.2.3 Program Activity - Learning
Program Activity Description
This program activity assists Canadians in acquiring the education and skills that will enable them to participate in a knowledge-based economy and society. In doing so, the program works in close partnership with the provinces and territories, the voluntary sector, financial institutions, service providers and other key stakeholders to increase awareness of, preparedness for and access to lifelong learning opportunities by reducing financial and non-financial barriers for today's and tomorrow's learners. Programs within this area are delivered nationally and include statutory and voted programs. The Canada Student Loans Program (CSLP) promotes accessibility to post-secondary education through the provision of loans and grants to students with demonstrated financial need. The CSLP also offers debt management measures to help borrowers with repayment. The Canada Education Savings Program provides and encourages Canadians to save for children's post-secondary education through Registered Education Savings Plans. The International Academic Mobility initiative administers contributions programming in the area of international student mobility. Operating expenditures for this program activity are funded from the Departmental Reference Levels and the Employment Insurance Account.
Benefits to Canadians
Learning is vital to the well-being of individual Canadians, as well as to the productivity and competitiveness of employers and to Canada's prosperity. Learning programs provide Canadians with a more equitable opportunity to participate in post-secondary education by reducing financial barriers through loans and grants and by encouraging Canadians to save for post-secondary education through grants and tax provisions.
Investments through learning programs yield substantial benefits for employers and the economy by increasing the number, education level and skills of potential employees; creating more and higher-paid employment for Canadians; considerably increasing the amount of tax base for governments; and significantly reducing government transfers such as social assistance. Research findings have clearly demonstrated that people with post-secondary education are likely to be more productive, earn higher income, experience less unemployment and stay in the labour market longer. Higher education and training also results in a more educated population, which is strongly linked to safer communities, a healthy population, a sustainable environment, higher levels of volunteerism and charitable giving, a greater appreciation of diversity, and stronger social cohesion.
| 2008-2009 Financial Resources (millions of dollars) |
2008-2009 Human Resources (FTEs) |
||||
|---|---|---|---|---|---|
| Planned Spending |
Total Authorities |
Actual Spending |
Planned | Actual | Difference |
| 2,096.6 | 2,136.2 | 2,134.4 | 396 | 574 | (178) |
| Learning Program Performance Summary | ||||
|---|---|---|---|---|
| Expected Results |
Performance Indicators |
Targets | Performance Status and Historical Results |
Performance Summary |
| Reduced financial barriers to participation in post-secondary education through loans and grants. | Client satisfaction with the overall quality of services provided by the Canada Student Loans Program. | 75% | MET ALL 74% (margin of error +/- 3.1%) Historical results: 2004-2005: 70% |
The Client satisfaction rate remained stable. |
| Percentage of loans consolidated in the 2005-2006 loan year that defaulted by the end of the 2007-2008 loan year (direct loans only). | 18% | EXCEEDED 16.6% Historical results :2004-2005: 37.7% for the 2001-2002 cohort |
The reduction of default rates has been achieved primarily through improved efforts in communicating with borrowers. | |
| Canadians with children under 18 have Registered Education Savings Plan savings. | Percentage of children under 18 years in the current calendar year who have ever received a Canada Education Savings incentive (for example, Canada Learning Bond and/or Canada Education Savings Grant). | 37% | EXCEEDED 39.3% Historical results :2004: 29% |
The 2008-2009 target was exceeded due to changes announced in Budget 2007 and Budget 2008 that made RESPs more flexible and attractive to Canadians. Communications and outreach strategy enhancements contributed to increasing the uptake rate among middle- and low-income families. |
| Amount ($) of Registered Education Savings Plan assets in a fiscal year. | $29 billion | SOMEWHAT MET $23 billion Historical results March 2004: $23.4 billion |
RESP assets were less than targeted due to the severe decline in the financial markets, but fared much better than the market overall. Canadians continued to save in 2008 by contributing $3 billion to their RESPs. | |
| Canadians with children under 18 years of age are aware of RESP savings incentives. | Percentage of families with children aware of Registered Education Savings Plans. | No target was set | 54% of RESPondents to a 2007 survey were aware of Registered Education Savings Plans. | Ongoing communications and outreach activities are helping to promote awareness of RESPs. |
| Increase access to international education to enable Canadian students to gain knowledge and skills that contribute to a competitive edge in an increasingly global environment. | Number of PSE students who participated in IAM. | No target was set | 300 students Historical results 2004-2005: 300 students |
Participation in the program remains stable. |
| Level of satisfaction of Students with International Academic Mobility experience (IAM). | 85% | EXCEEDED 2007-2008: 94% Historical results 2004-2005: 97% |
2007-2008 results are shown due to survey information reporting lags. | |
Performance Analysis
Canadian students continued to rely on HRSDC programs to help them save for and finance their post-secondary education. Thanks in part to the support provided by HRSDC programs, among Organisation for Economic Co-operation and Development countries, Canada had the highest percentage of population with post-secondary education credentials. The trend towards a skilled workforce has been increasing over time. In 2008, 38.1 percent of Canadians age 17 to 21 were participating in post-secondary education, up from 37.6 percent in 2004 and 30.4 percent in 1990. Furthermore, the percentage of the Canadian labour force (age 25-64) who have post-secondary education credentials also increased continually, reaching 64.3 percent in 2008 (up from 60.4 percent in 2004 and 44.2 percent in 1990).1
During 2008-2009, 473,000 borrowers (36 percent of all full-time students in participating provinces and territories) benefited from the CSLP, compared to 455,000 students (40.7 percent of all full-time students in participating provinces and territories) in 2004-2005. In 2008-2009, the Department invested $2.0 billion in loans and $143.2 million in 86,000 Canada Study Grants and Canada Access Grants, compared to investments of $1.9 billion in loans and $127.9 million in 75,300 grants in the year 2005-2006. The CSLP also began a series of evaluation projects to measure its impact on access to post-secondary education; results will be available in 2010-2011.
Investments in RESPs also provided a significant source of financing for post-secondary education. During 2008-2009, 228,800 students (14.53 percent of all full-time students) withdrew $1.5 billion from their RESPs to attend post-secondary education, compared to 131,300 students and $632.3 million in 2004-2005. Overall, as of December 2008, 39.3 percent of children under 18 years of age had RESP savings to help them finance their future participation in post-secondary education (compared to 29 percent as of December 2004).2 This increase reflects the results of the Department's communications and outreach strategy, as well as policy enhancements made to the Canada Education Savings Program.
During the same period, Canadians contributed $3.1 billion to RESPs, compared to $2.27 billion in 2004-2005. The percentage of eligible children who have ever received a Canada Learning Bond, which was first offered in 2005, was 16.3% by December 2008. Since the inception of the Canada Education Savings Program in 1998, $4.72 billion has been paid in grants and bonds, which has resulted in leveraged RESP assets of $23 billion available as of March 31, 2009, for the future post-secondary education of Canadian children.
The Department invested $3.36 million in the International Academic Mobility initiative to help 300 Canadian students finance their participation in international learning and skills acquisition activities, as well as to support 75 projects involving over 200 Canadian partners and a similar number of international partners.
In 2008, the Canada Millennium Scholarship Foundation (CMSF) provided $341.2 million in bursaries and scholarships, for a total investment of $370.5 million (including operating costs). The CMSF awarded bursaries averaging $3,000 to post-secondary students based on financial need; 28,688 access bursaries with a total value of $50.4 million to students from low-income families; and 3,198 millennium excellence awards, valued at $4,000 or $5,000, depending on the type of award. The CMSF was established in 1998 by way of the Budget Implementation Act, 1998 with a $2.5 billion endowment and the mandate to disburse awards over a ten-year period. Its mandate is set to expire in 2009. Budget 2008 stipulates that the CMSF will be dissolved after it completes a liquidation process that is scheduled to end in July 2010.
The Department is continuing to work on the terms and conditions for the liquidation of the CMSF's property and liabilities and is working with the CMSF to establish transition grants for CMSF bursary recipients delivery mechanism for CMSF excellence awards.
Lessons Learned
Streamlining Administration - Canada Student Loans
Since 2000, Canada Student Loans were administered by two separate private sector service providers. As the expiry dates of the original contracts approached, HRSDC sought an improved arrangement. It was recognized that moving from two service providers to one would simplify program administration. In addition, this simplification improves performance management significantly, as it is performance-based. Under the new contract, the service provider can gain or lose a significant amount of funding based on its performance in areas such as reducing default and improving client satisfaction.
Plans and Achievements 2008-2009 - Learning
| PLANS | 2008�2009 ACHIEVEMENTS |
|---|---|
| Modernize financial assistance to students as announced in the Advantage Canada Plan. | Substantially implemented all recommendations provided by the May 2007 Report of the Office
of the Auditor General this includes documenting all eligibility and needs assessment processes by jurisdiction
, through the development of a revised performance measurement framework, and a new Canada Student Grant Program
that will provide a strengthened control structure for the administration of federal grants. Completed the transition to a single Canada Student Loans Program service provider to streamline and modernize student financial assistance which will better enable the program to reduce loan defaults and improve services to borrowers. Strengthened program integrity, governance, accountability and stewardship by implementing recommendations from the Canada Education Savings Program operational review and from evaluations completed through a detailed review of RESP industry practices. Renewed RESP agreements with providers and successfully concluded the transition to a single service provider for borrowers, which will improve HRSDC's ability to reduce loan defaults and improve services. |
| Develop policy options and instrument choices related to financial and non-financial barriers to learning. | Continued program policy and diagnostic work with the provinces, territories, other federal
government departments and non-governmental organizations to finalize policy design and delivery details for the
new Canada Student Grants Program, the Repayment Assistance Plan and additional program changes to student financial
assistance announced in Budget 2008. Renewed and expanded the International Academic Mobility initiative as part of the renewal of the terms and conditions of the Youth Employment Strategy, effective April 1, 2009. Developed and implemented measures to encourage Canadians to increase savings for their children's post-secondary education. A communication and outreach strategy targeted at low- and middle-income families was used to increase awareness of post-secondary education savings incentives and encourage families to save for their children's post-secondary education. |
2.3 Strategic Outcome 3: Safe, healthy, fair, stable, cooperative, productive workplaces and effective international labour standards
Description of Strategic Outcome: This strategic outcome seeks to promote and sustain stable industrial relations and safe, fair, healthy, equitable and productive workplaces within the federal jurisdiction. It includes the development of labour legislation and regulations to achieve an effective balance between workers' and employers' rights and responsibilities. It ensures that workplaces under federal jurisdiction respect the rights and obligations established under labour legislation. Canada's international and intergovernmental labour affairs, as well as Aboriginal labour affairs, are also managed under this strategic outcome.
2.3.1 Program Activity - Labour
Program Activity Description
This program activity promotes and sustains stable industrial relations and safe, fair and productive workplaces within the federal labour jurisdiction. It collects, disseminates and analyzes labour and workplace information; fosters constructive labour-management relationships; ensures compliance with minimum labour standards and occupational health and safety protections; and represents Canada in international labour matters. Employees rely on Labour Program officials to protect their health and safety at work by promoting a culture of health and safety, including through the use of workplace health and safety committees, and by enforcing the right to refuse dangerous work and other rights related to occupational health and safety. Aboriginal people, visible minorities, women and people with disabilities look to the Labour Program to promote equality of employment opportunities. Operating expenditures for this program activity are funded from the Departmental Reference Levels and a small portion from the Employment Insurance Account related to Workers Compensation.3
Benefits to Canadians
This strategic outcome supports Canada's economic recovery and prosperity by reducing the frequency and duration of work stoppages in critical national sectors such as ports, railroads, airports and telephone companies; by creating conditions for productive, modern workplaces where employees are highly motivated and constructively engaged with management in problem solving and innovation; and by helping businesses reduce costs and keep workers healthy by minimising workplace injuries and occupational disease. It also helps employers take full advantage of Canada's increasingly diverse human capital through outreach and integration efforts; collects, analyzes and disseminates workplace trends information that is used by policy makers, researchers and parties to collective bargaining; and prevents the undercutting of Canadian companies by foreign competitors who seek to gain an unfair advantage by ignoring basic labour standards.
Furthermore, the Labour Program contributes to the health, safety and economic security of individual Canadians by ensuring that work sites are safe; by providing remedies and compensation for workers who have been unfairly fired, not paid or injured on the job; by ensuring that reservists who serve their country can return to their jobs after their tour of duty; and by applying rules and encouraging practices that help Canadians balance work responsibilities with family duties and civic involvement.
Finally, the Labour Program helps strengthen Canada's place in the world by playing a leadership role in multilateral bodies dealing with employment and labour matters by negotiating strong Labour Cooperation Agreements in parallel to free trade accords, thereby advancing Canadian economic interests and fundamental values abroad, and by building relationships around labour issues with emerging powers such as Brazil and China.
| 2008-2009 Financial Resources (millions of dollars) |
2008-2009 Human Resources (FTEs) |
||||
|---|---|---|---|---|---|
| Planned Spending |
Total Authorities |
Actual Spending |
Planned | Actual | Difference |
| 271.4 | 262.7 | 261.2 | 936 | 935 | 1 |
| Labour Program Performance Summary | ||||
|---|---|---|---|---|
| Expected Results |
Performance Indicators |
Targets | Performance Status and Historical Results |
Performance Summary |
| Safe, healthy, stable, cooperative and productive workplaces. | Percentage of collective bargaining disputes settled under Part I (Industrial Relations) of the Canada Labour Code without work stoppage. | 90% | EXCEEDED 96.3% Historical results 2007: 92.1% 2006: 96.9% 2005: 96.9% 2004: 88.8% |
For the year 2008, 96.3% of collective bargaining disputes were settled without a work
stoppage. [Data Source: Mediation and Arbitration Records System, Labour Program]. |
| Percentage of unjust dismissal complaints settled by inspectors (Part III of the Canada Labour Code). | 75% | MOSTLY MET 73% Historical results 2007-2008: 76% 2006-2007: 74% 2005-2006: 74% 2004-2005: 71% |
73% of unjust dismissal complaints were resolved. Labour Program inspectors assisted 1,229
employers in resolving complaints from former employees alleging that their dismissal was unjust. [Data Source: LA2000, Labour Program]. |
|
| Client satisfaction with the quality of Workplace Information Division data. | 90% | UNRATED Historical results 2006-2007: 96.4% 2007-2008: As no survey was carried out in 2007-2008., the 2006-2007 results of 96.4% was shown in the 2007-2008 DPR. |
A client satisfaction e-questionnaire was featured in one issue of the Workplace Bulletin, included in the table of contents of two others, and distributed through client services to 344 clients. Regrettably, due to technological complications, the response rate was too low to deem it a success. However, for the 63 responses received, 65% of clients were very satisfied or satisfied with the overall quality of the Workplace Bulletin and 59% were very satisfied or satisfied with the overall quality of information provided. | |
| Percentage of money collected in relation to the amount found to be owed for complaints under Part III (Labour Standards) of the Canada Labour Code (excluding unjust dismissal complaints). | 75% | EXCEEDED 79.44% Historical results 2007-2008: 57.93%1 2006-2007: 74% |
Labour Program inspectors determined that employers owed $3,995,211 to employees in unpaid
wages and other entitlements. Of this amount, $3,141,921 was recovered. [Data Source: LA2000, Labour Program]. |
|
| Reduction in lost-time injuries and fatalities in the federal labour jurisdiction. | Disabling Injury Incidence Rate (DIIR) measuring the change in the rate of time-loss injuries, illnesses and fatalities within federal jurisdiction industries from year to year. | Reduce the DIIR by 10% over five years (by 2008-2009) in targeted high-risk areas. | UNRATED Until completion of the five year evaluation and reporting period. |
The five year evaluation and reporting period for the
DIIR target is not yet complete. The national, or overall, DIIR figure for all federally regulated industries decreased by 0.2% in 2007. For the four priority industries (Communications, Road Transport, Air Transport, and Broadcasting), the DIIR went from 3.05% in 2005 to 3.33% in 2007, which is an increase of 9.2%. [Data Source: Federal Jurisdiction Work Injuries Database, Labour Program]. |
| Federal and provincial -territorial governments work together on key labour issues, including occupational health and safety, labour standards, employment equity, industrial relations and international labour affairs activities. | The planned activities and outputs for 2008 2009 included:
|
None | MET ALL | The Canadian Association of Administrators of Labour Legislation met as planned. The Federal/Provincial/Territorial Ministers Responsible for Labour signed a joint statement on preventing workplace violence in their jurisdictions, including a commitment to raising awareness and developing anti violence strategies. |
| Fulfillment of Canada's international labour commitments | The 2008 2009 planned activities included:
|
None | MET ALL | Three labour cooperation agreements were finalized. |
| Managing existing cooperation relationships, including any formal cooperative activities. | None | MET ALL | Activities were carried out under the Canada-China Framework for Cooperation in the fields of industrial relations and labour standards, and under the Canada-Brazil and Canada-Argentina Memorandum of Understanding on Labour Cooperation on Labour Inspection. Seminars on Youth Employment and Freedom of Association were also held under the North American Agreement on Labour Cooperation. | |
| Representing Canada at the International Labour Organization and the Inter American Conference of Ministers of Labour, as well as at any scheduled conferences of the Organization of American States | None | MET ALL | Canada promoted Canadian interests and priorities and played a leadership role in the International Labour Organization (ILO) as permanent Chair of the Industrialized Market Economy Countries (IMEC) group, as a member of the ILO Governing Body, and by contributing expertise on important labour issues, in particular, the development of international labour standards. Canada was instrumental in working like-minded countries to promote increased efficiencies, strengthen governance and standards reform. Canada also continued to exercise a leadership role within the Inter-American Conference of Ministers of Labour (IACML), by continuing to be the principle donor to the RIAL fund, a technical assistance fund within the IACML, the principle forum for dialogue on labour within the framework of the Organization of American States (OAS), and by co-chairing Working Group 2, which is tasked with examining mechanisms to strengthen the capacities of Ministries of Labour. The Labour Program also contributed to the OAS General Assembly process by providing input on labour-related resolutions. | |
| Providing funding for capacity building and social dialogue projects to a total of $2.2 million. | None | MOSTLY MET | 94% of the transfer payment funding was spent on eligible projects/recipients. Over the
last three years, the Labour Program has spent the entire amount of its two grant envelopes. However, the domestic
contribution stream for social dialogue projects in Canada has had a lower take up than anticipated. The grant for the two-year Strengthening the Inter-American Network for Labor Administration (RIAL) project funded five hemispheric workshops in the following areas : Occupational health and safety (Peru, October 2008); Public employment services (Panama, December 2008); Labour migration and labour market information systems (Canada, February 2009); Labour inspection (United States, May 2009); and Gender mainstreaming (Argentina, July 2009). These workshops allowed representatives of Ministries of Labour in the Americas, the Trade Unions Technical Advisory Council (COSATE), the Business Technical Advisory Committee on Labour Matters (CEATAL), and other key actors to exchange best practices and lessons learned on important labour issues. Information related to these workshops and other project activities is available online at http://www.sedi.oas.org/ddse/english/cpo_trab.asp. The funding also facilitated the expansion of the RIAL Portfolio of Programs, a virtual information bank on programs, policies, and projects undertaken by Ministries of Labour in the Americas, and the undertaking and publication of four studies on current labour issues in the region including one on the institutionalisation of gender in Ministries of Labour. Contributions under the consultation and partnership-building and Canadian-based cooperative activities stream funded the organisation of virtual round tables, the holding of an international an international conference titled "Humanizing Trade IT, and research initiative on labour standards in the contact of globalisation. These projects aimed to promote dialogue between academics, governments, employer and employee organisations, and non-governmental organisations, and advance research and knowledge on the linkages between trade and labour. |
|
| 1 Two large bankruptcies in Ontario skewed results; if these were
excluded, the result would be 84.79%. 2 There were no performance indicators and targets related to this expected results. In this case, Treasury Board of Canada Secretariat indicates in its Guide to the Preparation of Part III of the Estimates. Reports Tabled in Parliament in 2009. 2009-2010 Report on Plans and Priorities. 2008-2009 Departmental Performance Reports under Performance Status of DPR that "If indicators and performance status targets were not communicated in the RPP, then the performance status should be assigned based on the percentage of the planned activities and outputs that were achieved during the fiscal year", page 26 |
||||
Performance Analysis
One of the strategic goals of the Labour Program is to promote harmonious union management relations and to minimise the number of work stoppages, which disrupt the Canadian economy. To measure the effectiveness of its services in this regard, the Labour Program tracks the percentage of collective bargaining disputes settled without a work stoppage; the goal is for this proportion to reach 90 percent. This target has consistently been achieved or exceeded over the past ten years, with the exception of 2004-2005, when the settlement rate was 89 percent. In 2008, 96.3 percent of all disputes were settled without a work stoppage.
A second strategic objective is to ensure that workplaces are healthy and safe. A major accomplishment in this area was the development and implementation of two new regulatory requirements under the Hazard Prevention Program Regulations related to ergonomic hazards and violence prevention in the workplace, both of which were based on extensive consultation with employer and employee representatives.
A third strategic objective is the elimination of discrimination at work, and, in particular, the promotion of equal representation of the four designated groups (women, Aboriginal peoples, people with disabilities and visible minorities) in federal jurisdiction workplaces. Significant progress has been made in the private sector with respect to the representation of members of visible minority groups. The effectiveness of programs aimed at promoting employment equity for the designated groups is admittedly difficult to measure; nonetheless, such progress would not likely have been made in the absence of legislative requirements, mandatory and public reporting of results, and a facilitation program, namely the Racism Free Workplace Strategy, which provided proactive assistance to employees and employers seeking to resolve issues related to race.
A fourth strategic objective is to ensure that federal public sector workers are properly compensated in case of injury. In this respect, practical steps were taken in partnership with the provincial workers' compensation boards to improve the administration of the Government Employees Compensation Act (GECA) and enhance information sharing and consultation processes under the existing administrative agreements with the provincial workers' compensation boards in order to be better informed on emerging issues and improve compliance of GECA employers.
A fifth strategic objective is to support key governmental priorities such as the promotion of Canadian values abroad, leadership in international forums in the Americas and with the provinces and territories, and challenges faced by Aboriginal and northern Canadians. Key achievements in 2008-2009 include the successful conclusion of a Labour Cooperation Agreement with Jordan, the signing of agreements with Peru and Colombia, and successful activities on labour issues carried out under the Canada-China Framework for Cooperation in the fields of industrial relations and labour standards.
In terms of the development of new initiatives, the Labour Program launched consultations in support of the modernization of Part III (Labour Standards) of the Canada Labour Code. A consultation paper, which provided a neutral analysis of the recommendations contained in the final report of the Federal Labour Standards Review Commission, Fairness at Work: Federal Labour Standards for the 21st Century, and questions to stimulate discussion were prepared and released when the consultation process was launched.
Significant adjustments were made to current workplace policies and legislation to ensure that the Government could respond to challenges arising in the Canadian economy and in Canadian society. Regulatory development of the Wage Earner Protection Program (WEPP) helped bring the Wage Earner Protection Program Act into force in July 2008. Legislative amendments were successfully implemented as a result of Budget 2009, which extended the WEPP to cover severance and termination pay in addition to existing coverage of wages and vacation pay, thereby providing greater protection to Canadian workers whose employers have been declared bankrupt or are subject to receivership.
Finally, under the Minister of Labour's lead, the Government developed a comprehensive reservist reinstatement strategy. The key piece of legislation underpinning the strategy was passed on April 16, 2008. Amendments to the Canada Labour Code and the Public Service Employment Act provide job protection for federal public servants and employees of federally regulated enterprises when they take part, as reservists, in designated military operations and annual training. The Labour Program drafted regulatory amendments to the Canada Labour Standards Regulations.
Lessons Learned
A focused study launched by the Minister of Labour in 2008-2009 was carried out by an independent expert who looked at the causes and impacts of work stoppages in the federal private sector with a view to developing options acceptable to both labour and management in addressing issues related to work stoppages. The expert's report, titled Work Stoppages in the Federal Private Sector: Innovative Solutions, concluded that "the optimal policy initiative that can be undertaken at this time to reduce the risk, frequency, and duration of work stoppages is investment in measures that will provide wholesale improvement in the labour management relationship across the federal private sector." Lessons learned are that, in addition to the continued provision of mediation and conciliation services under the Canada Labour Code, it is necessary to raise client awareness of the availability of the Preventive Mediation Program and the Labour Management Partnerships Program. A new training session on post-work stoppages will be developed to help parties rebuild trust and cooperative labour relations.
Plans and Achievements 2008-2009 - Labour
| PLANS | 2008�2009 ACHIEVEMENTS |
|---|---|
| Fully implement recently-approved programs and policies aimed at fostering fair and productive workplaces. | On April 16, 2008, new legislation to provide job protection for federally regulated reservists
came into force. The Wage Earner Protection Program was successfully implemented after its inception in July 2008. Legislative amendments announced in Budget 2009 to expand the Wage Earner Protection Program Act to cover termination and severance pay were successfully implemented. Proactive identification and assessment of ergonomics related hazards and the emerging issue of workplace violence prevention were addressed by the implementation of new regulatory requirements. The new Pay Equity Program was implemented with trained mediators available to provide assistance. |
| Advance Canadian interests and values in the negotiation and implementation of international labour standards and agreements. | The Canada-Colombia and Canada-Peru labour cooperation agreements were concluded and signed. The Canada-Jordan Agreement on Labour Cooperation was concluded. Activities under the Canada-China Framework for Cooperation in the field of industrial relations and labour standards were successfully concluded. By focusing on strengthening the International Labour Organization's governance, capacity and ability to provide practical assistance to its members in the context of globalisation, the Labour Program influenced the outcome of the International Labour Organization Declaration on Social Justice for a Fair Globalization. Two additional provinces agreed to accept obligations under Canada's labour cooperation agreements. |
| Develop innovative policy and program options that respond to the evolving realities of Canadian workplaces. | A study was undertaken to examine the causes and impacts of work stoppages in the federal
private sector with a view to developing options to reduce their frequency and duration. Steps pursuant to the study's
consensus recommendations are being developed and implemented Consultations in support of the modernization of Part III (Labour Standards) of the Canada Labour Code were launched on February 13, 2009 with the release of a consultation paper. An agreement was reached with several provincial workers' compensation boards to better inform each other's organisations of emerging issues, including appeals and changes to policies, fees, procedures, regulations or legislation that may have an impact on the administration of the Government Employees Compensation Act. |
2.4 Strategic Outcome 4: Enhanced income security, access to opportunities, and well-being for individuals, families and communities
Description of Strategic Outcome: HRSDC ensures that Canadians are provided with retirement pensions, survivor pensions, disability benefits and benefits for children through the Old Age Security program, the Canada Pension Plan, the Canada Disability Savings Program and the National Child Benefit program.
Furthermore, HRSDC seeks to increase participation of Canadians by improving individual, family and community well-being. HRSDC invests in the capacity of organizations that reduce barriers and promote access to opportunities for vulnerable populations including homeless individuals and families, and those at risk of becoming homeless, seniors, people with disabilities, children, families, and communities. Through investments, families, and organizations which offer services and programs, are provided with knowledge, information and opportunities to move forward with their own solutions to social and economic challenges
This strategic outcome consists of three program activities:
- Social Investment;
- Children and Families; and
- Housing and Homelessness.
2.4.1 Program Activity - Social Investment
Program Activity Description
This program activity provides Canadians with pensions and benefits for retirement, death and disability through the Old Age Security Act and the Canada Pension Plan. It also includes social investment programs, policies, and grants and contributions designed to provide children, families, seniors, communities and people with disabilities access to the knowledge, information and opportunities to move forward with their own solutions to social and economic challenges. Operating expenditures for this program activity are funded from the Departmental Reference Levels and the Canada Pension Plan Account.
Benefits to Canadians
Canada's economic prosperity, its vibrant labour market and its positive long-term outlook are closely linked to the income security and well-being of Canadians, their families and communities. The Department administers Canada's national pension programs, which are important sources of secure income for seniors, surviving spouses and people with disabilities. The Department is also responsible for the Canada Disability Savings Grant and Canada Disability Savings Bond that help parents and others save for the long-term financial security of a person with a severe disability.
The Department administers programs that provide individuals and families with access to opportunities to improve their well-being and participation in communities. For example, the New Horizons for Seniors Program and the Social Development Partnerships Program strengthen and build capacity to increase access to services, information and resources. Similarly, the Enabling Accessibility Fund provides funding to increase accessibility in communities and help all Canadians participate fully in their communities.
| 2008-2009 Financial Resources (millions of dollars) |
2008-2009 Human Resources (FTEs) |
||||
|---|---|---|---|---|---|
| Planned Spending |
Total Authorities |
Actual Spending |
Planned | Actual | Difference |
| 63,028.0 | 62,593.8 | 62,565.7 | 1,219 | 975 | 244 |
| Social Investment Program Performance Summary | ||||
|---|---|---|---|---|
| Expected Results |
Performance Indicators |
Targets | Performance Status and Historical Results |
Performance Summary |
| Enhanced income security and social inclusion, increased opportunities and participation of Canadians (in particular for seniors, people with disabilities and communities) through departmental initiatives and through working with partners | Percentage of CPP contributors who have contributory coverage /eligibility for CPP-Disability. | 70% (males) 63% (females) |
N/A1 Historical results 2007-2008: 70% of males and 63% of females 2006-2007: 70% of males and 64% of females |
An amendment to the Canada Pension Plan implemented in 2007-2008 extended Canada Pension Plan disability benefit eligibility to contributors with a long history of labour force attachment. This measure continues to increase the percentage of contributors who are eligible for the Canada Pension Plan disability benefit. |
| Number of new community-based social development projects or initiatives that have been supported to promote the participation of children and families, people with disabilities or other vulnerable populations. | 30 projects | EXCEEDED 51 projects Historical results 2007-2008: 59 projects 2006-2007: 61 projects |
The Social Development Partnerships Program provided funding to national and community-based not-for-profit organizations working to meet the social development needs of people with disabilities, children and their families, and other vulnerable or excluded populations in Canada. | |
| Number of seniors involved in New Horizons for Seniors community projects. | 90,000 participants | EXCEEDED 131,350 estimated participants (based on an estimated average of participants per project) Historical results 2007-2008: 91,700 2006-2007: 106,745 |
Increased participation rates for seniors reflect the expansion of the New Horizons for Seniors Program in 2007-2008. | |
| 1 Figures will be available in September 2009. | ||||
Performance Analysis
The Department continued to contribute to stable income for millions of Canadians through the administration of Canada's national pension programs. In 2008-2009, Canada Pension Plan and Old Age Security benefits paid to individuals and families totalled $62.4 billion (up from $59.5 billion in 2007-2008 and $56.4 billion in 2006-2007).
In 2008-2009, over 3.6 million individuals received the Canada Pension Plan retirement benefit, for a total of $21.1 billion in retirement benefit payments. This represented an increase from 2007-2008, when 3.4 million individuals received the benefit, for a total of $19.8.billion in benefit payments. Furthermore, approximately 4.5 million individuals received the basic Old Age Security pension in 2008-2009, for a total of $25.3 billion in benefit payments (4.4 million individuals and $24 billion in 2007-2008). To address the vulnerability of low-income seniors, approximately 1.6 million individuals received the Guaranteed Income Supplement ($7.5 billion in benefit payments) to contribute to stable retirement income.
Income security also continued to be a challenge for people with disabilities. Recognizing this, the Government of Canada supports people with disabilities through the ongoing delivery of the Canada Pension Plan Disability program, which paid monthly benefits to over 311,000 eligible contributors in 2008-2009 ($3.3 billion in benefit payments). This represents an increase from 2007-2008, when 307,000 individuals were paid benefits totalling $3.3 billion. This program remains Canada's largest long-term disability insurance plan and is an important source of income replacement for eligible Canada Pension Plan contributors who cannot work due to severe, prolonged disabilities.
The Department also designed and implemented the new Canada Disability Savings Grant and Canada Disability Savings Bond to help eligible people with severe and prolonged disabilities, their families and others save for long-term financial security.
In addition issues related to financial security, seniors face issues associated with their well-being and inclusion in Canadian society. As the federal government's focal point for seniors' issues, HRSDC continued to work with other departments and the provinces and territories. In 2008-2009, the Department invested in over 1,700 projects through the New Horizons for Seniors Program. Funded projects served to help improve the quality of life for seniors and their communities�from enabling seniors to share their knowledge, wisdom and experiences, to improving community facilities and raising awareness of elder abuse. At the community level, the Department supported the efforts of the community not-for-profit sector to innovate, strengthen networks, promote self-sufficiency and share good practices to contribute to community well-being. The Department funded 14 projects that involved over 84 organizations and aimed to share innovative best practices in not-for-profit sector service delivery, collaboration, governance, human resources and financing.
HRSDC supported the Government of Canada in matters affecting people with disabilities. In 2008-2009, the Department made investments through the Enabling Accessibility Fund to support community-based projects across Canada that improve accessibility, reduce barriers and enable Canadians, regardless of physical ability, to participate in and contribute to their community and the economy. Additionally, the Office for Disability Issues continued work to help the Department become a model of accessibility in the federal government. On April 14, 2008, the Office for Disability Issues moved into a single highly accessible location that is a model of accessibility for the federal government.
Lessons Learned
The Department has derived several lessons learned in delivering social programs within the Social Investment program activity that will strengthen the Department's ability to address current and emerging cross-cutting social policy priorities of the Government.
Dissemination of Knowledge - Social Development Partnerships Program
Through the delivery of the Social Development Partnerships Program (SDPP), while funded projects contribute to increased knowledge of existing and emerging social issues and make contributions to strengthen programs and services "at the ground level", it was recognized that the knowledge and results produced need to be disseminated more widely to contribute to the future directions of social programs and to further increase the ability of organizations and communities to respond to these issues. As a result, the Department, in consultation with stakeholders and funded partners is exploring options to strengthen mechanisms to improve knowledge dissemination and transfer. For example, the Department strengthened criteria related to knowledge transfer in the SDPP application process
Program Administration - New Horizons for Seniors Program
Similarly, while the New Horizons for Seniors Program (NHSP), under the CPL funding component, was recognized as being designed to realistically attain its stated objectives and is being implemented as intended, the Department took action on identified areas for improvement related to design/delivery and management issues, outputs and short-term outcomes. Specifically, the program has:
- revised program materials (applications, guidelines and templates) to improve the transparency of the decision-making process;
- enhanced internal processes to achieve efficiencies in the departmental approval process and piloted an approach to streamline the application process for organizations in Qu�bec;
- reviewed and updated the program's performance indicators for outcomes; and,
- developed a data collection process which will allow information from project final reports to be synthesized and analyzed.
Plans and Achievements 2008-2009 - Social Investment
| PLANS | 2008�2009 ACHIEVEMENTS |
|---|---|
| Raise awareness of senior's issues and improve the retirement income system. | Developed policy options for the Canada Pension Plan triennial review, focusing on the
growing number of older Canadians who wishes to remain active in the workforce and on work-to-retirement options. Negotiated international social security agreements with other countries to facilitate the payment of public pensions in and out of Canada. Signed a Canada-Poland agreement; revised the agreement with Australia to include provisions of coverage; completed the final round of negotiations with Serbia, Macedonia and Romania; and commenced negotiations with Argentina and Brazil. Implemented one of the remaining Bill C-36 amendments to the Old Age Security Act. The amendment simplifies the reporting of income for seniors who have experienced a loss of earnings or a loss or reduction of pension income, and who are eligible for the Guaranteed Income Supplement (GIS). The amendment waives the requirement to report income if that information was already provided for purposes elsewhere under the Act. These individuals will only have to report their estimated income. Worked in close collaboration with Service Canada to implement the enhanced GIS earnings exemption that will allow low-income seniors who work to earn more without having their GIS benefits reduced. Rolled out the Working Together Workshop, a strategy to lower or remove barriers to awareness and uptake of CPP and OAS benefits in remote Aboriginal communities. Supported and provided technical expertise to the National Seniors Council on matters related to the well-being and quality of life of seniors. Led the development of a national public awareness campaign on elder abuse. |
| Promote the full participation of people with disabilities in all aspects of society and community life. | Implemented the Canada Disability Savings Grant and Canada Disability Savings Bond program
associated with the new Registered Disability Savings Plan. Completed the first call for proposals for the Enabling Accessibility Fund. In total, 816 proposals were reviewed, 166 small projects were approved and 2 major projects were approved. All projects must meet EAF eligibility requirements and those of other applicable federal programs. |
| Support not-for-profit community sector efforts to innovate, strengthen networks of collaboration, develop capacity and share good practices to contribute to community well-being. | Social Development Partnerships Program (SDPP) provided funding to 51 social development projects, including
8 new national grant projects that supported children, youth and families, persons with disabilities or other vulnerable
populations. Funded projects served to generate knowledge, increase public awareness and establish and maintain
sustainable partnerships. Approximately 500,000 individuals and families had access to information, programs and
services as a result of SDPP funding. Successfully completed a call for proposals for the two New Horizons for Seniors Program grant funding streams: Capital Assistance, and Community Participation and Leadership. As a result, the program supported a total of 1,714 grants for total funding of $26.3 million. Funded 14 projects that involved over 84 organizations and aimed to share innovative best practices in not-for-profit sector service delivery, collaboration, governance, human resources and financing. Collaborated with Agriculture and Agri-Food Canada on a survey dealing with the financing of cooperatives in Canada. Strengthened non-governmental organizations' capacity for early childhood development in official language minority communities. |
2.4.2 Program Activity - Children and Families
Program Activity Description
This program activity provides support to families so that all children have the best possible start in life; that parents have choice in child care; that the needs of those who provide care to loved ones are taken into account; and that families' economic security is sustained. This activity also involves specific initiatives supported by multilateral agreements between the federal government and the provinces and territories through programs such as Canada's Universal Child Care Plan, the National Child Benefit and Multilateral Framework on Early Learning and Child Care. Operating expenditures for this program activity are funded from the Departmental Reference Levels.
Benefits to Canadians
HRSDC helped Canadian families with children meet their child care needs during 2008-2009 by providing direct financial support to eligible families with children through the Universal Child Care Benefit, which complements other tax measures such as the Child Tax Credit. In, 2006, The Universal Child Care Plan, which includes the Universal Child Care Benefit and the Child Care Spaces Initiative, was designed to address the needs of Canadian families with children. The Universal Child Care Benefit Plan provides direct support to eligible families through monthly payments of $100 per child under age 6. The Child Care Spaces Initiative provides $250 million annually to provinces and territories for the development of child care spaces and other child care initiatives.
Also included in the Children and Families program activity is the ongoing implementation of the Federal/Provincial/Territorial Early Childhood Development Agreement (initiated in 2000) and the Federal/Provincial/Territorial Multilateral Framework on Early Learning and Child Care (2003). This essentially involves regular reporting on the well-being and development of young children.
Work is also continuing with provincial and territorial governments on the National Child Benefit (NCB), a joint initiative of Canada's federal, provincial and territorial governments that also includes a First Nations component. The NCB aims to help prevent and reduce the depth of child poverty, support parents as they move into the labour market, and reduce overlap and duplication between government programs. The Government of Canada contributes to the NCB initiative through a supplement to the base benefit of the Canada Child Tax Benefit. This additional payment, called the NCB Supplement, provides extra support to low-income families with children by increasing their monthly Canada Child Tax Benefit payments. In 2006-2007, the Government of Canada invested $3.5 billion through the NCB Supplement and $3.6 billion through the base benefit of the CCTB.
Finally, this program activity contributes to the development of the Working Income Tax Benefit for low- and middle income Canadians and their families.
| 2008-2009 Financial Resources (millions of dollars) |
2008-2009 Human Resources (FTEs) |
||||
|---|---|---|---|---|---|
| Planned Spending |
Total Authorities |
Actual Spending |
Planned | Actual | Difference |
| 2,488.2 | 2,554.1 | 2,553.9 | 155 | 41 | 114 |
| Children and Families Program Performance Summary | ||||
|---|---|---|---|---|
| Expected Results |
Performance Indicators |
Targets | Performance Status and Historical Results |
Performance Summary |
| Provide families with a choice in child care. | Percentage of families who are receiving the Universal Child Care Benefit for their children under age 6. | 100% of eligible families | MET ALL An estimated 99% of eligible families receive the UCCB. |
Effectively 100% performance. |
| Support low-income families with children. | Percentage of low-income families with children who are receiving the National Child Benefit Supplement. | 100% of eligible families | MET ALL An estimated 95% of eligible families receive the NCB Supplement. |
Nearly 100% of eligible families receive the NCB Supplement. |
Performance Analysis
Through the Universal Child Care Benefit, 99 percent of eligible families with children under age 6 were provided support. Variation between the target and the result can could be explained by the fact that some eligible families may not receive the Universal Child Care Benefit payment in a particular month because of problems with mailing addresses. In addition, families can receive up to 11 months in retroactive payments when they apply for the Universal Child Care Benefit.
Provinces and territories have created over 60,000 new child care spaces since the introduction of the $250 million annual transfers for this purpose.
The Department has worked with the Department of Finance Canada and the Canada Revenue Agency on the design of the investment tax credit for child care spaces to support employers in the creation of child care for their employees and the broader community.
As part of the agreement to report regularly on how young children are doing and on investments in programs and services, two key reports were under development in 2008-2009: The Well-Being of Canada's Young Children: Government of Canada Report 2007, and Early Learning and Child Care Activities and Expenditures: Government of Canada Report 2006-2007. A database to replace the annual reports on early childhood development and on early learning and child care activities and expenditures is being developed.
HRSDC worked with the Department of Finance Canada to develop and implement the Working Income Tax Benefit for low- and middle-income Canadians and their families, and to assess its impact on low-income populations in Canada.
Lessons Learned
Reporting - Universal Child Care Benefit
Reporting on the success of the Universal Child Care Benefit and particularly on the proportion of eligible Canadian families who receive the benefits required recognition of the fact that the number of eligible families was based on 2006 census data, whereas the number of families who receive the benefit was based on data from the current calendar year. Discrepancies will become larger with time until we have access to 2011 census data. Furthermore, this data had limited ability to enable coverage assessment at a geographically disaggregated data level (provincial or territorial).
Plans and Achievements 2008-2009 - Children and Families
| PLANS | 2008�2009 ACHIEVEMENTS |
|---|---|
| Provide support and choices for families, through Canada's Universal Child Care Plan and other existing initiatives, to help ensure their children have the best possible start in life. | The Government of Canada has been very successful in providing support to 99 percent of eligible families with children under age 6. Furthermore, provinces and territories have created over 60,000 new child care spaces since the introduction of the $250 million annual transfers for this purpose. Nearly 100 percent of eligible families receive the National Child Benefit Supplement. |
2.4.3 Program Activity - Housing and Homelessness
Program Activity Description
This program activity provides programs and services that assist communities in helping homeless individuals and families, as well as those who are at risk of homelessness, move towards self-sufficiency, thereby contributing to society and the economy. This is accomplished through partnerships with all levels of government, the voluntary and private sectors, foundations, faith-based communities and unions. The program activity's objectives are accomplished through the Homelessness Partnering Strategy, a class contribution and class grant program. Its four class contribution programs are: Homelessness Partnership Initiative (HPI) - Designated Communities; HPI - Outreach Communities; HPI - Aboriginal Communities; and HPI - Federal Horizontal Pilot Projects. The Homelessness Knowledge Development Program, also administered under this program activity, is a class contribution and class grant program that addresses knowledge gaps and priorities regarding homelessness in Canada. Also under Housing and Homelessness, the Surplus Federal Real Property for Homelessness Initiative provides surplus federal properties to communities across Canada to address their local homelessness-related needs; this initiative's funds are administered through Public Works and Government Services Canada. Operating expenditures for this program activity are funded from the Consolidated Revenue Fund.
Benefits to Canadians
The Homelessness Partnering Strategy assists communities in helping homeless individuals and families, as well as those who are at risk of homelessness, move towards self-sufficiency, thereby contributing to society and the economy. This is accomplished through partnerships with all levels of government, the voluntary and private sectors, foundations, and communities.
The Homelessness Partnering Strategy focuses on longer-term housing and support solutions. It follows the "housing-first" approach, which recognizes that housing stability is a precondition to achieving positive socio-economic outcomes and full participation in Canadian society.
| 2008-2009 Financial Resources (millions of dollars) |
2008-2009 Human Resources (FTEs) |
||||
|---|---|---|---|---|---|
| Planned Spending |
Total Authorities |
Actual Spending |
Planned | Actual | Difference |
| 165.6 | 183.7 | 150.7 | 376 | 178 | 198 |
| Housing and Homelessness Program Performance Summary | ||||
|---|---|---|---|---|
| Expected Results |
Performance Indicators |
Targets | Performance Status and Historical Results |
Performance Summary |
| Contribution, with partners, to a more sustainable and comprehensive continuum of supports to help homeless Canadians move towards self-sufficiency and to prevent those at-risk from becoming homeless. | Amount invested in communities by external partners (not-for-profit groups, private sector organizations and other government departments) for every dollar invested by the Homelessness Partnership Initiative. | $1.50 | EXCEEDED $2.99 Historical results 2007-2008: $3.18 2006-2007: $1.89 |
Total financial contributions by external partners as compared to the amount invested by the Department continued to exceed targets: external partners invested $2.99 for every dollar invested in regionally delivered projects. Investments through the Homelessness Partnering Strategy were directed to supports and services based on community-established priorities. |
| Percentage of all Homelessness Partnering Strategy investments targeted to long-term stable housing and related services (note: longer-term housing includes investments in housing loss prevention). | 65% | EXCEEDED 78% Historical results 2007-2008: 73.9% |
The percentage of all Homelessness Partnering Strategy investments targeted to longer-term transitional and supportive housing and services reached 78%. A total of nine housing units were created through the Surplus Federal Real Property for Homelessness Initiative. As a result, nine homeless families/individuals were housed in seven supportive housing units and two transitional housing units. | |
| a Within the portfolio, Human Resources and Skills Development Canada focuses on Homelessness and Canada Mortgage and Housing Corporation focuses on housing. The Program Activity Architecture has been updated to reflect this situation. | ||||
Performance Analysis
In 2008-2009, HRSDC continued its work on the management and implementation of the Homelessness Partnering Strategy (HPS), including the development of options for moving forward beyond 2009. As a result, the Government extended the funding for the Homelessness Partnering Strategy at current levels ($269.6 million) for two years, from April 1, 2009 to March 31, 2011. The Government will maintain annual funding to deal with housing and homelessness until March 31, 2014, as part of its $1.9-billion, five-year commitment. The continuation of the HPS enables programs and services to be provided to assist communities in helping homeless individuals and families, as well as those who are at risk of homelessness, move towards self-sufficiency.
In 2008-2009, a special focus was put on achieving the following results:
- for every dollar invested in regionally delivered projects by the HPS, the amount invested in communities by external partners (not-for-profit groups, private sector organizations and other government departments) rose to $2.99; and
- the percentage of all HPS investments in regionally delivered projects targeted to longer-term transitional and supportive housing and services increased to 78 percent, exceeding the 65 percent target.
In addition, 12 horizontal pilot projects were launched in partnership with other federal departments and agencies, such as Correctional Service Canada, the Public Health Agency of Canada, Citizenship and Immigration Canada, and the Department of Justice Canada. The horizontal pilot projects address issues related to institutional release, HIV/AIDS, transitional and supportive housing, addiction treatment, basic skills and employment development. These horizontal approaches increase the HPS's ability to respond to the November 19, 2008, Speech from the Throne commitment to help Canadians who face barriers to participation in the economy and society. In addition, the horizontal pilot projects are a step towards increased harmonization of transfer payment programs, as encouraged by the new Policy on Transfer Payments, effective October 1, 2008.
The Homelessness Knowledge Development component of the HPS provides funding to stakeholders for activities related to data development, research and analysis, the reinforcement of information networks, and the sharing of good practices. This component allocated funding to 33 successful applicants early in the 2008-2009 fiscal year. The innovative approaches funded by the Homelessness Knowledge Development component include a project currently underway to develop a methodology to count hidden homeless individuals and a project to develop an atlas to map indicators of risk for homelessness in communities across Canada.
In 2008-2009, the Surplus Federal Real Property for Homelessness Initiative was extended for two years (2009-2011). The initiative provides surplus federal properties to community organizations, the not-for-profit sector and other levels of government for projects to prevent and alleviate homelessness. In 2008-2009, a total of nine housing units were created. As a result, nine homeless families/individuals were housed in seven supportive housing units and two longer-term transitional housing units.
Under the Strategy, Provincial/Territorial engagement has resulted in the renewed Canada-Quebec Agreement, signed March 31, 2009, and the renewal of the Canada-Ontario memorandum of understanding is underway.
A conference for Homeless Individuals and Families Information System community coordinators was held in November 2008 to share community reports, achievements and good practices among community coordinators from 22 cities across Canada. This conference produced the following outcomes: strengthened networks; and tools and sharing of good practices to enable community coordinators to better serve their communities' HIFIS needs.
Finally, seven Teleforums were conducted throughout 2008-2009, exploring different topics related to homelessness through presentations and discussions led by experts in the field. Hundreds of organizations serving homeless people, as well as public servants and academics, participated in these learning and networking opportunities.
Lessons Learned
Taking into account local considerations - Homelessness Partnering Strategy
Although positive feedback was received overall for community planning tools and templates, the communities noted that the "one-size-fits-all" approach may not be appropriate for some communities or for a very short planning timeline (e.g., two years or less). The templates, for planning and assessment, are creating significant administrative burdens for some smaller and mid-size communities. The communities believed that the type and amount of data and planning is not always the same for a smaller community when compared with that required for large urban communities.
To reduce the administrative burden on smaller and mid-size communities, the Homelessness Partnering Secretariat has taken a number of actions to simplify the community planning process for the HPS in 2009-2011:
- The validity of existing approved community plans has been extended to four years;
- A streamlined process has been put in place to update community priorities, if needed;
- The Homelessness Partnering Secretariat will conduct an internal assessment of community plans as opposed to having the communities conduct the assessments themselves;
- The Homelessness Partnering Secretariat is preparing a toolkit on governance for the Community Advisory Boards (CABs), which will include topics such as roles and responsibilities and conflict of interest. The outline of the toolkit will be completed in the summer of 2009; and,
- Finally, the Homelessness Partnering Secretariat will examine tools and processes to identify opportunities to streamline and simplify the administrative burden for the planning cycle beginning in April 2011, especially for smaller and mid-size communities.
Plans and Achievements 2008-2009 - Housing and Homelessness
| PLANS | 2008�2009 ACHIEVEMENTS |
|---|---|
| Implement the Homelessness Partnering Strategy. | Continued to provide programs and services that assist communities in helping homeless individuals and families, including those who are at risk of homelessness, move towards self-sufficiency, thereby contributing to society and the economy. This is accomplished through partnerships with all levels of government, the private and voluntary sectors, and other stakeholders. |
| Develop partnerships to better align investments. | Ensured the seamless transition of the Homelessness Partnering Strategy by developing and
implementing a plan to address the extension of project agreements to avoid gaps in services for homeless people
across Canada. The Government of Canada continued to offer provinces and territories the opportunity to enter into bilateral arrangements to deepen collaboration between levels of government. |
| Strengthen horizontal links between Housing and Homelessness and other policy areas. | The Canada-Quebec Agreement was renewed and signed on March 31, 2009, and the renewal of
the Canada-Ontario memorandum of understanding is underway. Twelve horizontal pilot projects were launched in partnership with other federal departments, agencies and policy areas, such as Correctional Service Canada, the Public Health Agency of Canada, Status of Women Canada, and the Department of Justice Canada. The projects address issues related to institutional release, HIV/AIDS, transitional and supportive housing, addiction treatment, basic skills and employment development. |
2.5 Strategic Outcome 5: Achieve better outcomes for Canadians through service excellence
Description of the Strategic Outcome:
Service Canada's commitment to service excellence is measured by its capacity to respond to the ever changing needs
of Canadians. Through its physical presence in Canadian communities, its integrated, cross-channel service delivery
capabilities and its professional workforce, Service Canada delivers day-to-day opportunities to build positive dialogue
and sustained client relationships with Canadians and to advance governmental and departmental priorities aimed at achieving
better results for both citizens and government. Collaborative partnerships are equally vital to Service Canada's success.
In working with government partners, Service Canada plays an important role in supporting the most essential needs of
Canadians, drawing on its infrastructure, delivery channels and service-oriented workforce to deliver quality programs
and services, even on a temporary and transitional basis. From the implementation of Budget 2009 measures, to actions
taken to ensure public access to up-to-date information, Service Canada and its people demonstrated a capacity to support
priority, high-impact Government of Canada initiatives while continuing to respond to day-to-day citizen needs.
While quality service delivery to government and Canadians is Service Canada's primary focus, it must also uphold Canadians' confidence and trust in the integrity of its processing and service delivery operations and in its ongoing capacity to ensure that the right person receives the right service or benefit at the right time, and for the intended purpose.
2.5.1 Program Activity - Seamless, Citizen-Centrer Service
Program Activity Description
This program activity develops service policies and client segment strategies; conducts research and analysis pertaining to citizens' needs and expectations; develops new service offerings and improves existing ones; and delivers one-stop, easy-to-access, personalized services by phone ,mail, on the Internet and in person. Operating expenditures for this program activity are funded from the Departmental Reference Levels, the Employment Insurance Account and the Canada Pension Plan Account.
Benefits to Canadians
Canadians benefit from having easy access to services and benefits through the channel of their choice and in the official language of their choice. The volume and variety of its service offerings strongly suggest that Service Canada helps Canadians, from children to seniors, in key areas of their lives-their work, their families and their personal lives.
| 2008-2009 Financial Resources (millions of dollars) |
2008-2009 Human Resources (FTEs) |
||||
|---|---|---|---|---|---|
| Planned Spending |
Total Authorities |
Actual Spending |
Planned | Actual | Difference |
| 602.2 | 860.5 | 836.9 | 7,335 | 7,379 | (44) |
| Seamless, Citizen-Centred Service Program Performance Summary | ||||
|---|---|---|---|---|
| Expected Results |
Performance Indicators |
Targets | Performance Status and Historical Results |
Performance Summary |
| Citizens are connected to whole-of-government programs and services through easy to access multiple channels that meet their individual needs. | Percentage of access to automated telephone information services (no busy signals). | 95% | EXCEEDED 99.8% Historical results 2007-2008: 95.4% 2006-2007: 98% |
52,135,630 phone calls were received in the interactive voice response system, and only 0.2% of callers experienced a busy signal. |
| Percentage of general enquiry calls answered by an agent within 18 seconds (1 800 O-Canada). | 85% | EXCEEDED 87.0% Historical results 2007-2008: 88% 2006-2007: 85% |
1,803,460 general enquiry calls were answered by 1 800 O Canada agents. | |
| Percentage of specialized calls answered by agents within 180 seconds. | 80% | SOMEWHAT MET 52.6% combined result for EI and CPP/OAS Historical results 2007-2008: 58.5% 2006-2007: 58.5% |
EI call centre workload increased by 6.06
million calls, or 15%. The volume of EI calls answered by agents
increased by 645,814. Almost 10 million calls were answered by EI / Canada Pension Plan / Old Age Security agents. An operational plan was developed and resourced to expand capacity to deal with pressures on EI claim volumes. |
|
| 24/7 Availability of Service Canada Internet - information and transaction. | 98% | EXCEEDED Estimated average of 99.5% Historical results 2007-2008: 99.3% 2006-2007: 99.3% |
An estimated 33 million Internet visits were received. | |
| Percentage of Canadians with access to a Service Canada point of service within 50 kilometres of where they live. | 90% | EXCEEDED 95.6% Historical results 2007-2008: 95.4% 2006-2007: 95.1% |
Since Service Canada was launched, the number of points of service has increased from 325 to 608. | |
| Percentage of Canadians with access to a Service Canada point of service within 50 kilometres of where they live. | 90% | EXCEEDED 95.6% Historical results 2007-2008: 95.4% 2006-2007: 95.1% |
Since Service Canada was launched, the number of points of service has increased from 325 to 608. | |
| Percentage of client satisfaction in relation to services provided. | 80% | EXCEEDED 83% Historical results 2005-2006: 84% |
Key drivers of client satisfaction were information quality, staff quality and access/speed. | |
| Total number of fact sheets/publications available in languages other than English and French (Aboriginal and Foreign). | 11 | EXCEEDED 12 |
Service Canada developed factsheets providing information on its 12 most popular programs (e.g. EI, CPP, OAS) into 20 different languages (8 Aboriginal and 12 Foreign Languages). | |
| Percentage of Apprenticeship Incentive Grant payments issued within 28 days of filing. | 85% | EXCEEDED 98.0% Historical results N/A |
71,970 Apprenticeship Incentive Grant applications were received, and 53,271 grants were issued. The fact that the target was exceeded is explained by the introduction of new internal procedures for processing Apprenticeship Incentive Grant applications. | |
Performance Analysis
In 2008-2009, Service Canada continued to improve the quality of its service offerings and to develop client service strategies to provide Canadians with easy access to benefits and services, whether by phone, by mail, on the Internet or in person. Service Canada made progress on modernizing its operations by providing electronic services that are easier to use, served Canadians in-person at 608 points of service or through mobile outreach services and through the preferred method of citizen interaction, answered millions of phone calls. For 2008-2009, the EI call centres had experienced an additional workload stemming from the economic downturn and new government measures The combined impact of increased call volume to EI specialists and the complexity of queries has contributed to a reduction in service levels (37 percent of calls answered by an agent within 180 seconds) Consequently, measures were taken to help improve performance, including hiring more agents, extending hours of service, introduced Cross-Channel Support and reduced repeat calls by establishing resource sharing agreements to assist regional processing.
Client satisfaction with the overall quality of service received remains high, with 83 percent of clients satisfied in 2008. Clients were also generally satisfied in terms of service delivery, specific programs and services, service channels and client groups.
Lessons Learned
Focus on Worker client segment
Service Canada has learned the importance of strategically located centres; effective tools and methods to define and enhance service delivery; user-friendly application forms and instructions; and easy-to-use technology. It has also learned the benefits of increased automation of EI services. Service Canada's sharper focus on its worker client segment enabled it to respond effectively to a 30 percent increase in the number of EI claimants between October 2008 and March 2009.
Plans and Achievements 2008-2009 - Seamless, Citizen-Centred Service
| Plans | 2008�2009 Achievements |
|---|---|
| Complete Passport expansion, implement authentication pilots and renew agreement. | Service Canada increased passport application receiving services by 40 to a total of 141 sites, renewed its partnership with Passport Canada and conducted seven authentication pilots that will allow clients to retain their citizenship documents when applying for a passport |
| Implement and expand the Wage Earner Protection Program. | The Wage Earner Protection Program was both launched and enhanced to increase its coverage
as a result of the Economic Action Plan. The enhancements include extending the scope of "eligible wages" to include termination and severance pay. |
| Implement Common Experience Payment. | Service Canada issued payments totalling $212,560,000 to 11,291 eligible former students of recognized Indian Residential Schools. |
| Implement simplified and standardized EI, Canada Pension Plan, Old Age Security services in all channels. | Service Canada implemented the Cross Channel Support Service initiative and continued to
modernize the Canada Pension Plan and Old Age Security, thereby achieving greater quality of service to citizens. The Information Technology Renewal Delivery System (ITRDS) is our new platform for the Canada Pension Plan System. ITRDS provides automated eligibility and entitlement determinations, improved integrity and information management. |
| Develop key client segments. | Service Canada designed a new client segment service strategy for Aboriginal people. Service Canada focused on its Workers Service Strategy to respond to the pressing needs of Canadians affected by the economic downturn. |
| Improve efficiency, effectiveness, performance, coordination of channels. | Service Canada launched the streamlined Insurance Payment Operational Centres and the appeals
simplification and automation initiatives. This resulted in greater capacity to meet the increased workload, an improved Web site to help job seekers and the unemployed, and increased call centre network capacity. |
| Implement Service Experience Model. | The Service Experience Model was refined to serve as a guide for all in-person Service
Canada Centres. An evaluation of Service Canada Community Offices was completed to provide evidence-based information on their success, design and delivery, relevance, and cost-effectiveness. |
| Develop contact centre vision and implementation plan. | Service Canada developed a standardized process for the assessment, induction and ongoing
delivery of service offerings. A strategy to reduce Appli -Message, or electronic notes for follow-up to processing, was developed for call centres to increase first-contact resolution and reduce repeat callers and the need to escalate enquiries to processing staff. The strategy was accomplished through a readjustment of the telephony platform. As a result, Cross-Channel Support with the in-person network was expanded to 338 in-person sites across Canada. This resulted in over 150 000 calls handled, with a 69 percent first contact resolution avoiding over 100,000 escalations to processing. |
2.5.2 Program Activity - Integrity
Program Activity Description
This program activity enhances and strengthens the integrity of programs to ensure that the right person receives the right service or benefit at the right time, and for the intended purpose. It implements the Social Insurance Number and the Social Insurance Register as the foundation for a safe and secure client identifier; develops integrity risk management strategies that will address operational risk and lead to the reduction of payment errors; and processes grants and contributions, individual benefits and mail service requests. Operating expenditures for this program activity are funded from the Departmental Reference Levels, the Employment Insurance Account and the Canada Pension Plan Account.
Benefits to Canadians
The swift, timely and accurate payment of benefits in difficult economic times is a major benefit for Canadians affected by job loss or decreased personal and family incomes. This benefit is especially significant in light of the substantial (20 percent) increase in EI applications in 2008-2009 as a result of the economic downturn.
| 2008-2009 Financial Resources (millions of dollars) |
2008-2009 Human Resources (FTEs) |
||||
|---|---|---|---|---|---|
| Planned Spending |
Total Authorities |
Actual Spending |
Planned | Actual | Difference |
| 880.2 | 973.9 | 971.1 | 11,106 | 10,935 | 171 |
| Integrity Program Performance Summary | ||||
|---|---|---|---|---|
| Expected Results |
Performance Indicators |
Targets | Performance Status and Historical Results |
Performance Summary |
| Benefits are delivered in the most cost-effective manner to the right citizen, at the right time, and for the purpose they were intended. | Percentage of EI benefit payment or non-payment notification issued within 28 days of filing. | 80% | MOSTLY MET 79.1% Historical results The target was met consistently from 2004-2005 to 2007-2008. |
By the end of the fiscal year, Service Canada received 3.1 million initial and renewal
EI claims, which represented an increase of 503,000 claims when
compared to the same period in 2007-2008 During the last quarter alone the workload had increased by 270,000 claims
when compared to the previous year. To ensure that Service Canada was well-positioned to maintain its service standards in the face of an increasing workload, the organization advanced the implementation of measures normally used to address the seasonal winter peak period:
98.6% of initial and 90.4% of renewal claims were received electronically. The progress made on automation and electronic services, along with the standardization and simplification of claims processing has also resulted in an effective response to increased volumes. |
| Percentage of CPP retirement benefit payment or non-payment notification issued within first month of eligibility. | 85% | EXCEEDED 91.3% Historical results The target has been met consistently since 2004-2005. |
656,738 Canada Pension Plan retirement applications were processed. | |
| Percentage of OAS basic benefit payment or non-payment notification issued within first month of eligibility. | 90% | EXCEEDED 92.1% Historical results : The target has consistently been met since 2004-2005 |
821,855 Old Age Security applications were processed, and 1,479,755 Guaranteed Income Supplements were renewed. | |
| Percentage of SINs issued using expeditious processes (SIN Rapid Access, Newborn Registration Service in Ontario and BC, and Teleapp in New Brunswick). | 90% | EXCEEDED 90.6% Historical results N/A |
1,514,207 SIN applications were processed through all service channels. | |
| Payment Accuracy of EI. | 95% | EXCEEDED 95.7% Historical results 2007-2008: 94.3% 2006-2007: 94.8% |
Results are a twelve-month moving average in March 2009. | |
| Payment Accuracy of Old Age Security. | 95% | EXCEEDED 98.4% Historical results 2007-2008: 97.7% |
Results are a twelve-month moving average in March 2009. | |
| Payment Accuracy of Canada Pension Plan. | Baseline Year | Baseline Year: 99.7% Historical results N/A |
Results are a twelve-month moving average in March 2009 | |
| Percentage of notifications sent within seven days of receipt of applications. | 80% | MOSTLY MET 69.9% combined result for EI, CPP and OAS(EI = 98.9%; CPP = 20%) Historical results 2007-2008: 65.8% 2006-2007: 65.6% |
Applications received electronically are acknowledged instantly. Since OAS applications are not automated, paper-based applications cannot be guaranteed notification within 7 days; this brought the overall indicator result down to 69.9%. | |
Performance Analysis
In 2008-2009, Service Canada realized operational savings primarily through benefit processing automation for initial and renewal EI claims and through an increase in the number of employers who use Record of Employment Web. Service Canada also realized significant savings by conducting nearly 590,000 identity, fraud and benefit payment investigations against the EI, Canada Pension Plan and Old Age Security programs and the Social Insurance Number, which resulted in $732 million in operational and program savings for the Government.
Integrity risk management strategies were adopted to address operational risk and reduce payment errors. The benefit payment accuracy rate for the Canada Pension Plan, EI and Old Age Security programs was 95 percent or better, and benefits were consistently delivered on time as per established standards.
As such, Service Canada needs to sustain a framework of controls to protect the integrity of personal information and statutory benefit programs and services, and to ensure the smart and effective management of risk.
Lessons Learned
Simplified Process
Given the current socio-economic situation and forecasts of increased workload, ensuring the effective stewardship and administration of core programs and payments is more important than ever. Service Canada has learned the importance of risk mitigation strategies in the processing of benefits and grants. It has learned that proper controls and measures, such as a simplified application process for the Apprenticeship Incentive Grant and single security framework for the "My Service Canada Account," are fundamental to protecting the integrity of personal information and statutory benefit programs and services.
Plans and Achievements 2008-2009 - Integrity
| PLANS | 2008�2009 ACHIEVEMENTS |
|---|---|
| Harvest significant operational savings, primarily through benefits processing automation (EI target of 15-20% initial / 50% renewals by year end) and realize program savings. | The EI Processing Automation allowed Service
Canada to achieve operational savings; 49.4 percent of all claims�32.5 percent of initial claims and 70 percent
of renewal claims�were processed via automation. Service Canada continued its risk-based approach to investigative activities in order to safeguard Canada's social programs from fraud and abuse through nearly 590,000 investigations including those to detect individuals who did not report earning or absences from Canada while receiving EI benefits. This resulted in over $732 million in operational and program savings for the Government. |
| Increase SIN/SIR integrity. | Service Canada maintained its goal of 99.9% for legitimate Social Insurance Numbers and
met its accuracy goal of 97.4% for key vital events data. Service Canada implemented the Quality Management Monitoring system tools and introduced ongoing evaluations of agents as part of the continuing implementation of the Social Insurance Number Quality Management strategy. Service Canada's system improvements reduced the number of critical errors on the Social Insurance Register. |
| Implement common operational risk management frameworks. | Service Canada now has standard tools for systematic qualitative operational risk analysis for service offerings and benefit programs. Risks are identified, managed and reported. |
| Implement quality management framework for OAS and develop one for CPP/EI. | Service Canada continued ongoing assessments of compliance with program authorities and
measurement of payment accuracy for Old Age Security. It also initiated new assessments for the Canada Pension Plan. The Department will continue to work towards the alignment of payment and processing accuracy of EI, OAS and CPP reviews. |
| Develop application and mainframe transition plan. | Building on the successful replacement of obsolete computing platforms, the Department
shifted its focus in 2008-2009 towards the modernization of the legacy application suite. Problem definition and
preliminary business case planning activities were completed. The Department developed a renewal road map to facilitate modernization of its technology infrastructure and associated software applications. |
2.5.3 Program Activity - Collaborative, Networked Government Service
Program Activity Description
This program activity implements a government-wide, collaborative, networked business approach to delivering citizen-centred service to Canadians by working with other federal departments and agencies, other orders of government, and community partners; sharing information; adopting interoperable systems and infrastructures; adhering to privacy legislation and securing citizen's personal information ; and increasing the accuracy of the Social Insurance Register through more timely and complete updates with vital statistics organizations. Operating expenditures for this program activity are funded from the Departmental Reference Levels and the Employment Insurance Account.
Benefits to Canadians
The secure and accurate delivery of services is facilitated by Service Canada and achieved through collaboration among a variety of government organizations. Partnerships have benefited our partners by providing an enhanced presence through access to a multi-channel network and a nimble infrastructure able to deliver time-limited programs, service delivery advice and expertise quickly�which in turn benefits Canadians. The Canadians who benefit from this program activity are as diverse as the numerous citizens who obtain secure travel documents in a timely manner and the low-income families who claim the Working Income Tax Benefit.
| 2008-2009 Financial Resources (millions of dollars) |
2008-2009 Human Resources (FTEs) |
||||
|---|---|---|---|---|---|
| Planned Spending |
Total Authorities |
Actual Spending |
Planned | Actual | Difference |
| 232.4 | 249.7 | 245.7 | 810 | 688 | 122 |
| Collaborative, Networked Government Service Program Performance Summary: | ||||
|---|---|---|---|---|
| Expected Results |
Performance Indicators |
Targets | Performance Status and Historical Results |
Performance Summary |
| Programs and services are synchronized within the federal government and across jurisdictions to enhance efficiency and ease of accessibility for citizens. | Number of new Memoranda of Understanding signed. | 4 | EXCEEDED 5 |
Memoranda of understanding were signed with:
|
Performance Analysis
Service Canada continued to collaborate effectively with other departments and agencies via five new or renewed memoranda of understanding. Service Canada has enabled partner access to its multi-channel network and workforce to deliver time limited programs, service delivery advice and expertise quickly. Partners have been able to focus on core business and improved outcomes, which provides a feedback loop to policy partners and generates cost savings. The renewed initiative with Passport Canada helped Canadians access passport services swiftly and with minimal errors, a significant result in light of the travel identification requirements of the Western Hemisphere Travel Initiative. Service Canada entered into a new umbrella agreement with the Canada Revenue Agency to collaborate on several new service initiatives that benefit taxpayers. Service Canada also partnered with the Labour Program to deliver the new Wage Earner Protection Program.
Lessons Learned
Partnering
Service Canada has recognized the principles of effective partnering with other government departments and organizations and has honed its skills in developing and implementing memoranda of understanding with its partners. Service Canada has learned the importance of engaging partners at an early stage and follows a coordinated and rigorous approach in this regard. This has resulted in clear delineation of its responsibilities versus those of partner organizations. In spite of its strong service delivery infrastructure, Service Canada recognizes the need for a strategic approach to the consideration of new business opportunities.
Plans and Achievements 2008-2009 - Collaborative, Networked Government Service
| PLANS | 2008�2009 ACHIEVEMENTS |
|---|---|
| Implement existing vital events agreements and sign three additional agreements. | Service Canada continued its work under the vital events management strategy by implementing
the linkages with British Columbia, Alberta and Ontario, and it began the national roll-out of electronic validation
with all three provinces. Service Canada obtained historical death files from Nova Scotia and established a working-level partnership with the province. Service Canada also implemented the Social Insurance Number Newborn Registration Service with Alberta. |
| Develop new citizen-centred information architecture. | The Department developed a new labour market training architecture by negotiating a new generation of labour market agreements for non-EI-eligible clients to assist social assistance recipients, immigrants, people with disabilities, youth, older workers and Aboriginal people. |
| Support HRSDC in Labour Market Development Agreement discussions. | Service Canada provided support to the Department in discussions relating to the transfer of Labour Market Development Agreements for Nova Scotia, Prince Edward Island, and Newfoundland and Labrador. |
Section III
Supplementary Information
3.1 Electronic Tables
More information on Tables 1 to 9 can be found at: http://www.tbs-sct.gc.ca/dpr-rmr/st-ts-eng.asp
| Table 1 | Sources of Respendable and Non-Respendable Revenues |
| Table 2 | User Fees/External Fees |
| Table 3 | Details on Transfer Payment Programs |
| Table 4 | Up-Front Multi-Year Funding (formerly Foundations (Conditional Grants)) |
| Table 5 | Horizontal Initiatives |
| Table 6 | Sustainable Development Strategy |
| Table 7 | Green Procurement |
| Table 8 | Response to Parliamentary Committees and External Audits |
| Table 9 | Internal Audits and Evaluations |
The financial statements which provide an accounting of Human Resources and Skills Development Canada's administration
of its public financial affairs and resources to a variety of users both within the government and external to it are available
on-line at:
http://www.hrsdc.gc.ca/eng/publications_resources/dpr/dpr/index.shtml
3.2 Financial Performance Overview - Human Resources and Skills Development Canada
In 2008-2009, the department was authorized to spend $88,520.2 million or $1,394.5 million more than the consolidated planned spending of $87,125.7 million. The variance is explained by:
- An increase of $1,473.5 million in Specified Purpose Accounts mainly due to an increase in Employment Insurance (EI) costs. The increase in EI costs is mostly due to an increase in EI benefits payments attributable to a higher number of beneficiaries than projected and higher weekly benefits.
- An increase of $119.7 million in net operating expenditures mainly due to;
- Funding for collective agreements increase ($42.0 million). A considerable amount of collective agreements have been signed during 2008-2009 such as the Public Service Alliance of Canada (PSAC) agreement;
- Operating budget Carry-forward from 2007-2008 ($17.1 million);
- Realignment from EI Administrative costs to Consolidated Revenue Fund (CRF) ($14.9 million) to compensate for the reduction in administrative costs charged to the Employment Insurance account;
- Paylist Requirements received through TB Vote 30 for maternity leave, severance pay and leave in lieu which are not included in the Planned spending ($17.1 million);
- Funding for Canada Disability Savings Program to administer the new program ($9.3 million). Canada Disability Savings Program is to encourage long-term savings through Registered Disability Savings Plans to provide for the financial security of persons with severe and prolonged impairments in physical or mental functions by providing Government of Canada contributions (Canada Disability Savings Grants and Bonds) as an incentive to both open an Registered Disability Savings Plan and contribute to it;
- New funding for Labour Program Integrity ($6.3 million) to stabilize core program activities of the Labour Program such as improving the quality and availability of mandated mediation services and creating policy capacity to support program development;
- Funding for the 2008-2009 Government of Canada Advertising Plan ($5.5 million) for the advertising campaigns: Post-Secondary Education Financing - Students, Post-Secondary Education Financing - Parents, and Services to Newcomers;
- Funding for the Federal Elder Abuse Initiative ($3.3 million) to help seniors and others recognize the signs and symptoms of elder abuse and to provide information on what support is available;
- Funding to extend joint initiatives with provinces and territories under the Trades and Apprenticeship Strategy that aim to strengthen apprenticeship systems in the Red Seal trades, to promote Aboriginal participation in apprenticeships and the skilled trades, and for capital upgrades of the Interprovincial Computerized Examination Management System ($2.2 million);
- Funding to conduct a national survey on the level of financial literacy of Canadians to assist in identifying required needs and to guide future investors education initiatives ($2.0 million).
- An increase of $81.6 million in loans disbursed under the Canada Student Financial Assistance Act mainly due to the actual amount of repayments being lower than anticipated. In a difficult economic context, students tend to stay in school longer and access debt management measures such as Interest Relief which would have an impact on repayment.
- An increase of $22.6 million in Grants and Contributions mainly due to:
- The re-profiling of funds of $27.4 million from 2007-2008 to 2008 2009 for the Homelessness Partnering Strategy. This re-profile is necessary to honour federal/provincial commitments and the public disclosure of funding levels to municipalities and community groups across Canada;
- The re-profiling of funds of $10.0 million from 2007-2008 to 2008 2009 for Enabling Accessibility Fund to allow the program to fund an exemplary large project to be fully accessible to all people with varying abilities and to serve as a model approach to accessibility in communities;
- Other items ($0.8 million) such as a transfer from Department of Indian and Northern Affairs Canada for Kativik Regional Government, a transfer to Canada Industrial Relations Board relating to the relocation of Vancouver and Montreal regional offices, and to funding for the extension of the Trade and Apprenticeship Strategy;
- Offset by a transfer of funds of $15.6 million between Vote 5 and Vote 1. This represents a technical adjustment within the department to offset HRSDC Vote 1 requirements in Supplementary Estimates (C) 2008-2009.
- Offset by a decrease of $302.9 million in the statutory payment authorities attributable to:
- A decrease of $212.8 million in Old Age Security benefits, which include the Old Age Security pension, the Guaranteed Income Supplement and the Allowance. While there was an increase in Old Age Security pension payments ($13.5 million) due to a greater number of beneficiaries and lower amounts recovered through the OAS Recovery Tax, there was a decrease in Guaranteed Income Supplement payments ($184.5 million) and Allowance payments ($41.8 million) due to a lower number of beneficiaries than originally forecasted;
- A decrease of $114.9 million from Planned spending for Registered Disability Savings Plan due to the late launch in December 2008 and limited marketing of the Plan;
- $29.8 million in Payments related to the direct financing arrangement under the Canada Student Financial Assistance Act. Starting in 2008-2009, Canada Student Loans Program has entered into a new contract with one sole service provider including a brand new costing methodology. The revised fee structure leads to savings over the years. Also, a reduction in program costs due to lower than anticipated interest rates have led to a decrease in Alternative Payments;
- $27.5 million for Wage Earner Protection Program. The Actual spending was lower than forecasted due to a number of factors, including: an implementation date four months after the start of the fiscal year; a delay in the receipt of Wage Earner Protection Program applications and information from trustees who were becoming familiar with the new Program and its process; and lower than anticipated demand for the Program in the early months of its implementation;
- $21.3 million in Liabilities under the Canada Student Loans Act is due to the fact that actual spending is presented net of the recoveries on claims while the planned spending includes only the forecast expenditure of claims payments;
- $7.3 million for Canada Education Savings Grant due to the decrease in Registered Education Savings Plans savings by Canadian families as the economic downturn started to take hold in the fall of 2008;
- $1.2 million related to the provision of funds for interest payments and liabilities in the form of Risk Shared loans under the Canada Student Financial Assistance Act;
- Offset by an increase of:
- $77.8 million for Universal Child Care Benefit due to a higher number of recipients than projected and a slight increase in take up rates;
- $16.2 million in the employee benefit plans mostly due to new collective agreements signed during 2008-2009;
- $13.8 million for Canada Learning Bond due to Department's efforts to publicize the program to the Canada Learning Bond's target population;
- $4.1 million related to other items such as Payments of compensation respecting government employees and merchant seamen.
The actual consolidated expenditures of $88,264.2 million were $256.0 million lower than the total consolidated authorities of $88,520.2 million. This was mainly due to
- Grants and contributions expenditures being $206.8 million less than the authorities, including $89.2 million of
frozen resources due to reprofiles to future years:
- The Apprenticeship Incentive Grant ($45.6 million) is mainly due to lower take-up than what was initially projected based on the 2003 Registered Apprenticeship Information System. Take-up issues were identified and were reviewed in the recent formative evaluation of the Apprenticeship Incentive Grant program;
- Labour Market Agreements ($40.1 million) due to amounts reprofiled into future years to allow Provinces and Territories sufficient flexibility to effectively spend funding while putting new programming in place;
- The Homelessness Partnering Strategy ($32.5 million), of which $20.2 million is to be reprofiled to 2009-2010 and $12.3 million to 2010-2011 to ensure that funds will be available for proposals that are developed for activities to alleviate homelessness;
- Enabling Accessibility Fund ($22.7 million) which $22.2 million was reprofiled into future years to construct and renovate permanent structures and small projects to be fully accessible to all Canadians with varying abilities;
- Targeted Initiative for Older Workers ($14.1 million) due to reprofiling into 2009-2010 to ensure that federal funding committed through agreements with provinces and territories remains available to them to offer older worker programming;
- Adult Learning, Literacy and Essential Skills Program ($13.9 million) due to delays in financial engagement for several multi-year projects.
- Workplace Skills Initiative ($13.3 million) was not in a position to take on new projects given the absence of future year funding;
- Youth Employment Strategy ($12.6 million) due to delays in implementing Skills Link and Career Focus projects, as well as the inability of some employers to fill all the positions for which they were approved for Canada Summer Jobs funding and because some students left their jobs early;
- Aboriginal Skills and Employment Partnerships ($3.7 million) due to deferral of projects into next fiscal year, mainly due to delays in project proposal start dates;
- Sector Council Program ($1.5 million) due to deferral of projects into next fiscal year and delays in approved project start-up;
- Labour Market Agreements for Persons with Disabilities ($1.5 million) due to funds being kept in reserve for the Territories, who have not as yet participated in the program;
- New Horizons for Seniors Program ($1.3 million) due to delays in approvals and signing of agreements resulted in later than anticipated project start dates;
- Labour Management Partnership Program ($1.2 million) due to a lower-than-projected number of approved projects;
- Other lapses ($2.8 million) such as for Opportunities Fund for Persons with Disabilities and Foreign Credential Recognition.
- A net operating lapse of $25.1 million related to $2.3 million in frozen resources, $5.5 million in Special Purpose Allotments and $17.3 million in general lapse. The $17.3 million has been requested as a carry-forward to 2009-2010.
- The other actual expenditures were $24.1 million less than the authorities, mostly due to the variance in the Employment Insurance costs and in the Canada Pension Plan costs.
3.3 Specified Purpose Accounts
Introduction
Specified Purpose Accounts (SPA) are special categories of revenues and expenditures. They report transactions of certain accounts where enabling legislation requires that revenues be earmarked and that related payments and expenditures be charged against such revenues. The transactions of these accounts are to be accounted for separately.
HRSDC is responsible for the stewardship of
four such accounts:
the Employment Insurance (EI)
Account;
the Canada Pension Plan (CPP);
the Government Annuities Account; and
the Civil Service Insurance Fund.
The EI Account is a consolidated SPA and is included in the financial reporting of the Government of Canada. Consolidated SPAs are used principally where the activities are similar in nature to departmental activities and the transactions do not represent liabilities to third parties but, in essence, constitute Government revenues and expenditures.
The CPP is a SPA but is not consolidated as part of the Government of Canada financial statements. It is under joint control of the government and the participating provinces. As administrator, the government's authority to spend is limited to the balance in the Plan.
The Government Annuities Account is a consolidated SPA and is included in the financial reporting of the Government of Canada. It was established by the Government Annuities Act, and modified by the Government Annuities Improvement Act, which discontinued sales of annuities in 1975. The account is valued on an actuarial basis each year, with the deficit or surplus charged or credited to the Consolidated Revenue Fund.
The Civil Service Insurance Fund is a consolidated SPA and is included in the financial reporting of the Government of Canada. It was established by the Civil Service Insurance Act. Pursuant to subsection 16(3) of the Civil Service Insurance Regulations, the amount of actuarial deficits is transferred from the Consolidated Revenue Fund to the Civil Service Insurance Account in order to balance the assets and liabilities of the program.
The following information updates forecasted data on the EI Account and CPP that the Department provided in the 2008-2009 Report on Plans and Priorities4 . That report presented multi-year financial data and general information. Additional information on performance and year end data is available at the internet addresses provided in this section.
Employment Insurance Account
The table below summarizes the financial results for the EI Account from 2006-2007 to 2008-2009.
| EI Account - Statement of Operationsa | |||
|---|---|---|---|
| Actual | |||
| (millions of dollars) | 2006-2007 | 2007-2008 | 2008-2009 |
| Expenditures | |||
| Benefits | 14,079 | 14,293 | 16,308 |
| Administrative Costs | 1,636 | 1,689 | 1,801 |
| Doubtful Accountsb | 99 | 81 | 27 |
| Sub-Total | 15,815 | 16,063 | 18,137 |
| EI Premiums and Penalties | |||
| Premiums | 17,109 | 16,877 | 17,217 |
| Penalties | 56 | 58 | 41 |
| Sub-Total | 17,165 | 16,935 | 17,258 |
| Variance | 1,351 | 872 | (879) |
| Premium Rate(% of Insurable Earnings) | 2007 | 2008 | 2009 |
| Employee | 1.80% | 1.73% | 1.73% |
| Employer | 2.52% | 2.42% | 2.42% |
| a. The EI Account is a consolidated
SPA and is included in the financial reporting of
the Government of Canada. Consolidated SPAs are used principally
where the activities are similar in nature to departmental activities and the transactions do not represent liabilities
to third parties but, in essence, constitute government revenues and expenditures. b. Represents write-offs and estimates of uncollectible account receivables for benefit overpayments and penalties imposed. |
|||
Despite the reduction in the premium rate in 2008-2009, revenues from EI premiums increased due to the growth in employment and earnings. EI benefit payments increased in 2008-2009 due to an increase in the number of beneficiaries and higher weekly benefits. As a result, expenditures exceeded revenues by $0.9 billion. The revenue shortfall was offset by $1.0 billion in interest earned and $0.1 billion in additional funding for measures introduced in Budget 2009, resulting in the notional cumulative surplus in the EI Account increasing by $0.2 billion to $57.2 billion as of March 31, 2009.
More detailed information is reported in the 2008-2009 audited EI Account financial statements that are included in the 2009 Public Accounts of Canada, Volume 1, Section 45. HRSDC also offers information on Employment Insurance on its website.6 It provides information on the authority, objectives and details of the program as well as links to Actuarial Reports and the EI Commission's annual Monitoring and Assessment Reports.
Canada Pension Plan
The following table summarizes the financial results for the Canada Pension Plan (CPP) from 2006-2007 to 2008-2009.
More information relating to 2008 2009 is reported in the Canada Pension Plan financial statements which can be found in the 2009 Public Accounts of Canada, Volume 1, Section 6.
| Canada Pension Plan - Summary | ||||
|---|---|---|---|---|
| 2006-20074 | 2007-2008 | 2008-2009 | ||
| ($ millions) | Actual | Forecast | Actual | |
| Revenue | ||||
| Contributions | 32,355 | 35,346 | 34,023 | 36,506 |
| Investment Income | ||||
| Canada Pension Plan | 9 | 11 | 7 | 6 |
| CPP Investment Board1 | 12,788 | (268) | - | (23,576) |
| CPP Investment Fund2 | 247 | - | - | - |
| Total Investment Income | 13,044 | (257) | 7 | (23,570) |
| Total Revenue | 45,399 | 35,089 | 34,030 | 12,936 |
| Expenditures | ||||
| Benefit Payments | 26,115 | 27,536 | 28,993 | 29,005 |
| Administrative Expenses3 | 574 | 599 | 627 | 694 |
| Total Expenditures | 26,689 | 28,135 | 29,620 | 29,699 |
| Increase / Decrease | 18,710 | 6,954 | 4,410 | (16,763) |
| Year-end Balance | 119,831 | 126,785 | 131,195 | 110,022 |
| 1 Canada Pension Plan Investment Board actual amounts are based on their audited financial
statements. The CPP Investment Board invests mainly in equities and
fixed income securities. The investment income is composed of realized gains and losses from investments, unrealized
gains and losses on investments held at the end of the period (change in fair value) and foreign exchange gains
and losses. For 2008-2009, there was a net investment loss. 2 The Canada Pension Plan Investment Fund was made up of provincial, territorial and government bonds. As of March 31, 2006, these were valued at fair value. Since May 2004, the rights and titles of the CPP Investment Fund bonds were being transferred, over a three year period and on a monthly basis, to the CPP Investment Board. After the last portion (36/36th at $630 million) of the Investment Fund was transferred to the CPP Investment Board on April 1, 2007, the CPP Investment Fund ceased to exist. 3 Administrative Expenses include CPP Administrative Expenses as well as CPP Investment Board Administrative Expenses. 4 The 2006-2007 actual figures have been restated. Please Note: All amounts from this table for 2006-2007 and 2007-2008 are the consolidated amounts found in the audited CPP annual financial statements. |
||||
Government Annuities Account
The table below summarizes the financial results for the Government Annuities Account from 2006-2007 to 2008-2009. Source of the figures is the Report of the Chief Actuary on the Government Annuities as at March 31, 2009.
| Government Annuities Account - Statement of Operations and Actuarial Liabilities | |||
|---|---|---|---|
| Actual | |||
| (millions of dollars) | 2006-2007 | 2007-2008 | 2008-2009 |
| Actuarial Liabilities � | |||
| Balance at Beginning of Year | 347.2 | 319.4 | 292.9 |
| Income | 23.4 | 21.1 | 19.4 |
| Payments and Other Charges | 48.3 | 45.0 | 42.0 |
| Excess of Payments and Other Charges Over Income for the Year | 24.9 | 23.9 | 22.6 |
| Actuarial Surplus | 2.9 | 2.6 | 3.1 |
| Actuarial Liabilities � | |||
| Balance at End of the Year | 319.4 | 292.9 | 267.2 |
The annual report and financial statements for Government Annuities are available in the 2009 Public Accounts of Canada, Volume 1, Section 67.
Civil Service Insurance Fund
The table below summarizes the financial results for the Civil Service Insurance Fund from 2006-2007 to 2008-2009.
| Civil Service Insurance Fund - Statement of Operations and Balance | |||
|---|---|---|---|
| Actual | |||
| (millions of dollars) | 2006-2007 | 2007-2008 | 2008-2009 |
| Opening Balance | 6.3 | 6.0 | 5.9 |
| Receipts and Other Credits | 0.0 | 0.1 | 0.0 |
| Payments and Other Charges | 0.3 | 0.2 | 0.3 |
| Excess of Payments and Other Charges Over Income for the Year | 0.3 | 0.1 | 0.3 |
| Balance at End of the Year | 6.0 | 5.9 | 5.6 |
The annual report and financial statements for the Civil Service Insurance Fund are available in the 2009 Public Accounts of Canada, Volume 1, Section 68 .
3.4 Statutory Annual Reports
Old Age Security
The Old Age Security program is one of the cornerstones of Canada's retirement income system. Benefits include the basic Old Age Security pension, the Guaranteed Income Supplement and the Allowance. The Old Age Security program is financed from Government of Canada general tax revenues.
The following tables present information on monthly benefits, beneficiaries and payments by province or territory.
| (dollars) | Basic Pension | Income Supplement | Allowance | |||
|---|---|---|---|---|---|---|
| Fiscal Year | Single | Married | Regular | Survivor | Increase | |
| Monthly benefit by fiscal year | ||||||
| 2008-2009 Actuals | ||||||
| January 1, 2009 | 516.96 | 652.51 | 430.90 | 947.86 | 1,050.68 | 0.0% |
| October 1, 2008 | 516.96 | 652.51 | 430.90 | 947.86 | 1,050.68 | 2.2% |
| July 1, 2008 | 505.83 | 638.46 | 421.62 | 927.45 | 1,028.06 | 0.7% |
| April 1, 2008 | 502.31 | 634.02 | 418.69 | 921.00 | 1,020.91 | 0.0% |
| 2008-2009 Estimates | ||||||
| January 1, 2009 | 511.39 | 645.50 | 426.28 | 937.67 | 1,039.39 | 0.1% |
| October 1, 2008 | 510.88 | 644.86 | 425.85 | 936.73 | 1,038.35 | 0.8% |
| July 1, 2008 | 506.83 | 639.74 | 422.47 | 929.30 | 1,030.11 | 0.7% |
| April 1, 2008 | 503.31 | 635.29 | 419.53 | 922.84 | 1,022.95 | 0.2% |
| 2007-2008 Actuals | ||||||
| January 1, 2008 | 502.31 | 634.02 | 418.69 | 921.00 | 1,020.91 | 0.0% |
| October 1, 2007 | 502.31 | 634.02 | 418.69 | 921.00 | 1,020.91 | 0.9% |
| July 1, 2007 | 497.83 | 628.36 | 414.96 | 912.79 | 1,011.80 | 1.2% |
| April 1, 2007 | 491.93 | 620.91 | 410.04 | 901.97 | 999.81 | 0.0% |
| Maximum amount paid (annual benefits) | ||||||
| 2008-2009 Actuals | 6,126.18 | 7,732.50 | 5,106.33 | 11,232.51 | 12,450.99 | 2.4% |
| 2008-2009 Estimates | 6,097.23 | 7,696.17 | 5,082.39 | 11,179.62 | 12,392.40 | 1.9% |
| 2007-2008 Actuals | 5,983.14 | 7,551.93 | 4,987.14 | 10,970.28 | 12,160.29 | 3.4% |
| March 2008 | March 2009 | |||||||
|---|---|---|---|---|---|---|---|---|
| Province or Territory | Old Age Security (OAS) Pension | Guarantee Income Supplement (GIS) | Allowance | GIS as % of OAS | Old Age Security (OAS) Pension | Guarantee Income Supplement (GIS) | Allowance | GIS as % of OAS |
| Newfoundland and Labrador | 72,546 | 45,411 | 4,533 | 62.60 | 74,884 | 45,766 | 4,360 | 61.12 |
| Prince Edward Island | 20,108 | 9,374 | 575 | 46.62 | 20,645 | 9,320 | 556 | 45.14 |
| Nova Scotia | 138,753 | 59,664 | 4,353 | 43.00 | 142,077 | 59,515 | 4,120 | 41.89 |
| New Brunswick | 110,215 | 54,582 | 4,299 | 49.52 | 112,962 | 54,434 | 4,194 | 48.19 |
| Quebec | 1,108,175 | 520,851 | 31,572 | 47.00 | 1,142,879 | 518,355 | 30,353 | 45.36 |
| Ontario | 1,647,106 | 485,298 | 27,805 | 29.46 | 1,690,561 | 479,751 | 26,741 | 28.38 |
| Manitoba | 161,191 | 59,436 | 3,395 | 36.87 | 163,581 | 58,026 | 3,299 | 35.47 |
| Saskatchewan | 146,431 | 57,601 | 3,223 | 39.34 | 147,341 | 55,326 | 3,144 | 37.55 |
| Alberta | 355,789 | 119,202 | 5,642 | 33.50 | 365,759 | 117,370 | 5,497 | 32.09 |
| British Columbia | 586,798 | 193,749 | 10,844 | 33.02 | 603,784 | 194,667 | 11,009 | 32.24 |
| Yukon | 2,501 | 803 | 45 | 32.11 | 2,638 | 806 | 55 | 30.55 |
| Northwest Territoriesa | 2,939 | 1,586 | 113 | 53.96 | 3,098 | 1,613 | 118 | 52.07 |
| Internationalb | 87,118 | 8,606 | 70 | 9.88 | 90,885 | 8,546 | 62 | 9.40 |
| Total | 4,439,670 | 1,616,163 | 96,469 | 36.40 | 4,561,094 | 1,603,495 | 93,508 | 35.16 |
| a. Data for Nunavut are included. b. Persons receiving Canadian Old Age Security benefits under International Agreements on Social Security. |
||||||||
| (dollars) | ||||
|---|---|---|---|---|
| Province or Territory | Old Age Security (OAS) Pension | Guaranteed Income Supplement (GIS) | Allowance | Total |
| Newfoundland and Labrador | 451,926,895 | 194,919,910 | 26,404,359 | 673,251,163 |
| Prince Edward Island | 124,638,174 | 39,566,871 | 2,728,466 | 166,933,511 |
| Nova Scotia | 858,662,939 | 239,469,565 | 21,387,976 | 1,119,520,480 |
| New Brunswick | 682,490,393 | 227,710,075 | 23,188,246 | 933,388,714 |
| Quebec | 6,822,701,042 | 2,262,353,402 | 158,638,209 | 9,243,692,653 |
| Ontario | 9,740,356,539 | 2,436,221,662 | 162,312,914 | 12,338,891,115 |
| Manitoba | 982,467,436 | 242,013,710 | 18,331,068 | 1,242,812,214 |
| Saskatchewan | 899,296,755 | 229,577,568 | 17,671,104 | 1,146,545,426 |
| Alberta | 2,140,130,884 | 553,467,482 | 33,859,827 | 2,727,458,193 |
| British Columbia | 3,432,150,596 | 986,820,665 | 64,994,185 | 4,483,965,446 |
| Yukon | 15,695,391 | 3,558,918 | 275,273 | 19,529,582 |
| Northwest Territoriesa | 18,670,483 | 8,453,441 | 876,997 | 28,000,921 |
| Internationalb | 115,567,453 | 87,408,061 | 528,276 | 203,503,790 |
| Total | 26,284,754,980 | 7,511,541,329 | 531,196,900 | 34,327,493,209 |
| Recovery tax portion of OAS | (950,233,271) | - | - | (950,233,271) |
| Total including recovery tax | 25,334,521,709 | 7,511,541,329 | 531,196,900 | 33,377,259,938 |
| a. Data for Nunavut are included. b. Persons receiving Canadian Old Age Security benefits under International Agreements on Social Security. |
||||
Consolidated Report on Canada Student Loans
In August 2000, the Canada Student Loans Program was shifted from the risk-shared financing arrangements that had been in place with financial institutions between 1995 and July 2000 to a direct student loan financing plan.9 This meant that the Program had to redesign the delivery mechanism in order to directly finance student loans. In the new arrangement, the Government of Canada provides the necessary funding to students a service provider is responsible to administer the loans.
Reporting Entity
The entity detailed in this report is the Canada Student Loans Program only and does not include departmental operations related to the delivery of the Canada Student Loans Program. Expenditures figures are primarily statutory in nature, made under the authority of the Canada Student Loans Act and the Canada Student Financial Assistance Act.
Basis of Accounting
The financial figures are prepared in accordance with generally accepted accounting principles and as reflected in the Public Sector Accounting Handbook of the Canadian Institute of Chartered Accountants.
Revenues
Two sources of revenue are reported: interest revenue on Direct Loans and recoveries on Guaranteed and Put Back Loans. Government accounting practices require that recoveries from both sources be credited to the government's Consolidated Revenue Fund. They do not appear along with the expenditures in the Canada Student Loans Program accounts, but are reported separately in the financial statements of Human Resources and Skills Development Canada (HRSDC) and the government.
Interest Revenue on Direct Loans
Borrowers are required to pay simple interest on their student loans once they leave full-time studies. At the time they leave school, students have the option of selecting a variable (prime + 2.5%) or fixed (prime + 5%) interest rate. The figures represent the interest accrued on the outstanding balance of the government-owned Direct Loans. Borrowers continue to pay the interest accruing on the guaranteed and risk-shared loans directly to the private lender holding these loans. The weekly loan limit is set at $210 per week of study.
Recoveries on Guaranteed Loans
The government reimburses the private lenders for any loans issued prior to August 1, 1995 that go into default (i.e., lenders claim any amount of principal and interest not repaid in full). The figures represent the recovery of principal and interest on these defaulted loans.
Recoveries on Put-back Loans
Under the risk-shared agreements, the government will purchase from the participating financial institutions any loans issued between August 1, 1995 to July 31, 2000 that are in default of payments for at least 12 months after the period of study, that in aggregate, do not exceed 3% of the average monthly balance of the lender's outstanding student loans in repayments. The amount paid is set at 5% of the value of the loans in question. The figures represent the recovery of principal and interest on these loans.
Canada Study Grants and Canada Access Grants
Canada Study Grants and Canada Access Grants improve access to post-secondary education by providing non-repayable financial assistance to post-secondary students. Four types of Canada Study Grants are available to assist: (1) students with permanent disabilities in order to meet disability-related educational expenses (up to $8,000 annually); (2) students with dependants (up to $3,120 for full-time students and up to $1,920 for part-time students, annually); (3) high-need part-time students (up to $1,200 annually); and (4) women in certain fields of Ph.D. studies (up to $3,000 annually for up to three years). Two Canada Access Grants are available since August 1, 2005, to assist: (1) students from low-income families entering their first year of post-secondary studies (50% of tuition, up to $3,000); and (2) students with permanent disabilities in order to assist with education and living expenses (up to $2,000 annually).
Collection Costs
These amounts represent the cost of using private collection agencies to collect defaulted Canada Student Loans. The loans being collected include: risk-shared and guaranteed loans that have gone into default and for which the government has bought back from the private lender; and Direct Loans issued after July 31, 2000, that are returned to HRSDC by the third party service provider as having defaulted. As of August 1, 2005 the Canada Revenue Agency Non Tax Collections Directorate undertook the responsibility for the administration of the collection activities of the guaranteed, risk-shared and direct student loans.
Program Delivery Costs
Canada Student Loans Program uses third party service providers to administer borrower authentication, in-study loan management, post-studies repayment activities and debt management. This item represents the cost associated with these contracted services.
Risk Premium
Risk premium represents part of the remuneration offered to lending institutions participating in the risk-shared program from August 1, 1995 to July 31, 2000. The risk premium represents 5% of the value of loans being consolidated which is calculated and paid at the time students leave studies and go into repayment. In return, the lenders assume the risk associated with non-repayment of these loans.
Put-Back
Subject to the provisions of the contracts with lending institutions, the government will purchase from a lender the student loans that are in default of payment for at least 12 months and that, in aggregate, do not exceed 3% of the average monthly balance of the lender's outstanding student loans in repayments. The amount paid is set at 5% of the value of the loans in question. The figures also include any refund made to participating financial institutions on the recoveries.
Administrative Fees to Provinces and Territories
Pursuant to the Canada Student Financial Assistance Act, the government has entered into arrangements with nine provinces and one territory to facilitate the administration of the Canada Student Loans Program. They administer the application and needs assessment activities associated with federal student financial assistance and in return they are paid an administrative fee.
In-Study Interest Borrowing Expense
The capital needed to issue the Direct Loans is raised through the Department of Finance's general financing activities. The cost of borrowing this capital is recorded in the Department of Finance's overall financing operations. The figures represent the cost attributed to Canada Student Loans Program in support of Direct Loans while students are considered in study status.
In-Repayment Interest Borrowing Expense
The capital needed to issue the Direct Loans is raised through the Department of Finance's general financing activities. The cost of borrowing this capital is recorded in the Department of Finance's overall financing operations. The figures represent the cost attributed to Canada Student Loans Program in support of Direct Loans while students are in repayment of their Canada Student Loans.
In-Study Interest Subsidy
A central feature of federal student assistance is that student borrowers are not required to pay the interest on their student loans as long as they are in full-time study and, in the case of loans negotiated prior to August 1, 1993, for six months after the completion of studies. Under the guaranteed and risk-shared programs, the government pays the interest to the lending institutions on behalf of the student.
Interest Relief
Assistance may be provided to cover loan interest and suspend payments on the principal of loans in repayment for up to 54 months for borrowers experiencing temporary difficulties repaying their loans. The shift from Guaranteed and Risk-Shared Loans to Direct Loans did not alter interest relief for loans in distress from the borrower's perspective; however, the method of recording associated costs changed. For loans issued prior to August 1, 2000, Canada Student Loans Program compensates lending institutions for lost interest equal to the accrued interest amount on loans under Interest Relief. For loans issued after August 1, 2000, an interest relief expense is recorded to offset the accrued interest on direct loans.
Debt Reduction in Repayment
Debt Reduction in Repayment assists borrowers experiencing long-term difficulties repaying their loans. Debt Reduction in Repayment is a federal repayment assistance program through which the Government of Canada reduces a qualifying borrower's outstanding Canada Student Loans principal to an affordable amount after Interest Relief has been exhausted and only after 5 years have passed since the borrower ceased to be a student. As of August 1, 2005, the maximum amount of Debt Reduction in Repayment assistance is $26,000, which is available to eligible borrowers in an initial deduction of up to $10,000, a second deduction of up to $10,000 and a final deduction of up to $6,000. For loans issued prior to August 1, 2000, Canada Student Loans Program pays the lending institutions the amount of student debt principal reduced by the Government of Canada under Debt Reduction in Repayment. For loans issued after August 1, 2000, the Government of Canada forgives a portion of the loan principal.
Claims Paid and Loans Forgiven
From the beginning of the program in 1964 until July 31, 1995, the government fully guaranteed all loans issued to students by private lenders. The government reimburses private lenders for any of these loans that go into default (i.e., subject to specific criteria, lenders may claim any amount of principal and interest not repaid in full, after which the Canada Revenue Agency's Collection Services will attempt to recover these amounts).10 The risk-shared arrangements also permitted loans issued from August 1, 1995 to July 31, 2000 to be guaranteed under specific circumstances. This item represents the costs associated with loan guarantees.
Pursuant to the Canada Student Loans Act and the Canada Student Financial Assistance Act, the government incurs the full amount of the unpaid principal plus accrued interest in the event of the death of the borrower or, if the borrower becomes permanently disabled and cannot repay the loan without undue hardship.
Bad Debt Expense
Under Direct Loans, the government owns the loans issued to students and must record them as assets. As a result, generally accepted accounting principles require a provision be made for potential future losses associated with these loans. The provision must be made in the year the loans are issued even though the losses may occur many years later. The figures represent the annual adjustment to the provisions for Bad Debt and Debt Reduction in Repayment on Direct Loans.
Alternative Payments to Non-participating Provinces and Territories
Provinces and territories may choose not to participate in the Canada Student Loans Program. These provinces and territories receive an alternative payment to assist in the cost of delivering a similar student financial assistance program.
Commitments
Starting March 17, 2008, the Canada Student Loans Program entered into a new agreement with one single Service Provider. For the 2009-2010 fiscal year, the expected cash flow for the service provider contract is $ 61.0 millions
| Actual | 2008-2009 | |||
|---|---|---|---|---|
| (millions of dollars) | 2006-2007 | 2007-2008e | Forecast | Actual |
| Revenues | ||||
| Interest Revenue on Direct Loans | 453.3 | 537.1 | 551.5 | 472.8 |
| Recoveries on Guaranteed Loans | 55.3 | 46.6 | 52.6 | 38.5 |
| Recoveries on Put-Back Loans (RS) | 14.5 | 13.5 | 15.2 | 13.1 |
| Total Loan Revenue | 523.1 | 597.3 | 619.3 | 524.4 |
| Expenses | ||||
| Transfer payment | ||||
| Canada Study Grants and Canada Access Grants | 146.4 | 161.5 | 142.9 | 143.2 |
| Loan Administration | ||||
| Collection Costs (All regimes)a | 12.4 | 14.4 | 12.5 | 8.5 |
| Program Delivery Costs (DL) | 65.6 | 70.8 | 84.2 | 76.0 |
| Risk Premium to Financial Institutions (RS) | 1.8 | 1.3 | 1.3 | 0.7 |
| Put-Back to Financial Institutions (RS) | 4.7 | 3.8 | 5.2 | 3.8 |
| Administrative Fees to Provinces and Territories (DL) | 14.7 | 13.7 | 14.4 | 14.7 |
| Total Loan Administration Expenses | 99.2 | 104.0 | 117.6 | 103.7 |
| Cost of Government Benefits to Students | ||||
| In-Study Interest Borrowing Expense (Class A - DL)b | 185.7 | 196.4 | 195.7 | 166.9 |
| In Repayment Interest Borrowing Expense (Class B - DL)b | 145.0 | 173.6 | 227.6 | 160.7 |
| In-Study Interest Subsidy (RS & GL) | 11.5 | 8.0 | 2.0 | 4.0 |
| Interest Relief (All regimes) | 84.2 | 93.2 | 101.3 | 82.6 |
| Claims Paid & Loans Forgiven (All) | 24.2 | 17.0 | 17.3 | 23.2 |
| Total Cost of Govt Benefits to Students | 470.7 | 502.5 | 550.7 | 448.0 |
| Bad Debt Expensec | ||||
| Debt Reduction in Repayment Expense (DL) | 9.6 | 12.4 | 14.3 | 53.2 |
| Bad Debt Expense (DL) | 260.4 | 293.5 | 363.8 | 293.6 |
| Total Bad Debt Expense | 270.0 | 305.9 | 378.1 | 346.8 |
| Total Loan Expenses | 986.3 | 1,073.9 | 1,189.3 | 1,041.7 |
| Net Operating Results | 463.2 | 476.6 | 570.0 | 517.3 |
| Alternative Payments to Non-Participating Provinces (DL)d | 91.3 | 113.9 | 117.9 | 111.0 |
| Final Net Operating Results | 554.5 | 590.5 | 687.9 | 628.3 |
| (DL) = Direct Loans (RS) = Risk-Shared Loans (GL) = Guaranteed Loans a. These costs are related to collection activities performed by the Canada Revenue Agency. b. These costs are related to Canada Student Direct Loans but reported by the Department of Finance. c. This represents the annual expense against the Provisions for Bad Debt and Debt Reduction in Repayment as required under Accrual Accounting. d. The figures represent the annual expense recorded under the Accrual Accounting as opposed to the actual amount disbursed to the Non-Participating Provinces. For 2007-2008, the total amount disbursed as Alternative Payments s $115,8 M. e. Actuals for 2007-2008 for Interest revenue on Direct Loans, In-Study Interest Borrowing Expense (Class A), In-Repayment Interest Borrowing Expense (Class B) and Bad Debt Expense have been adjusted following a revision of financial data. |
||||
| Actual | 2008-2009 | |||
|---|---|---|---|---|
| (millions of dollars) | 2006-2007 | 2007-2008 | Forecast | Actual |
| Revenues | ||||
| Recoveries on Guaranteed Loans | 55.3 | 46.6 | 52.6 | 38.5 |
| Recoveries on Put-Back Loans (RS) | 14.5 | 13.5 | 15.2 | 13.1 |
| Total Loan Revenue | 69.8 | 60.2 | 67.8 | 51.6 |
| Expenses | ||||
| Loan Administration | ||||
| Collection Costsa | 5.3 | 4.9 | 4.7 | 3.2 |
| Risk Premium to Financial Institutions (RS) | 1.8 | 1.3 | 1.3 | 0.7 |
| Put-Back to Financial Institutions (RS) | 4.7 | 3.8 | 5.2 | 3.8 |
| Total Loan Administration Expenses | 11.8 | 10.0 | 11.2 | 7.7 |
| Cost of Government Benefits to Students | ||||
| In-Study Interest Subsidy | 11.5 | 8.0 | 2.0 | 4.0 |
| Interest Relief | 20.8 | 14.4 | 8.1 | 8.0 |
| Debt Reduction in Repayment | 20.1 | 14.3 | 6.8 | 10.6 |
| Claims Paid & Loans Forgiven | 17.0 | 9.8 | 7.5 | 9.7 |
| Total Cost of Govt Benefits to Students | 69.4 | 46.5 | 24.4 | 32.3 |
| Total Loan Expenses | 81.2 | 56.5 | 35.6 | 40.0 |
| Final Net Operating Results | 11.4 | (3.7) | (32.2) | (11.6) |
| (RS) = Risk-Shared Loans a. These costs are related to collection activities performed by the Canada Revenue Agency. |
||||
| Actual | 2008-2009 | |||
|---|---|---|---|---|
| (millions of dollars) | 2006-2007 | 2007-2008e | Forecast | Actual |
| Revenue | ||||
| Interest Revenue on Direct Loans | 453.3 | 537.1 | 551.5 | 472.8 |
| Total Loan Revenue | 453.3 | 537.1 | 551.5 | 472.8 |
| Expenses | ||||
| Transfer payment | ||||
| Canada Study Grants and Canada Access Grants | 146.4 | 161.5 | 142.9 | 143.2 |
| Loan Administration | ||||
| Collection Costsa | 7.1 | 9.5 | 7.8 | 5.3 |
| Program Delivery Costs | 65.6 | 70.8 | 84.2 | 76.0 |
| Administrative Fees to Provinces and Territories | 14.7 | 13.7 | 14.4 | 14.7 |
| Total Loan Administration Expenses | 87.4 | 94.0 | 106.4 | 96.0 |
| Cost of Government Benefits to Students | ||||
| In-Study Interest Borrowing Expense (Class A )b | 185.7 | 196.4 | 195.7 | 166.9 |
| In Repayment Interest Borrowing Expense (Class B )b | 145.0 | 173.6 | 227.6 | 160.7 |
| Interest Relief | 63.4 | 78.8 | 93.2 | 74.6 |
| Loans Forgiven | 63.4 | 78.8 | 93.2 | 74.6 |
| Total Cost of Govt Benefits to Students | 401.3 | 456.0 | 526.3 | 415.7 |
| Bad Debt Expensec | ||||
| Debt Reduction in Repayment Expense | 9.6 | 12.4 | 14.3 | 53.2 |
| Total Bad Debt Expense | 260.4 | 293.5 | 363.8 | 293.6 |
| Total Loan Expenses | 905.1 | 1,017.4 | 1,153.7 | 1,001.7 |
| Net Operating Results | 451.8 | 480.3 | 602.2 | 528.9 |
| Alternative Payments to Non-Participating Provincesd | 91.3 | 113.9 | 117.9 | 111.0 |
| Final Net Operating Results | 543.1 | 594.2 | 720.1 | 639.9 |
| a. These costs are related to collection activities performed by the Canada
Revenue Agency. b. These costs are related to Canada Student Direct Loans but reported by the Department of Finance. c. This represents the annual expense against the Provisions for Bad Debt and Debt Reduction in Repayment as required under Accrual Accounting. d. The figures represent the annual expense recorded under the Accrual Accounting as opposed to the actual amount disbursed to the Non-Participating Provinces. For 2008-2009, the total amount disbursed as Alternative Payments is $127,2M. e. Actuals for 2007-2008 for Interest revenue on Direct Loans, In-Study Interest Borrowing Expense (Class A), In-Repayment Interest Borrowing Expense (Class B) and Bad Debt Expense have been adjusted following a revision of financial data. |
||||
Section IV
Other Items of Interest
4.1 Organizational Information
Human Resources and Skills Development Canada
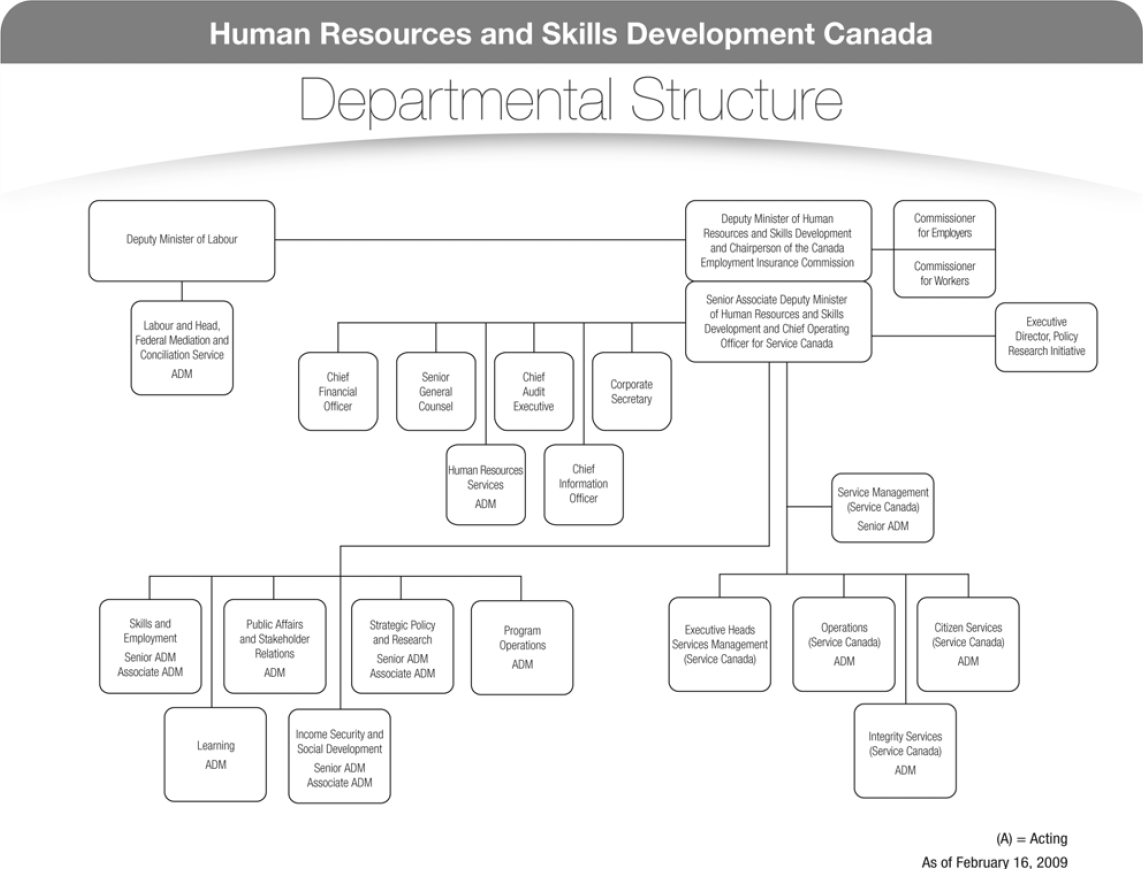
Text Description of Figure 4: Human Resources and Skills Development Canada Departmental Structure
4.2 Website References
HRSDC Website
www.hrsdc.gc.ca/en/home.shtml
The Honourable Diane Finley P.C., M.P.
Minister of Human Resources and Skills Development Canada
www.pm.gc.ca/eng/bio.asp?id=64
The Honourable Rona Ambrose P.C., M.P.
Minister of Labour
www.pm.gc.ca/eng/bio.asp?id=47
Acts and Regulations Governing HRSDC
and SC
http://laws.justice.gc.ca/en/showtdm/cs/H-5.7//20090918
HRSDC Internal Audit
http://www.hrsdc.gc.ca/eng/publications_resources/audit/date.shtml
HRSDC Evaluation
www.hrsdc.gc.ca/en/cs/sp/sdc/evaluation/page00.shtml
HRSDC Overview
List of HRSDC Programs and Services
www.hrsdc.gc.ca/en/gateways/nav/ top_nav/ps.shtml
Labour Market and Workplace Skills
Employment Insurance Benefits
http://www1.servicecanada.gc.ca/en/ei/menu/eihome.shtml
Labour Market Development Agreements
http://www1.servicecanada.gc.ca/eng/employment/partnerships/index.shtml
Aboriginal Human Resources Development Strategy
http://www8.hrsdc.gc.ca
Aboriginal Skills and Employment Partnerships
http://www8.hrsdc.gc.ca/general/public/asep-pcea/asep-pcea-eng.asp
Enabling fund for Official Language Minority Communities
http://www1.servicecanada.gc.ca/en/epb/olscc/fund.shtml
Labour Market Agreements
http://www1.servicecanada.gc.ca/eng/employment/partnerships/index.shtml
Labour Market Agreements for Persons with Disabilities
http://www.hrsdc.gc.ca/eng/disability_issues/labour_market_agreements/index.shtml
Opportunities Fund for Persons with Disabilities
http://www.hrsdc.gc.ca/en/disability_issues/funding_programs/opportunities_fund/index.shtml
Targeted Initiative for Older Workers
http://www.hrsdc.gc.ca/en/employment/employment_measures/older_workers/index.shtml
Youth Employment Strategy
http://www.youth.gc.ca
Sector Council Program
http://www.hrsdc.gc.ca/en/gateways/nav/top_nav/program/spi.shtml
Trades and Apprenticeship
http://www.hrsdc.gc.ca/en/workplaceskills/trades_apprenticeship/index.shtml
Apprenticeship Incentive Grant
http://www.hrsdc.gc.ca/eng/workplaceskills/trades_apprenticeship/AIG/index.shtml
Literacy and Essential Skills
http://www.hrsdc.gc.ca/en/workplaceskills/oles/olesindex_en.shtml
Innovations Initiatives
http://www.hrsdc.gc.ca/en/ws/initiatives/wsi/index.shtml
Inter-provincial Labour Mobility
http://www.hrsdc.gc.ca/en/workplaceskills/labour_mobility/index.shtml
Labour Market Information
http://www.hrsdc.gc.ca/en/gateways/nav/top_nav/program/lmi.shtml
Temporary Foreign Worker Program
http://www.hrsdc.gc.ca/en/workplaceskills/foreign_workers/index.shtml
Foreign Credential Recognition
http://www.hrsdc.gc.ca/en/workplaceskills/credential_recognition/index.shtml
Learning
Learning - CanLearn
http://www.canlearn.ca/eng/index.shtml
Canada Student Loans and Grants
http://www.hrsdc.gc.ca/eng/learning/canada_student_loan/index.shtml
Canada Education Savings Program
http://www.hrsdc.gc.ca/eng/learning/education_savings/index.shtml
International Academic Mobility Initiative
http://www.hrsdc.gc.ca/eng/learning/exchanges/index.shtml
Labour
Labour Program:
http://www.hrsdc.gc.ca/en/gateways/nav/top_nav/program/labour.shtml
Collective Bargaining:
http://www.hrsdc.gc.ca/en/gateways/business/cluster/category/cb.shtml
Federal Mediation and Conciliation Service:
http://www.hrsdc.gc.ca/en/labour/labour_relations/mediation/index.shtml
Federal Workers' Compensation:
http://www.hrsdc.gc.ca/en/labour/workers_compensation/index.shtml
Fire Protection Services:
http://www.hrsdc.gc.ca/en/labour/fire_protection/index.shtml
International Labour Affairs:
http://www.hrsdc.gc.ca/en/lp/ila/index.shtml
v
Labour Law Analysis:
http://www.hrsdc.gc.ca/en/labour/labour_law/index.shtml
Employment Standards:
http://www.hrsdc.gc.ca/en/labour/employment_standards/index.shtml
Occupational Health and Safety:
http://www.hrsdc.gc.ca/asp/gateway.asp?hr=en/lp/lo/ohs/overview/index-ohs.shtml&hs=oxs
Workplace Equity:
http://www.hrsdc.gc.ca/asp/gateway.asp?hr=en/lp/lo/lswe/we/information/overview.shtml&hs=wzp
Work-life Balance and the Ageing Workforce
http://www.hrsdc.gc.ca/en/gateways/topics/wnc-gxr.shtml
Income Security
Old Age Security Program (OAS) and Canada Pension Plan (CPP)
www.hrsdc.gc.ca/en/oas-cpp/index.shtml
Seniors
www.hrsdc.gc.ca/en/corporate/seniors/index.shtml
Registered Disability Savings Plan
www.hrsdc.gc.ca/eng/disability_issues/disability_savings/index.shtml
The National Child Benefit
www.nationalchildbenefit.ca
Social Development
Persons with Disabilities
http://www.hrsdc.gc.ca/eng/disability_issues/index.shtml
The Homelessness Partnering Strategy
www.hrsdc.gc.ca/eng/homelessness/index.shtml
The Social Development Partnerships Programs (SDPP)
www.hrsdc.gc.ca/eng/community_partnerships/sdpp/index.shtml
New Horizons for Seniors Program (NHSP)
www.hrsdc.gc.ca/en/community_partnerships/seniors/index.shtml
Canada's Universal Child Care Plan
www.universalchildcare.ca
Enabling Accessibility Fund
http://www.hrsdc.gc.ca/eng/disability_issues/eaf/call2009/index.shtml
Service Canada
http://www.servicecanada.gc.ca/
- See Education at a Glance 2008 and Education at a Glance 2004, www.oecd.org
- Based on Labour Force Survey results.
- A small percentage of the statutory Government Employees' Compensation Act cost related to pre-1998 claims is funded from the Employment Insurance Account.
- For further information, see http://www.tbs-sct.gc.ca/rpp/2008-2009/inst/csd/csdtb-eng.asp
- For further information, see http://www.tpsgc-pwgsc.gc.ca/recgen/txt/72-eng.html
- For further information, see http://www.hrsdc.gc.ca/en/ei/legislation/ei_act_tofprov_1.shtml
- For further information, see http://www.tpsgc-pwgsc.gc.ca/recgen/txt/index-eng.html.
- For further information, see http://www.tpsgc-pwgsc.gc.ca/recgen/txt/index-eng.html.
- For further information on the Canada Student Loans Program, see http:// www.hrsdc.gc.ca/en/gateways/topics/cxp-gxr.shtml
- An announcement was made on August 1, 2005 which transfers collections activities previously carried out by Social Development Canada (SDC) to Canada Revenue Agency.