
Common menu bar links
Breadcrumb Trail
ARCHIVED - Library and Archives Canada
 This page has been archived.
Archived Content
Information identified as archived on the Web is for reference, research or recordkeeping purposes. It has not been altered or updated after the date of archiving. Web pages that are archived on the Web are not subject to the Government of Canada Web Standards. As per the Communications Policy of the Government of Canada, you can request alternate formats on the "Contact Us" page.
Section III – Supplementary Information
Financial Highlights
The financial highlights presented with the Departmental Performance Report are intended to serve as a general overview of LAC's financial position and operations. Financial statements are prepared in accordance with accrual accounting principles. The unaudited supplementary information presented in the financial tables in other sections of this report was prepared on a modified cash basis of accounting in order to be consistent with appropriations-based reporting. The organization's financial statements for 2008-2009 can be found on LAC's website.
| Condensed Statement of Financial Position At End of Year (March 31, 2009) |
% Change | 2009 | 2008 |
|---|---|---|---|
| Assets | |||
| Total Assets | 9.6% | 39,503 | 36,050 |
| Total | 9.6% | 39,503 | 36,050 |
| Liabilities | |||
| Total Liabilities | 8.8% | 43,352 | 39,856 |
| Equity | |||
| Total Equity | 1.1% | (3,849) | (3,806) |
| Total | 9.6% | 39,503 | 36,050 |
| Condensed Statement of Financial Position At End of Year (March 31, 2009) |
% Change | 2009 | 2008 |
|---|---|---|---|
| Expenses | |||
| Total Expenses | 4.2% | 172,369 | 165,402 |
| Revenues | |||
| Total Revenues | 3.6% | 558 | 579 |
| Net Cost of Operations | 4.2% | 171,811 | 164,823 |
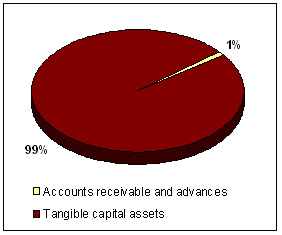
Total assets were $39.503 million at the end of 2008-09, as increase of $3.453 million (9.6 percent) versus last year's total assets. Capital assets continue to be the largest asset component, representing 99 percent of assets.
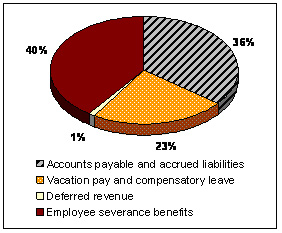
Total liabilities were $43.352 million at the end of 2008-09, an increase of $3.496 million (8.8 percent) versus last year's total liabilities. Employee severance benefits and accounts payable continue to be the largest components of liabilities.
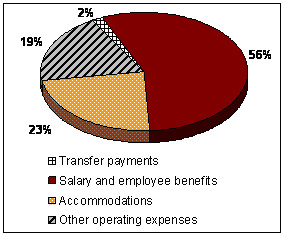
Total expenses were $172.369 million at the end of 2008-09, an increase of $6.967 million (4.2 percent) versus last year's total expenses. The major expense area is salary and employee benefits, which represents 56 percent of total expenses.
List of Supplementary Information Tables
- Sources of Respendable and Non-Respendable Revenue
- User Fees/External Fees
- Green Procurement
- Internal Audits and Evaluations
All electronic supplementary information tables found in the 2008-09 Departmental Performance Report can be found on the Treasury Board of Canada Secretariat's website at: http://www.tbs-sct.gc.ca//dpr-rmr/st-ts-eng.asp.