
Common menu bar links
Breadcrumb Trail
ARCHIVED - Public Safety Canada
 This page has been archived.
Archived Content
Information identified as archived on the Web is for reference, research or recordkeeping purposes. It has not been altered or updated after the date of archiving. Web pages that are archived on the Web are not subject to the Government of Canada Web Standards. As per the Communications Policy of the Government of Canada, you can request alternate formats on the "Contact Us" page.
Section III: Supplementary Information
Organizational Information
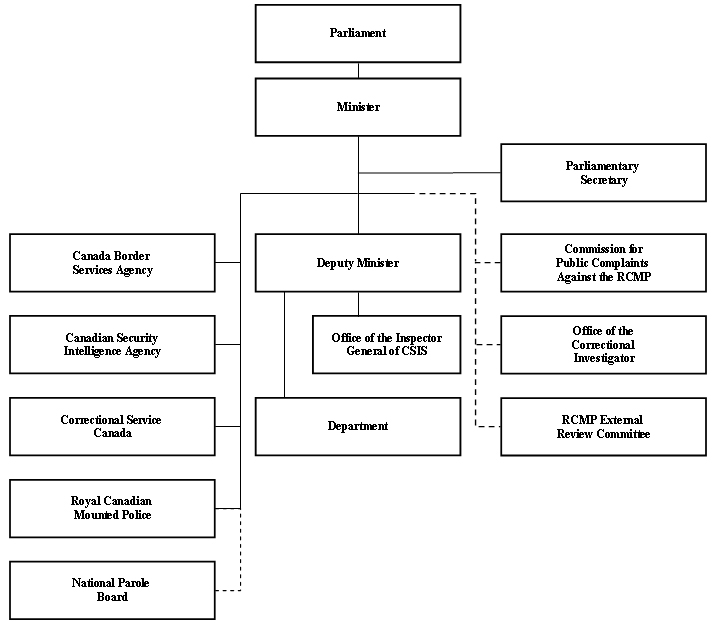
Table 1: Comparison of Planned to Actual Spending (including Full-time Equivalents)
|
Comparison of Planned to Actual Spending |
2004–2005 |
2005–2006 |
2006–2007 |
|||
|
Actual |
Actual |
Main Estimates |
Planned |
Total Authorities |
Actual |
|
|
Emergency Management and National Security |
154,300 |
184,872 |
234,981 |
267,013 |
244,782 |
108,918 |
|
Policing and Law Enforcement |
43,500 |
44,601 |
38,289 |
38,717 |
35,030 |
33,615 |
|
Community Safety and Partnerships |
167,500 |
140,249 |
184,822 |
192,375 |
187,719 |
157,920 |
|
Total |
365,300 |
369,722 |
458,092 |
498,105 |
467,531 |
300,453 |
|
Plus: Cost of services received without charge |
11,900 |
12,900 |
N/A |
12,955 |
N/A |
13,514 |
|
Total Departmental Spending |
377,200 |
382,622 |
458,092 |
511,060 |
467,531 |
313,967 |
|
|
|
|
|
|
|
|
|
Full-time Equivalents |
808 |
810 |
N/A |
999 |
870 |
825 |
The variance between the Main Estimates ($458M) and the Planned Spending ($498M) is mainly due to the funds approved from the fiscal framework for the departmental Core Emergency Management Capacity ($31M) and the creation of the Youth Gang Fund ($7.5M). Only a portion of the funding for these two initiatives was requested in the 2006-2007 Supplementary Estimates, which explains the variance between the planned spending and the total authorities.
Actual spending ($300.4M) is lower than the authorities by $167M due to the Disaster Financial Assistance Arrangement (DFAA) program ($128M), the review of grants and contributions of the National Crime Prevention Centre and of its strategic direction ($27M), and a lapse in the Department’s Operating Budget ($7M).
The decrease in the actual spending trend ($69M between 2005-2006 and 2006-2007) is also due to reduced claims under the Disaster Financial Assistant Arrangements contribution program and the reduction in transfer payments in support of the Safer Communities Initiative, which are offset by higher payments in 2006-2007 to RCMP for the First Nations Policing Program.
Table 2: Resources by Program Activity
|
2006-2007 Resources by Program Activity (in millions) |
||||
|
Program Activity |
Operating |
Grants |
Contributions |
Total |
|
|
|
|
|
|
|
Emergency Management and National Security |
||||
|
Main Estimates |
64,979 |
654 |
169,348 |
234,981 |
|
Planned Spending |
97,011 |
654 |
169,348 |
267,013 |
|
Total Authorities |
72,434 |
654 |
171,694 |
244,782 |
|
Actual Spending |
66,544 |
590 |
41,783 |
108,917 |
|
|
|
|
|
|
|
Policing and Law Enforcement |
||||
|
Main Estimates |
37,314 |
|
975 |
38,289 |
|
Planned Spending |
37,742 |
|
975 |
38,717 |
|
Total Authorities |
32,970 |
|
2,060 |
35,030 |
|
Actual Spending |
31,682 |
|
1,932 |
33,614 |
|
|
|
|
|
|
|
Community Safety and Partnerships |
||||
|
Main Estimates |
57,126 |
21,256 |
112,572 |
190,954 |
|
Planned Spending |
58,547 |
21,256 |
112,572 |
192,375 |
|
Total Authorities |
70,447 |
21,256 |
96,016 |
187,719 |
|
Actual Spending |
70,283 |
5,988 |
81,649 |
157,920 |
|
|
|
|
|
|
|
Total |
||||
|
Main Estimates |
159,419 |
21,910 |
282,895 |
464,224 |
|
Planned Spending |
193,300 |
21,910 |
282,895 |
498,105 |
|
Total Authorities |
175,851 |
21,910 |
269,770 |
467,531 |
|
Actual Spending |
168,509 |
6,579 |
125,365 |
300,451 |
Table 3: Voted and Statutory Items
|
2006-2007 Voted and Statutory Items (in millions) |
|||||
|
Vote or Statutory Item |
Vote or Statutory Wording |
Main Estimates |
Planned Spending |
Total Authorities |
Total Actuals |
|
Vote 1 |
Operating expenditures |
147,890 |
181,771 |
165,546 |
158,205 |
|
Vote 5 |
Grants and contributions |
298,673 |
304,805 |
291,680 |
131,944 |
|
Statutory |
Minister of PS - Salary and motor car allowance |
73 |
73 |
76 |
76 |
|
Statutory |
Contributions to employee benefit plans |
11,456 |
11,456 |
10,229 |
10,229 |
|
|
Total |
458,092 |
498,105 |
467,531 |
300,453 |
Vote 1 – Operating expenditures
It was expected that the Planned Spending in Vote 1 would increase by $34M from the Main Estimates mainly as a result of the funds identified in the fiscal framework to further the Core Emergency Management Capacity of the department ($32M). Due to the late approval of these funds only a portion ($10M) was requested in Public Safety Authority and an even lesser amount ($7M) was
spent.
Vote 5 – Grants and contributions
The variance ($160M) between the authorities to actual spending is mainly due to the reduced number of claims received under the DFAA contribution program and the review of grants and contributions of the NCPC and of its strategic directions.
Table 4: Services Received Without Charge
|
Services Received Without Charge |
2006–2007 Actual Spending (in millions) |
|
Accommodation provided by Public Works and Government Services Canada |
7,680 |
|
Contributions covering the employer’s share of employees’ insurance premiums and expenditures paid by the Treasury Board of Canada Secretariat (excluding revolving funds) |
4,907 |
|
Worker’s compensation coverage provided by Human Resources and social Development Canada |
8 |
|
Salary and associated expenditures of legal services provided by the Department of Justice Canada |
918 |
|
Total 2006–07 Services received without charge |
13,513 |
Table 5: Resource Requirements by Branch
|
2006-2007 Resource Requirements by Branch (in millions) |
||||
|
|
Emergency Management and National Security |
Policing, Law Enforcement and Interoperability |
Community Safety and Partnerships |
Total |
|
|
|
|
|
|
|
Emergency Management and National Security |
||||
|
Planned Spending |
245,272 |
|
|
245,272 |
|
Actual Spending |
80,254 |
|
|
80,254 |
|
IG-CSIS |
|
|
|
|
|
Planned Spending |
1,040 |
|
|
1,040 |
|
Actual Spending |
1,206 |
|
|
1,206 |
|
|
|
|
|
|
|
Policing and Law Enforcement |
||||
|
Planned Spending |
|
31,537 |
|
31,537 |
|
Actual Spending |
|
25,378 |
|
25,378 |
|
|
||||
|
Community Safety and Partnerships |
||||
|
Planned Spending |
|
|
177,185 |
177,185 |
|
Actual Spending |
|
|
138,700 |
138,700 |
|
|
|
|
|
|
|
Corporate Management |
||||
|
Planned Spending |
9,844 |
3,555 |
7,317 |
20,716 |
|
Actual Spending |
16,646 |
4,994 |
11,652 |
33,292 |
|
|
|
|
|
|
|
Strategic Policy |
||||
|
Planned Spending |
4,754 |
1,908 |
3,857 |
10,519 |
|
Actual Spending |
4,006 |
1,202 |
2,804 |
8,012 |
|
|
|
|
|
|
|
Communications |
||||
|
Planned Spending |
4,234 |
1,155 |
2,708 |
8,097 |
|
Actual Spending |
4,892 |
1,468 |
3,425 |
9,785 |
|
|
|
|
|
|
|
Executive |
||||
|
Planned Spending |
1,869 |
562 |
1,308 |
3,739 |
|
Actual Spending |
1,913 |
574 |
1,339 |
3,826 |
|
|
|
|
|
|
|
Total Planned Spending |
267,013 |
38,717 |
192,375 |
498,105 |
|
Total Actual Spending |
108,918 |
33,615 |
157,920 |
300,453 |
The Emergency Management and National Security Branch decrease of $165 million between planned and actual spending is mostly due to the capacity of the Department to spend the money earmarked for the Core Emergency Management Capacity initiatives in a very short period of time and the Disaster Financial Assistance Arrangements (DFAA) program for which the amount of claims received was less than expected.
Under the Community Safety and Partnerships Branch, the $40 million decrease between planned and actual spending is largely due to the review of grants and contributions of the NCPC and of its strategic direction.
The Corporate Management increase of $13M between planned and actual spending is mainly due to the funds approved under the Core Emergency Management Capacity Initiative for Corporate support services and other departmental priority initiatives, such as the cost of relocating the Department’s Headquarters, for which funds were reallocated internally.
Table 6A: User Fees Act
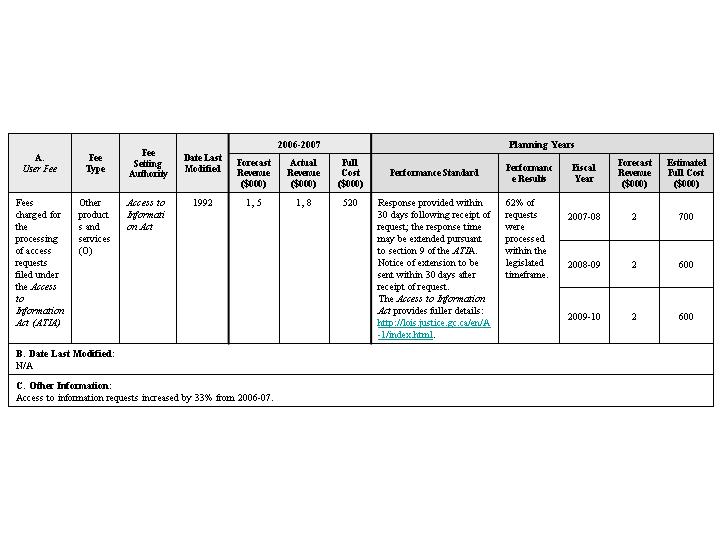
Table 6B: User Fees Act
A. External Fee |
Service Standard |
Performance Result |
Stakeholder Consultation |
|
Fees charged for the processing of access requests filed under the Access to Information Act (ATIA) |
Response provided within 30 days following receipt of request; the response time may be extended pursuant to section 9 of the ATIA. Notice of extension to be sent within 30 days after receipt of request. |
62 per cent of the requests were processed within the 30 day legislated time limit |
The service standard is established by the Access to Information Act and the Access to Information Regulations. Consultations with stakeholders were undertaken by the Department of Justice and the Treasury Board Secretariat for amendments done in 1986 and 1992. |
|
|
|||
Table 7: Details on Transfer Payments Programs
|
($ 000s) |
Actual Spending 2004-2005 |
Actual Spending 2005-2006 |
Planned Spending |
Total Authorities 2006-2007 |
Actual Spending 2006-2007 |
Variance (planned spending vs. actual) |
|
|
|
|
|
|
|
|
|
|
|
Grants |
|||||||
|
Emergency Management and National Security |
|||||||
|
|
Joint infrastructure interdependencies research program |
500 |
500 |
500 |
500 |
494 |
6 |
|
|
Public Safety and Emergency Preparedness research fellowship program |
54 |
144 |
154 |
154 |
96 |
58 |
|
|
Sub-total |
554 |
644 |
654 |
654 |
591 |
64 |
|
|
|
|
|
|
|
|
|
|
Community Safety and Partnership |
|||||||
|
|
John Howard Society |
510 |
510 |
510 |
510 |
510 |
- |
|
|
Canadian Association of Elizabeth Fry societies |
452 |
452 |
452 |
452 |
452 |
- |
|
|
Other national voluntary organizations activities in the criminal justice sector |
835 |
835 |
835 |
835 |
788 |
47 |
|
|
Grants in support of the Safer Communities Initiative |
35,344 |
18,825 |
19,460 |
19,460 |
4,239 |
15,221 |
|
|
Sub-total |
37,140 |
20,621 |
21.256 |
21,256 |
5,989 |
15,268 |
|
|
|
|
|
|
|
|
|
|
|
Total Grants |
37,694 |
21,266 |
21,910 |
21,910 |
6,579 |
15,331 |
|
|
|
|
|
|
|
|
|
|
Contributions |
|||||||
|
Emergency Management and National Security |
|||||||
|
|
Payments to the provinces, territories, public and private bodies in support of activities complementary to those of the Minister |
194 |
185 |
652 |
877 |
263 |
389 |
|
|
Contribution to provinces and municipalities Pursuant to Emergency Preparedness Act |
7,725 |
8,342 |
8,471 |
8,471 |
8,149 |
322 |
|
|
Support for the construction of memorials to the victims of Air India Bombing |
|
|
|
350 |
300 |
(300) |
|
|
Financial assistance to the provinces of Quebec and Ontario for the repatriation of Canadians from Lebanon |
|
|
|
1,996 |
1,392 |
(1,392) |
|
|
Contribution to provinces of Assistance Related to Natural Disasters |
100,057 |
125,348 |
160,000 |
160,000 |
31,679 |
128,321 |
|
|
Sub-total |
107,977 |
133,875 |
169,123 |
171,694 |
41,783 |
127,340 |
|
|
|
|
|
|
|
|
|
|
Policing, Law Enforcement and Interoperability |
|||||||
|
|
Payments to the provinces, territories, public and private bodies in support of activities complementary to those of the Minister |
2,217 |
2,043 |
975 |
1,110 |
982 |
(7) |
|
|
Payments to the provinces, territories, municipalities Indian band council and recognized authorities representing Indian communities for the First Nations Policing Program. |
|
|
951 |
950 |
950 |
1 |
|
|
Sub-total |
2,217 |
2,043 |
1,926 |
2,060 |
1,932 |
(6) |
|
|
|
|
|
|
|
|
|
|
Community Safety and Partnerships |
|||||||
|
|
Payments to the provinces, territories, municipalities Indian band council and recognized authorities representing Indian communities for the First Nations Policing Program. |
62,883 |
67,007 |
77,006 |
68,632 |
65,097 |
11,909 |
|
|
Contributions in support of the safer Communities Initiative |
9,832 |
11,530 |
27,983 |
23,625 |
15,804 |
12,179 |
|
|
Funding for the prevention of youth involvement in gangs |
|
|
6.132 |
2,832 |
|
6,132 |
|
|
Payments to the provinces, territories, public and private bodies in support of activities complementary to those of the Minister |
387 |
922 |
725 |
927 |
749 |
(24) |
|
|
Sub-total |
73,103 |
79,459 |
111,846 |
96,016 |
81,649 |
30,196 |
|
|
|
|
|
|
|
|
|
|
|
Total contributions |
183,296 |
215,377 |
282,895 |
269,770 |
125,365 |
157,530 |
|
|
|
|
|
|
|
|
|
|
Total grants and contributions |
220,991 |
236,642 |
304,805 |
291,680 |
131,944 |
172,861 |
|
The variance of $172.9M between Planned and Actual Spending in the Transfer Payments Programs is mainly due to:
- The reduction in the amounts of claims received under the DFAA contribution program;
- The review of grants and contributions of the NCPC and of its strategic direction; and
- The transfer to Vote 1 (operating expenditures) for payments under the First Nations Policing Program.
Note: further information on these transfer payment programs can be found at http://www.tbs-sct.gc.ca/est-pre/estime.asp
Table 8: Sustainable Development Strategy
|
Public Safety Canada |
|
In the Report on Plans and Priorities for 2006-2007, the Department committed to assessing the previous 2003-2006 Sustainable Development Strategy (SDS) and developing a new three year Strategy. The new SDS will incorporate lessons learned from the previous period’s sustainable development strategy and focus on the Department’s capacity to incorporate sustainable development into its programs and activities. A commitment to developing an integrated approach to planning and decision-making, sensitive to sustainable development goals and results, was a key element of the Department’s plans. A new Sustainable Development Strategy (SDS) was developed for the Department and covers the period of 2007-2009, thus aligning the Department to the same three year planning cycle as other departments. The Strategy includes a broader focus on activities that strengthen PS’s role in supporting the sustainability of communities, such as Emergency Management activities, and programs associated with the National Crime Prevention Strategy. For green operations, the Department will continue to focus on training, awareness, waste, and greenhouse gas reduction, and activities where it can achieve the greatest positive environmental impact. Access to department-wide planning and policy governance fora, and the allocation of modest dedicated resources to the implementation of the SDS, will help ensure that challenges in collecting performance data, maintaining on-going communications and focus, and developing useful internal progress reporting, are addressed and support the culture change sought as a longer-term objective. |