
Common menu bar links
Breadcrumb Trail
ARCHIVED - Infrastructure Canada
 This page has been archived.
Archived Content
Information identified as archived on the Web is for reference, research or recordkeeping purposes. It has not been altered or updated after the date of archiving. Web pages that are archived on the Web are not subject to the Government of Canada Web Standards. As per the Communications Policy of the Government of Canada, you can request alternate formats on the "Contact Us" page.
Section III: Supplementary Information
3.1 Organizational Information
The Honourable Lawrence Cannon is the Minister responsible for the Transport, Infrastructure and Communities portfolio.7
Infrastructure Canada is headed by a Deputy Head, Louis Ranger, who reports to the Minister. The Deputy Head was supported in 2006-2007 by five Assistant Deputy Ministers and a Departmental Senior Counsel:
- Senior Assistant Deputy Minister, Policy and Communication: John Forster
- Assistant Deputy Minister, Cities and Communities: Yazmine Laroche
- Assistant Deputy Minister, Program Operations: Carol Beal
- Assistant Deputy Minister, Corporate Services/Chief Financial Officer: David Cluff
- Assistant Deputy Minister, Regional Integration: Gary Webster
- Departmental Senior Counsel: Richard Ouellet
Infrastructure Canada’s organizational structure is presented in Figure 3A.
Figure 3A: Infrastructure Canada Organization Chart (March 31, 2007)
Departmental Partners
Infrastructure Canada collaborates with other federal departments and agencies to deliver its infrastructure programs; e.g., Indian and Northern Affairs Canada works with Infrastructure Canada to implement projects in the territories and those that involve First Nations in the provinces. Infrastructure Canada also works closely with Western Economic Diversification Canada, Industry Canada, Canada Economic Development for Quebec Regions, the Atlantic Canada Opportunities Agency and Transport Canada. Other federal partners include Environment Canada, Canada Mortgage and Housing Corporation and Public Works and Government Services Canada.
These departments and agencies share their knowledge of local needs and priorities, as well as their technical expertise, resources and governance structures and are critical to Infrastructure Canada’s ability to fulfill its mandate. For transport-related projects from the Canada Strategic Infrastructure Fund and the Border Infrastructure Fund, Transport Canada provides the federal lead role while Infrastructure Canada provides a supportive role.
In addition to federal partners, Infrastructure Canada collaborates with provincial, territorial and municipal governments and associations, as well as universities, research institutes, civil society organizations, the private sector and other experts. This collaboration is intended to:
- Generate new, horizontal insights into infrastructure and place-based issues;
- Develop a stronger, more multi-disciplinary research community that can provide support for policy and decision makers in the multiple sectors involved in addressing Canada’s infrastructure needs; and
- Gather, disseminate and communicate knowledge about infrastructure from and to key partners.
7 On February 6, 2006, Infrastructure Canada became part of the Transport, Infrastructure, and Communities Portfolio under the responsibility of the Minister of Transport, Infrastructure and Communities.
3.2 Supplementary Tables
Table 3.1: Comparison of Planned to Actual Spending (including Full-time Equivalents)
|
($ thousands) |
2004-2005 |
2005-2006 |
2006-2007 |
|||
|---|---|---|---|---|---|---|
|
Mai |
Planned |
Total |
Actual |
|||
|
Infrastructure Investments (Revised PAA) |
|
|
0 |
2,448,418 |
2,109,215 |
1,455,063 |
|
Policy, Knowledge and Partnership Development (Revised PAA) |
|
|
0 |
17,401 |
18,428 |
13,773 |
|
Infrastructure and Communities (Previous PAA) |
227,901 |
1,503,085 |
1,824,127 |
0 |
0 |
0 |
|
Crown Corporations Portfolio Management (Previous PAA) |
22,468 |
24,251 |
22,989 |
2,492 |
0 |
0 |
|
Total |
250,369 |
1,527,336 |
1,847,116 |
2,468,311 |
2,127,643 |
1,468,836 |
|
Plus: Cost of services received without charge |
0 |
2,440 |
|
1,967 |
|
2,298 |
|
Total Departmental Spending |
250,369 |
1,529,776 |
1,847,116 |
2,470,278 |
2,127,643 |
1,471,134 |
|
Full Time Equivalents |
179 |
180 |
|
220 |
|
184 |
Explanatory Notes:
- The variance between total authorities and actual spending in 2006-2007 is due mainly to two factors:
- finalization of contribution agreements for programs such as CSIF and BIF took longer than originally anticipated, therefore delaying the initiation of reimbursement of project claims to recipients;
- reduced cash requirements by recipients for the current year, based on cash flow projections for MRIF, BIF and CSIF.
- finalization of contribution agreements for programs such as CSIF and BIF took longer than originally anticipated, therefore delaying the initiation of reimbursement of project claims to recipients;
- All lapsed contribution funding in 2006-2007 will be carried forward to future years to align with recipient cash flow requirements.
Table 3.2: Use of Resources by Program Activities ($ thousands)
|
2006-2007 |
|||||
|
Program Activity – PA |
Budgetary |
Plus: Non-Budgetary |
Total |
||
|---|---|---|---|---|---|
|
Operating |
Grants and Contributions |
Total Budgetary |
Loans, Investments and Advance |
||
|
Infrastructure Investments (Revised PAA) |
|||||
|
Main Estimates |
|
|
0 |
0 |
0 |
|
Planned Spending |
27,943 |
2,420,475 |
2,448,418 |
0 |
2,448,418 |
|
Total Authorities |
29,166 |
2,080,049 |
2,109,215 |
0 |
2,109,215 |
|
Actual Spending |
25,903 |
1,429,160 |
1,455,063 |
0 |
1,455,063 |
|
Policy, Knowledge and Partnership Development (Revised PAA) |
|||||
|
Main Estimates |
|
|
0 |
0 |
0 |
|
Planned Spending |
12,196 |
5,205 |
17,401 |
0 |
17,401 |
|
Total Authorities |
13,271 |
5,157 |
18,428 |
0 |
18,428 |
|
Actual Spending |
9,142 |
4,631 |
13,773 |
0 |
13,773 |
|
Infrastructure and Communities (Previous PAA) |
|||||
|
Main Estimates |
36,958 |
1,787,169 |
1,824,127 |
0 |
1,824,127 |
|
Planned Spending |
0 |
0 |
0 |
0 |
0 |
|
Total Authorities |
0 |
0 |
0 |
0 |
0 |
|
Actual Spending |
0 |
0 |
0 |
0 |
0 |
|
Crown Corporations Portfolio Management (Previous PAA) |
|||||
|
Main Estimates |
20,497 |
0 |
20,497 |
2,492 |
22,989 |
|
Planned Spending |
0 |
0 |
0 |
2,492 |
2,492 |
|
Total Authorities |
0 |
0 |
0 |
0 |
0 |
|
Actual Spending |
0 |
0 |
0 |
0 |
0 |
|
Total Department |
|||||
|
Main Estimates |
57,455 |
1,787,169 |
1,844,624 |
2,492 |
1,847,116 |
|
Planned Spending |
40,139 |
2,425,680 |
2,465,819 |
2,492 |
2,468,311 |
|
Total Authorities |
42,437 |
2,085,206 |
2,127,643 |
0 |
2,127,643 |
|
Actual Spending |
35,044 |
1,433,792 |
1,468,836 |
0 |
1,468,836 |
Explanatory Notes:
- This table shows the realignment of the former Program Activity Architecture, as printed in the Main Estimates 2006-2007, to the new PAA, as printed in the Public Accounts for 2006-2007. This includes the impact of the transfer out of the Crown Corporation Portfolio Management to Transport Canada, and the creation of two new activities from the former Infrastructure and
Communities activity to better report on results.
- The variance between total authorities and actual spending is explained in Table 3.1 and is mostly attributable to the signing of contribution agreements later than originally anticipated, and cash flow adjustments requested by recipients.
Table 3.3: Voted and Statutory Items ($ thousands)
|
Vote or Statutory Item |
Truncated Vote or Statutory Wording |
2006-2007 |
|||
|---|---|---|---|---|---|
|
Main Estimates |
Planned Spending |
Total Authorities |
Actual |
||
|
55 |
Operating expenditures |
37,103 |
38,778 |
39,987 |
32,593 |
|
60 |
Contributions |
1,787,169 |
2,406,680 |
2,066,093 |
1,414,680 |
|
65 |
Payments to Old Port of Montreal Corporation Inc. |
18,800 |
0 |
0 |
0 |
|
L70 |
Payments to Queens Quay West Land Corporation |
2,492 |
2,492 |
0 |
0 |
|
(S) |
Payments to the Public Transit Fund |
|
19,000 |
19,112 |
19,112 |
|
(S) |
Contributions to Employee Benefit Plans |
1,552 |
1,361 |
2,451 |
2,451 |
|
|
Total Department |
1,847,116 |
2,468,311 |
2,127,643 |
1,468,836 |
Explanatory Notes:
- The lapse in Vote 55 – Operating budget is attributable partly to reduced salary spending reflecting a higher number of staff vacancies than anticipated, and reduced spending requirements following the transfer of the department to the Transport, Infrastructure and Communities portfolio, resulting in savings in the operations of a Minister’s Office and a Deputy
Head’s Office. The lower spending is also related to the slowdown in spending on the contribution management system
(SIMSI) due to the need to get the appropriate authorization and then the appropriate contract in place.
- The lapse in Vote 60 – Contributions is explained in the narrative for Table 3.1 and 3.2.
- Variances in Planned Spending compared to Actual Spending for Vote 65 and Vote L70 reflect the transfer of these Crown corporations to Transport Canada in 2006-2007.
Table 3.4: Services Received Without Charge ($ thousands)
|
|
2006‑2007 |
|---|---|
|
Accommodation provided by Public Works and Government Services Canada (PWGSC) |
1,122 |
|
Contributions covering employers’ share of employees’ insurance premiums and expenditures paid by TBS (excluding revolving funds) |
1,176 |
|
Total 2006-2007 Services received without charge |
2,298 |
Table 3.5: Details on Transfer Payment Programs (TPPs)
Infrastructure Canada managed the following Transfer Payment Programs in excess of $5 million:
- Contributions under the Canada Strategic Infrastructure Fund;
- Contributions under the Border Infrastructure Fund;
- Contributions under the Municipal Rural Infrastructure Fund;
- Transfer Payments under the Gas Tax Fund; and
- Contributions under the Public Transit Fund.
For further information on the above-mentioned transfer payment programs see: http://www.tbs-sct.gc.ca/dpr-rmr/0607/info/tpp-ppt_e.asp.
Table 3.6: Reporting on Horizontal Initiatives
The objective of reporting on Horizontal Initiatives is to provide Parliamentarians, the public and the government with an overall picture of public expenditures, plans, priorities and achievements for all major horizontal initiatives.
A Horizontal Initiative is an initiative in which partners from two or more organizations have agreed, under a formal funding agreement, to work towards the achievement of shared outcomes. Over the last year, Infrastructure Canada led in four horizontal initiatives; i.e., Canada Strategic Infrastructure Fund, Border Infrastructure Fund, Municipal Rural Infrastructure Fund and Peer Reviewed Research Studies and coordinated one horizontal initiative; i.e., Infrastructure Canada Program.
Supplementary information on the above-mentioned Horizontal Initiatives can be found at http://www.tbs-sct.gc.ca/rma/eppi-ibdrp/hrdb-rhbd/profil_e.asp.
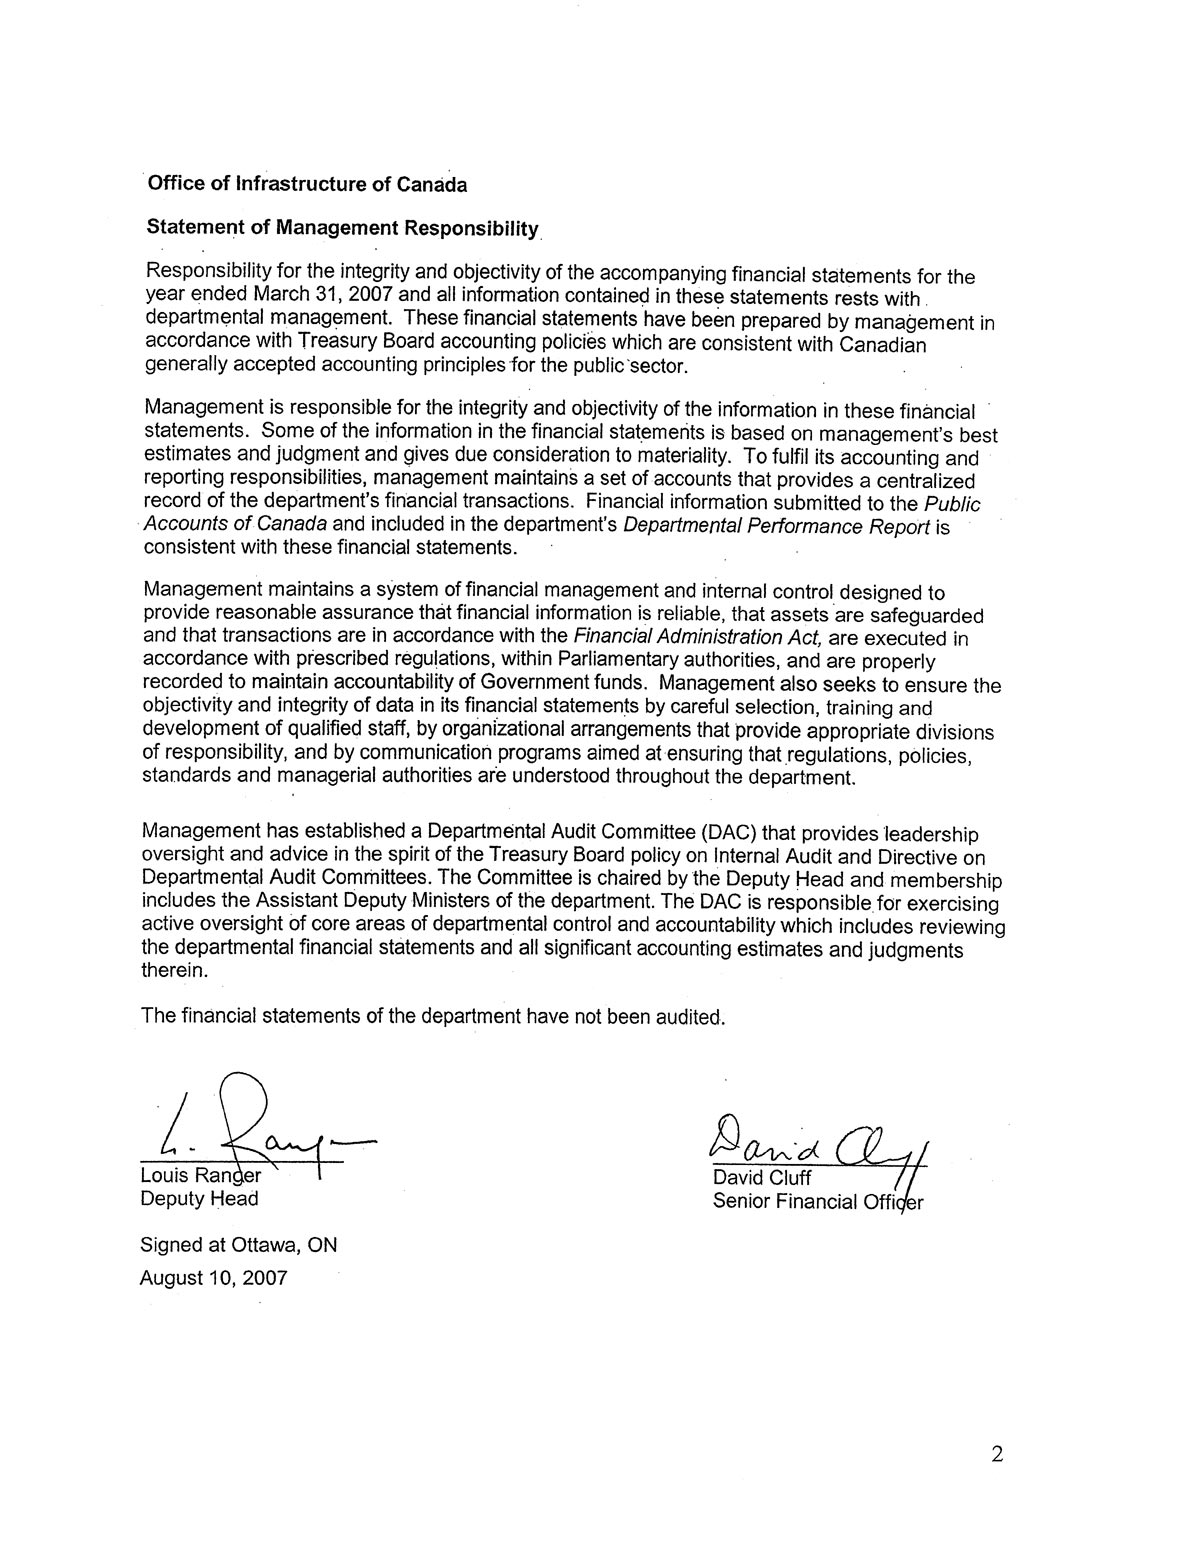
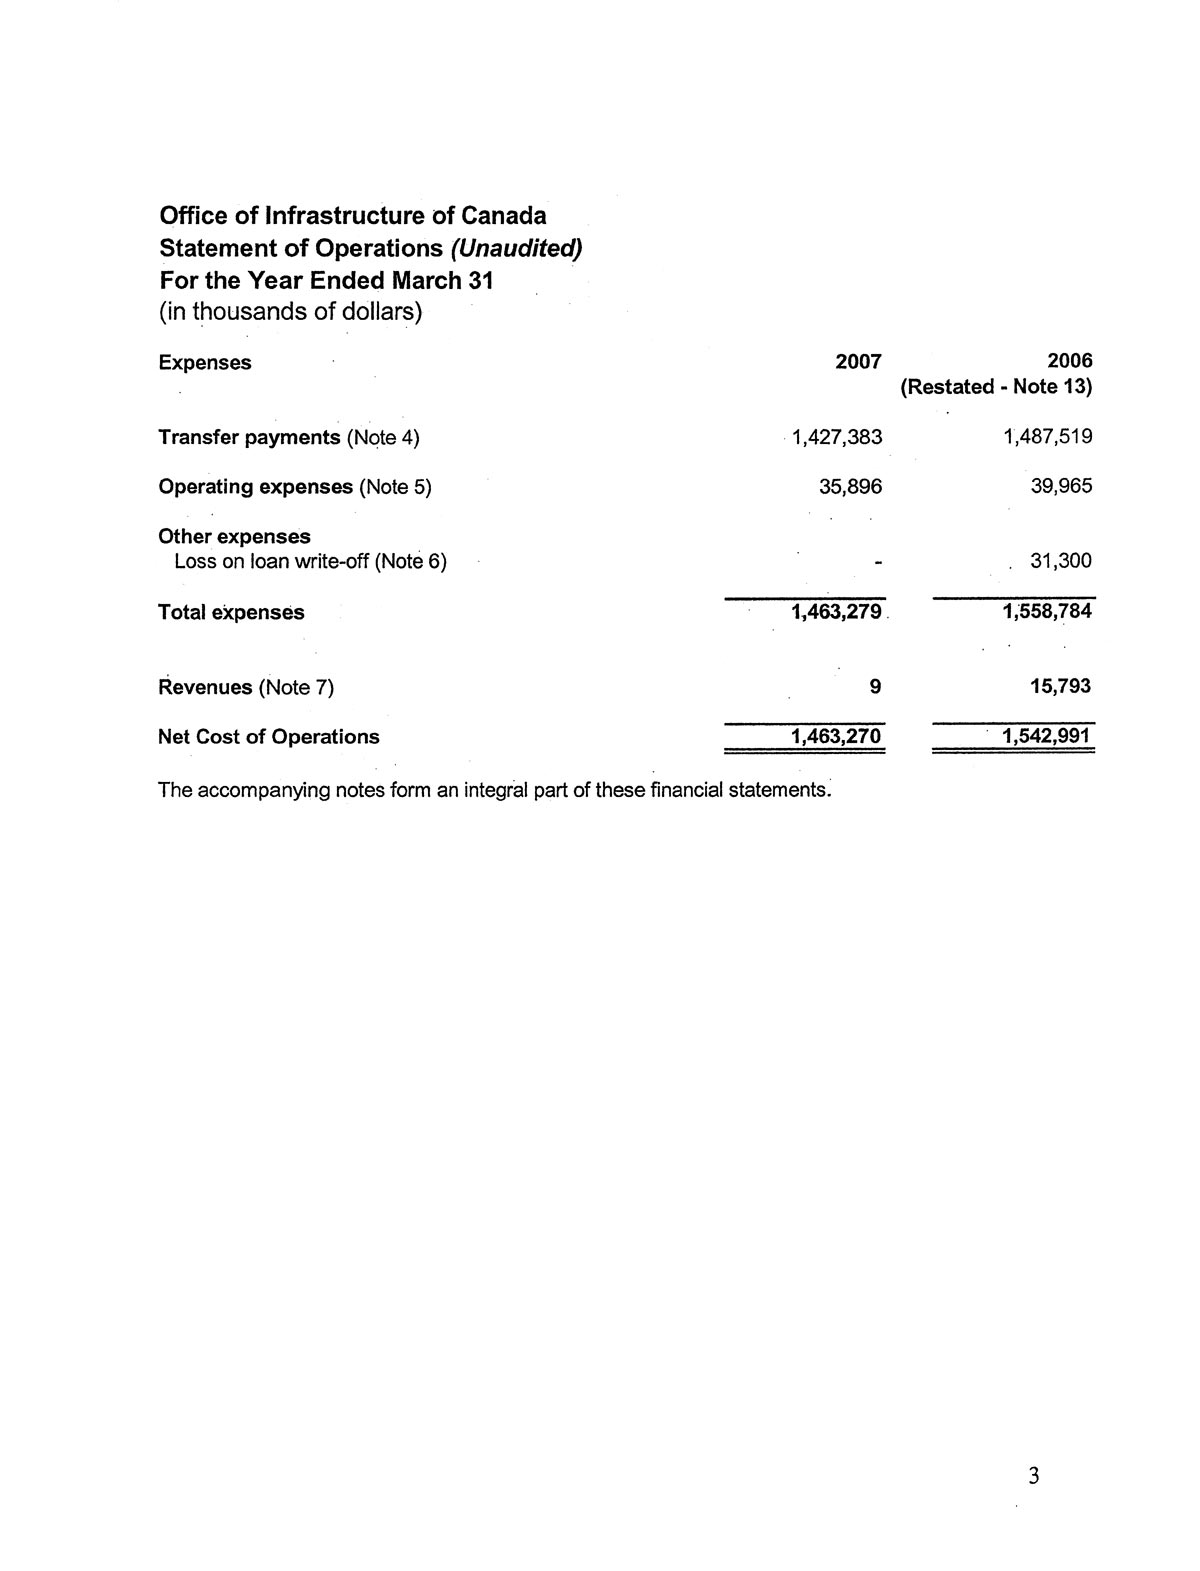
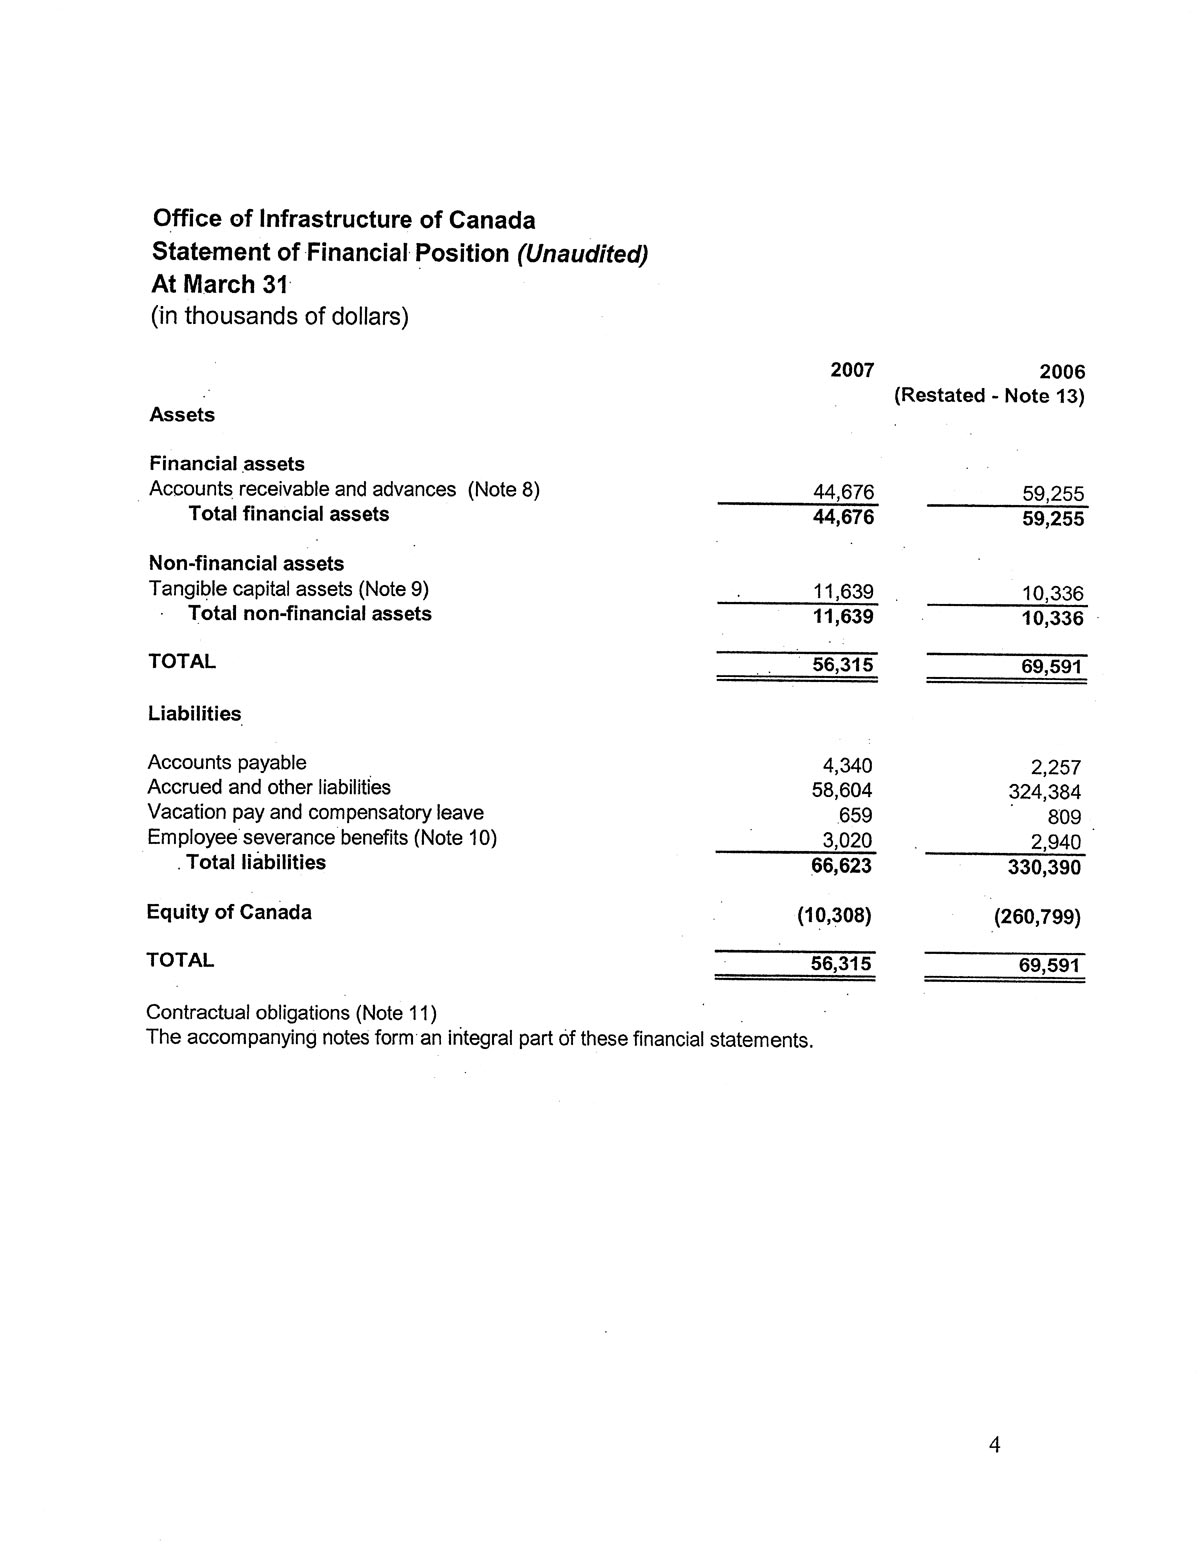
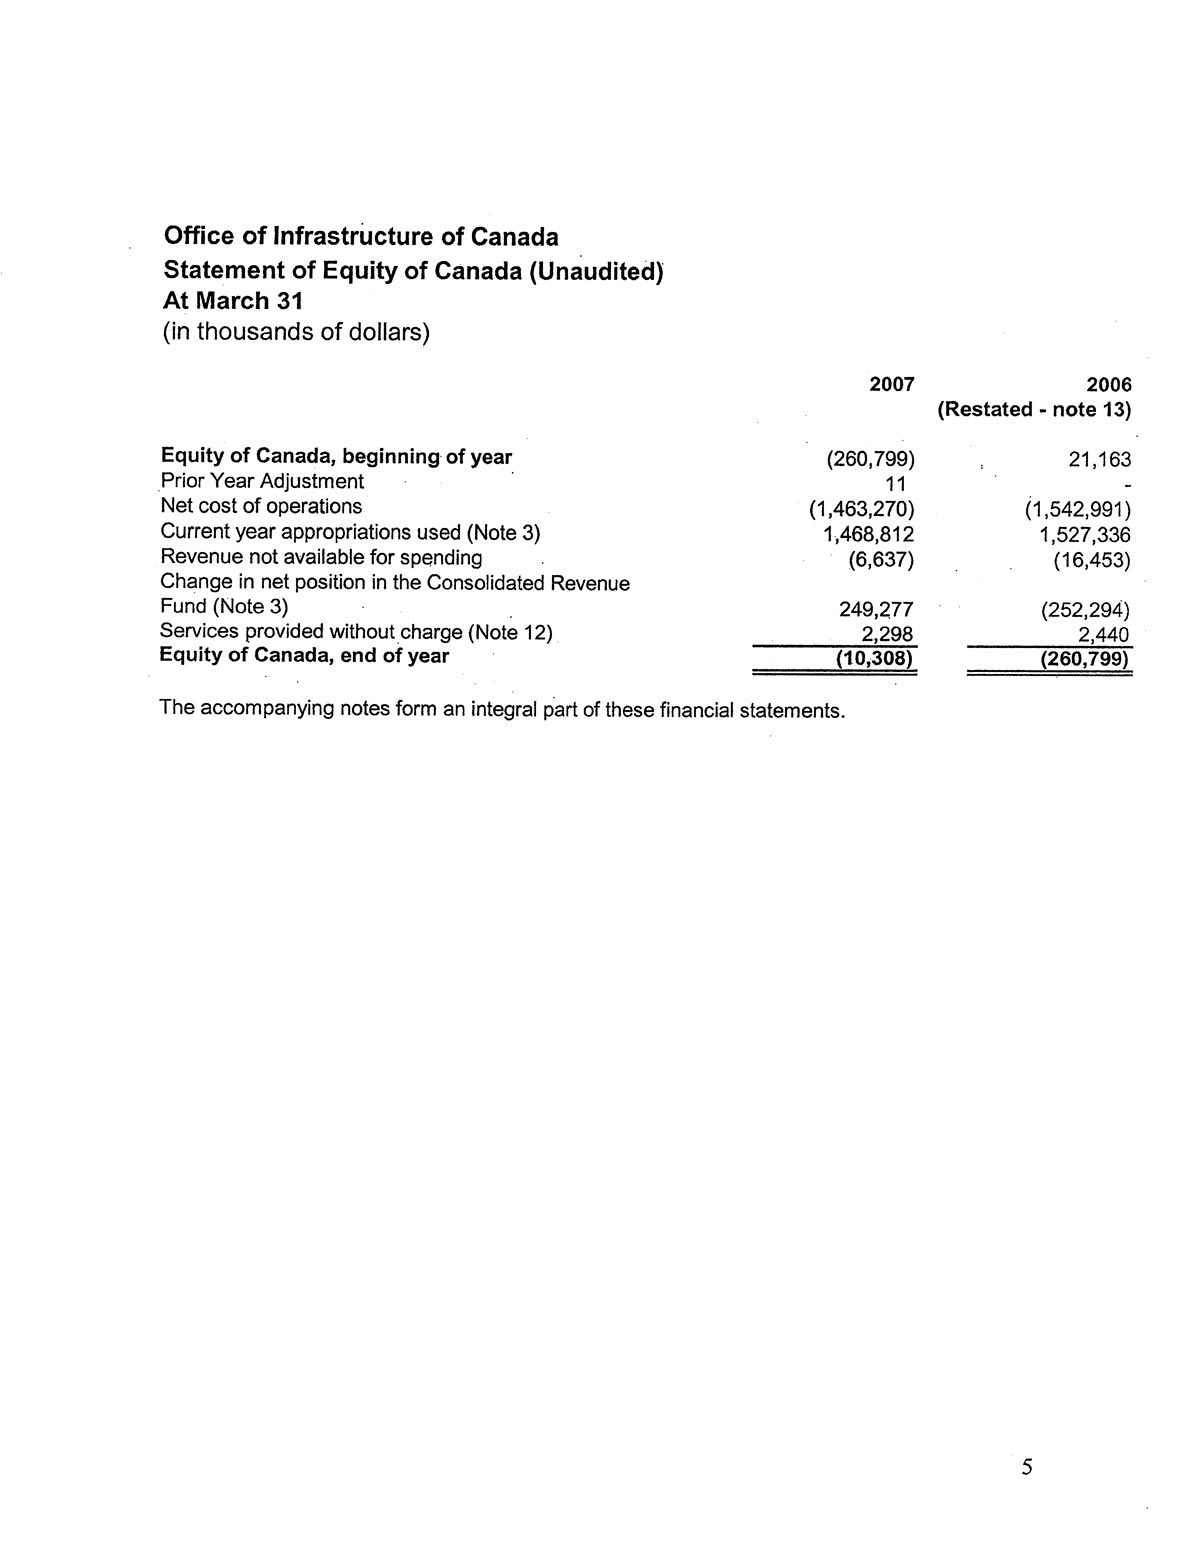
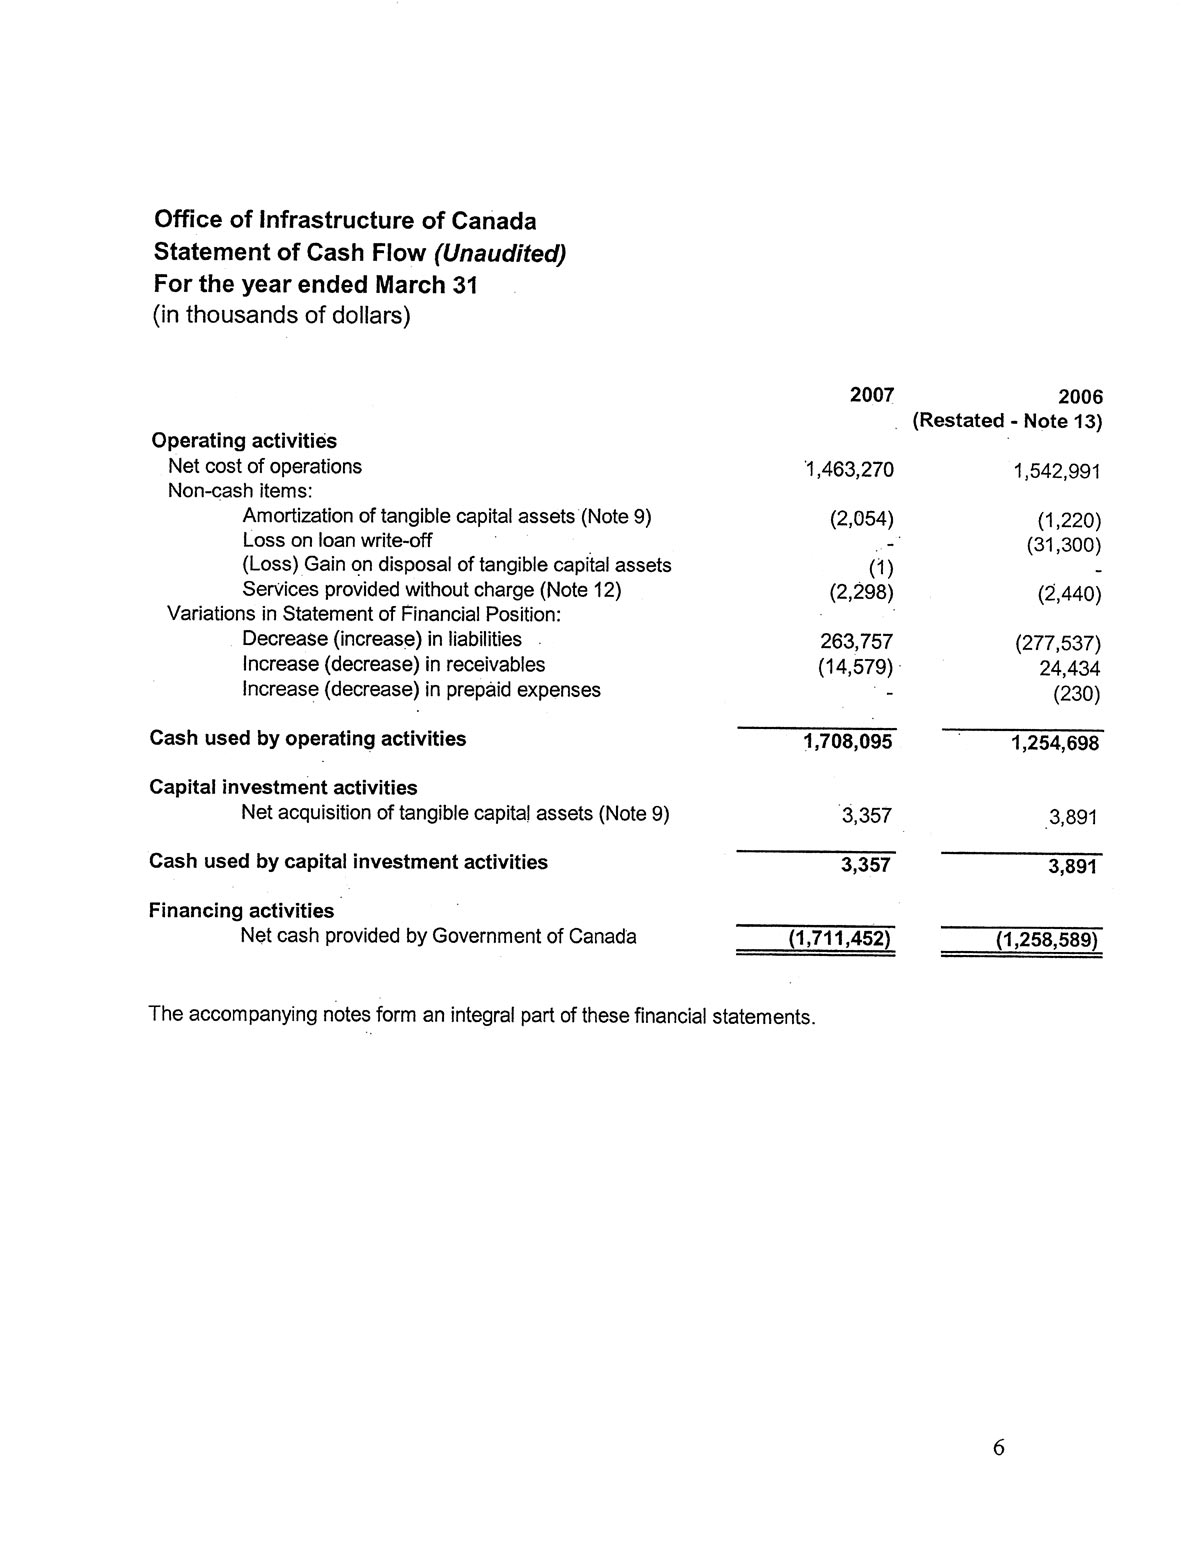
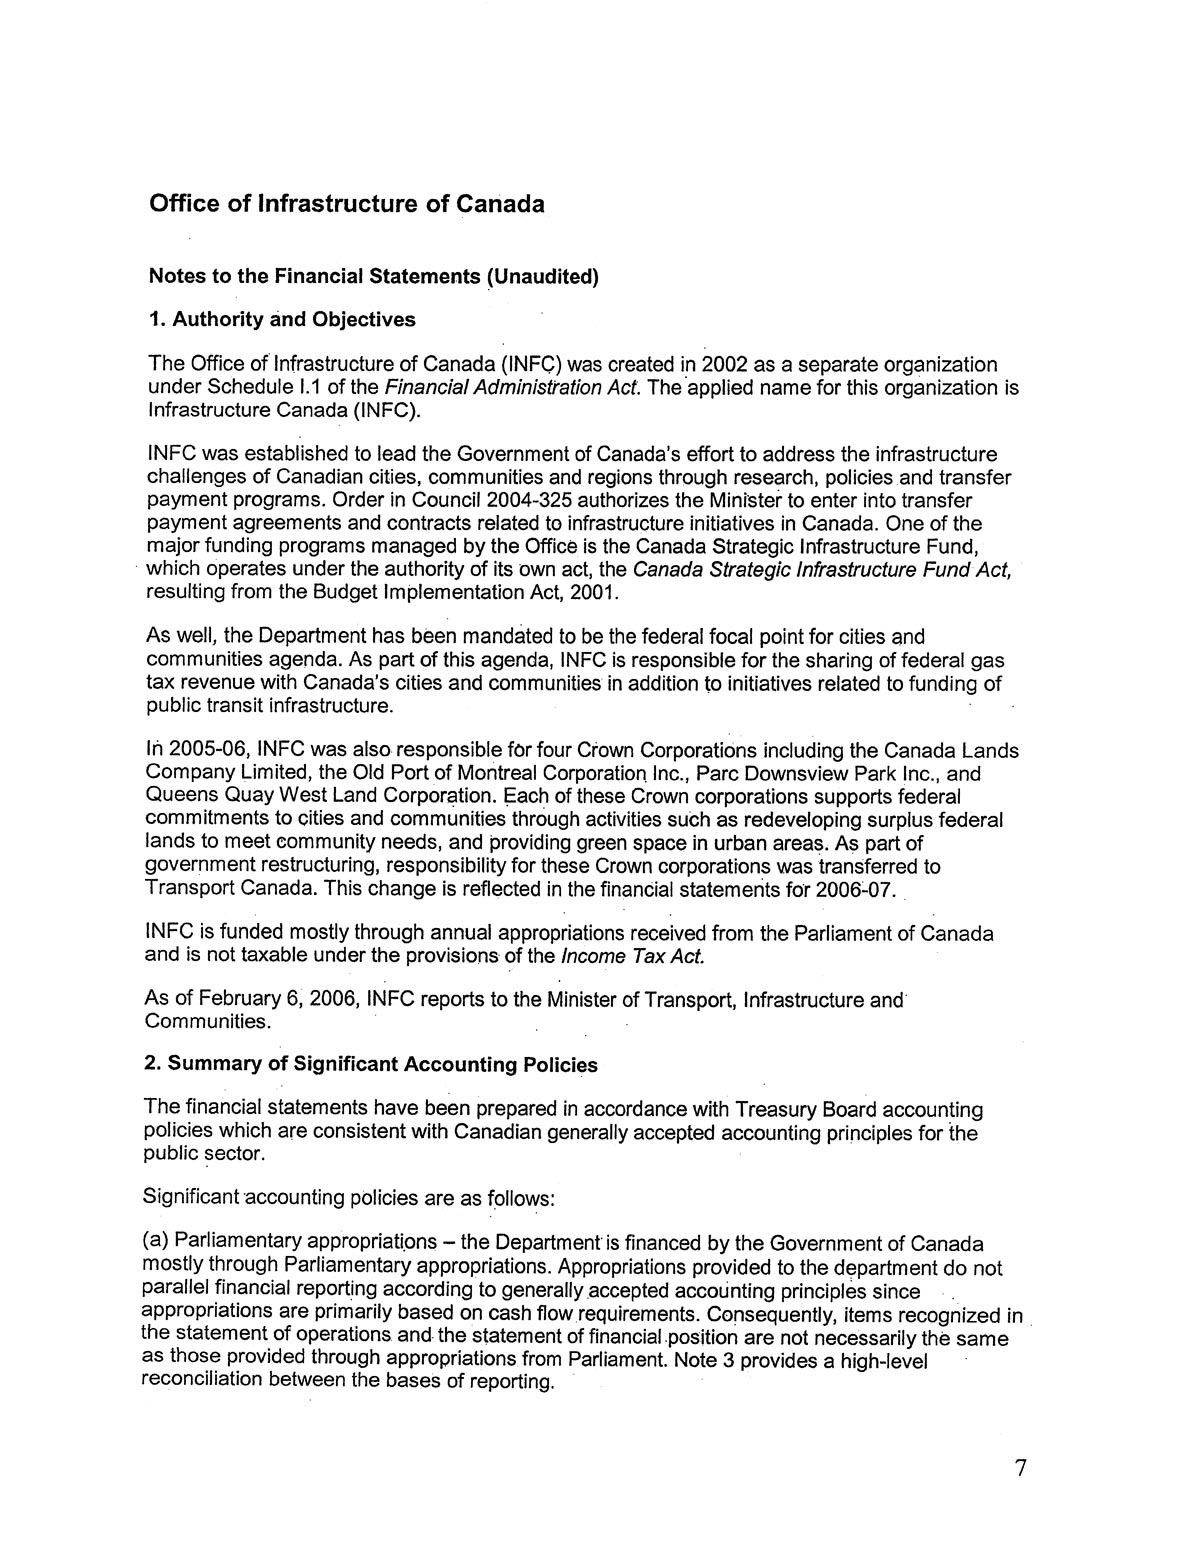
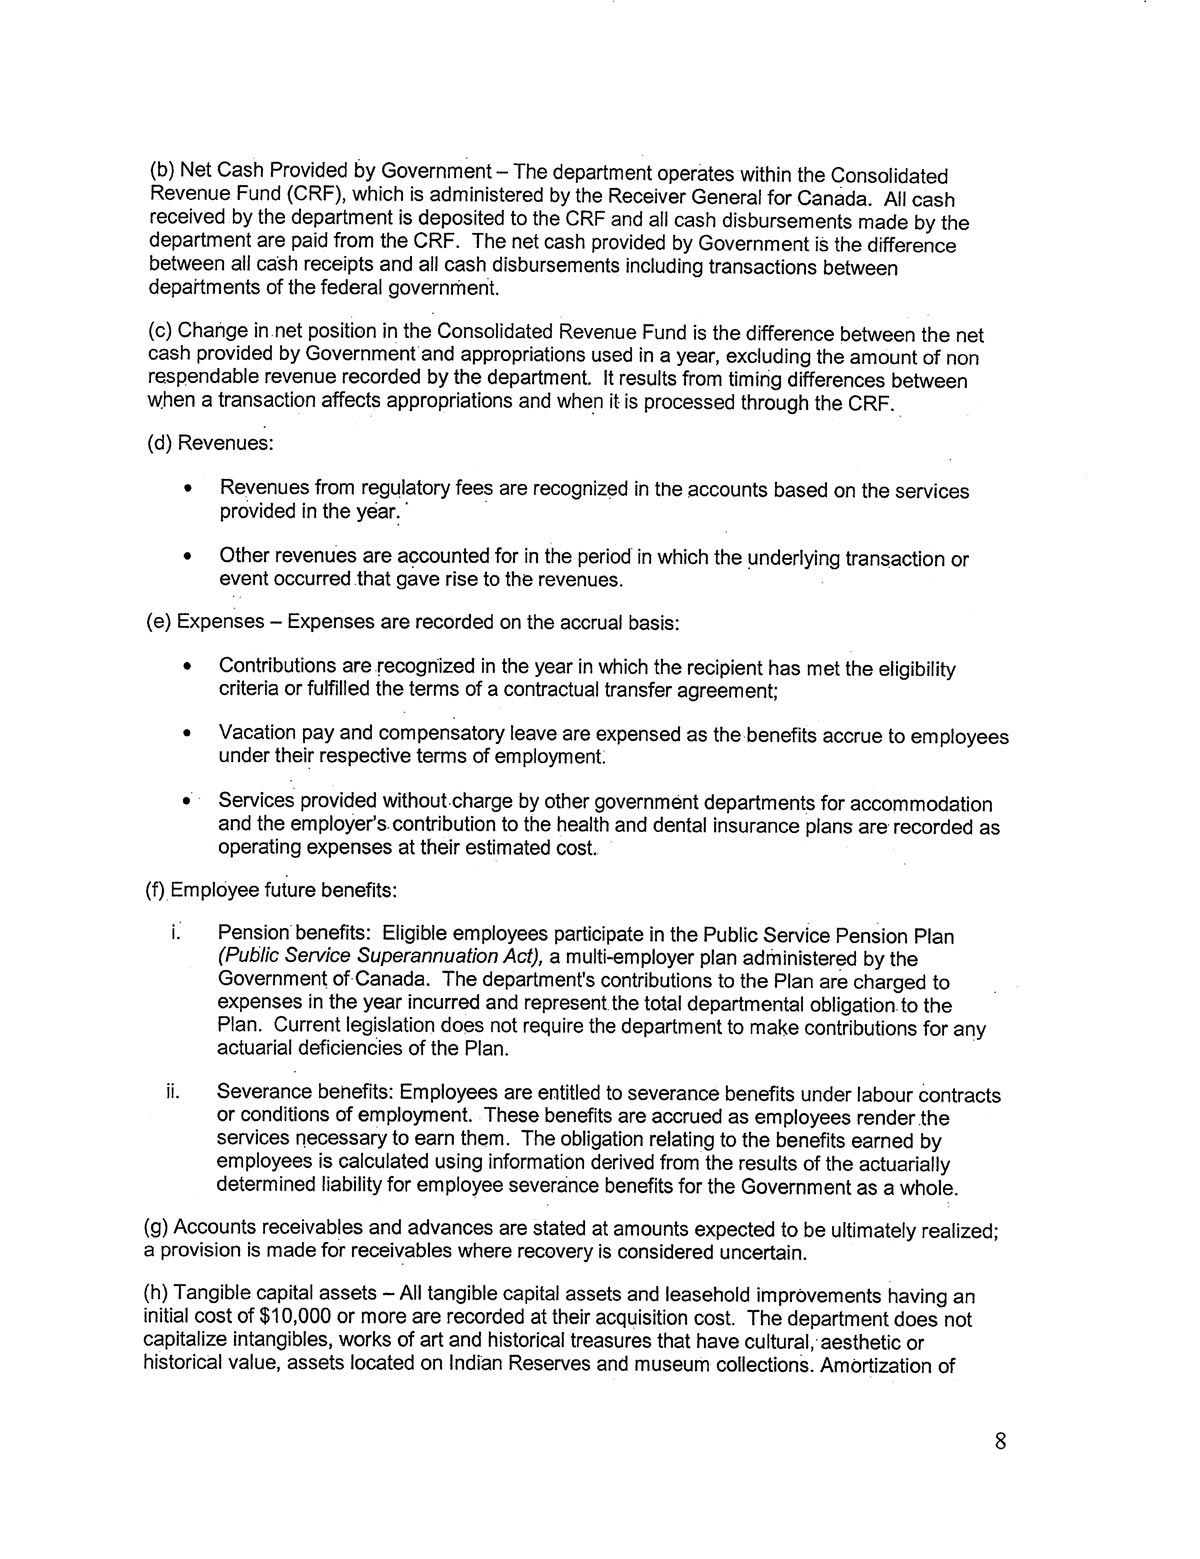
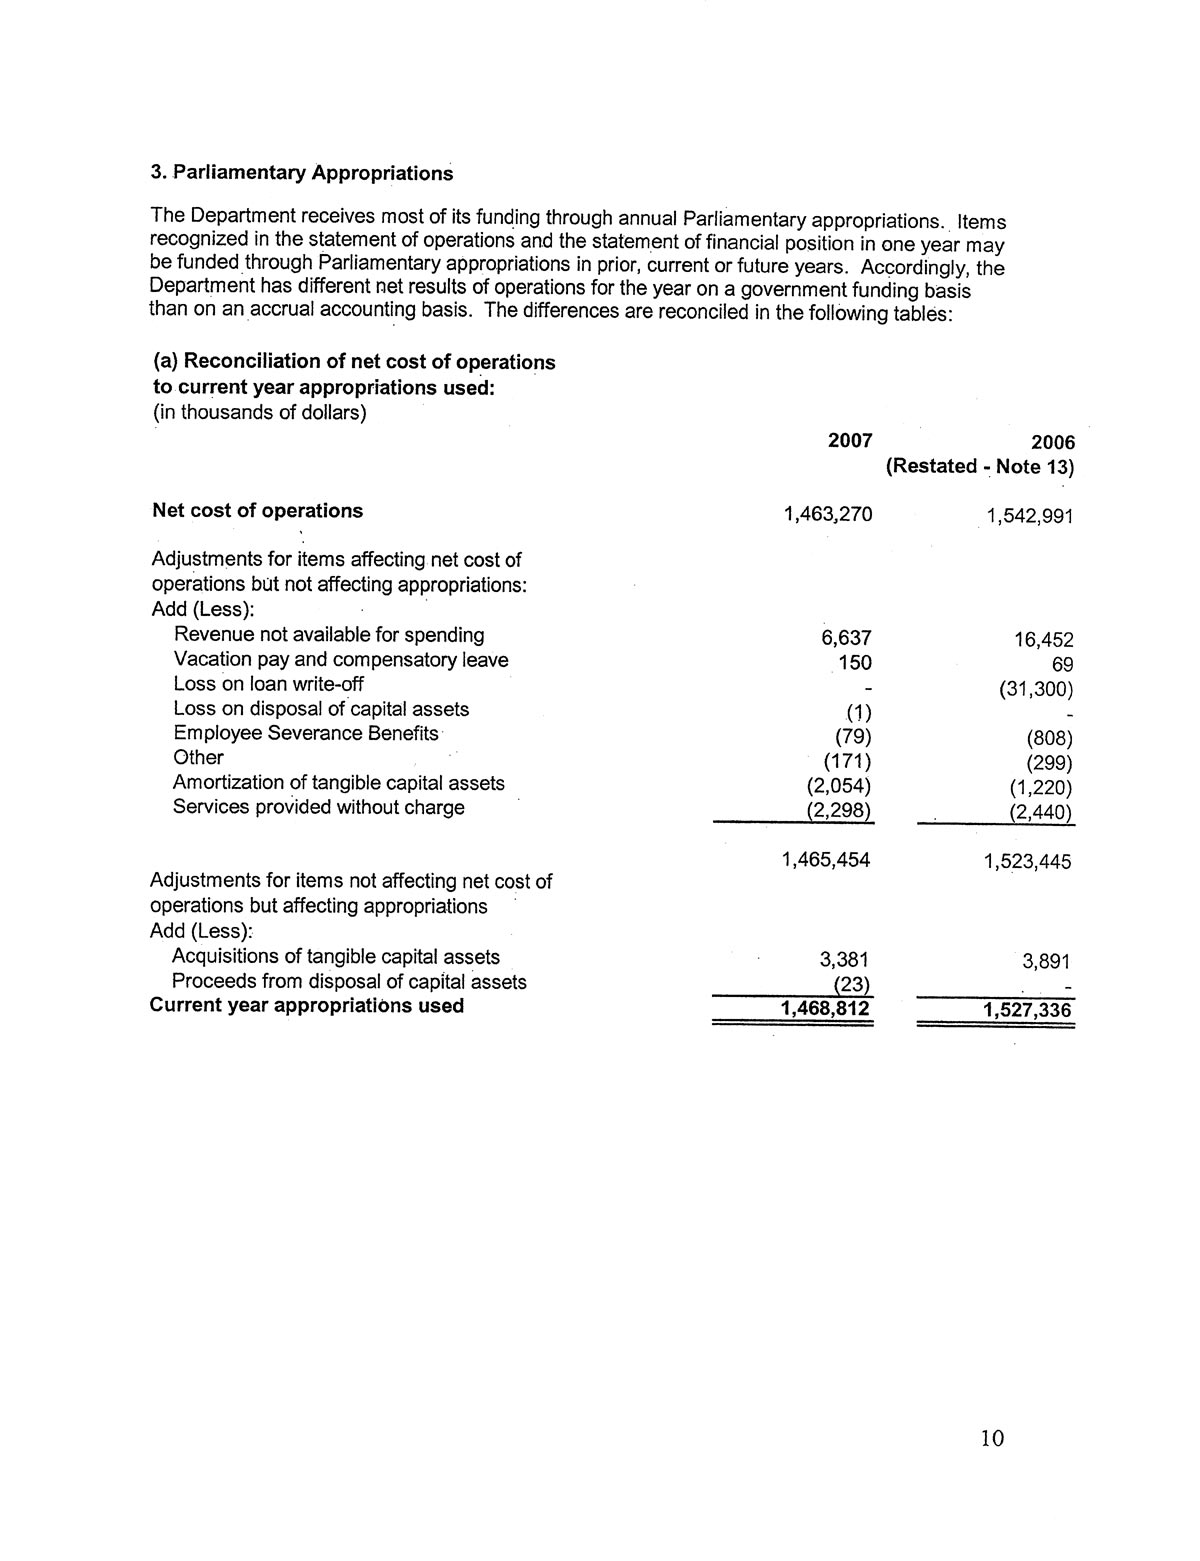
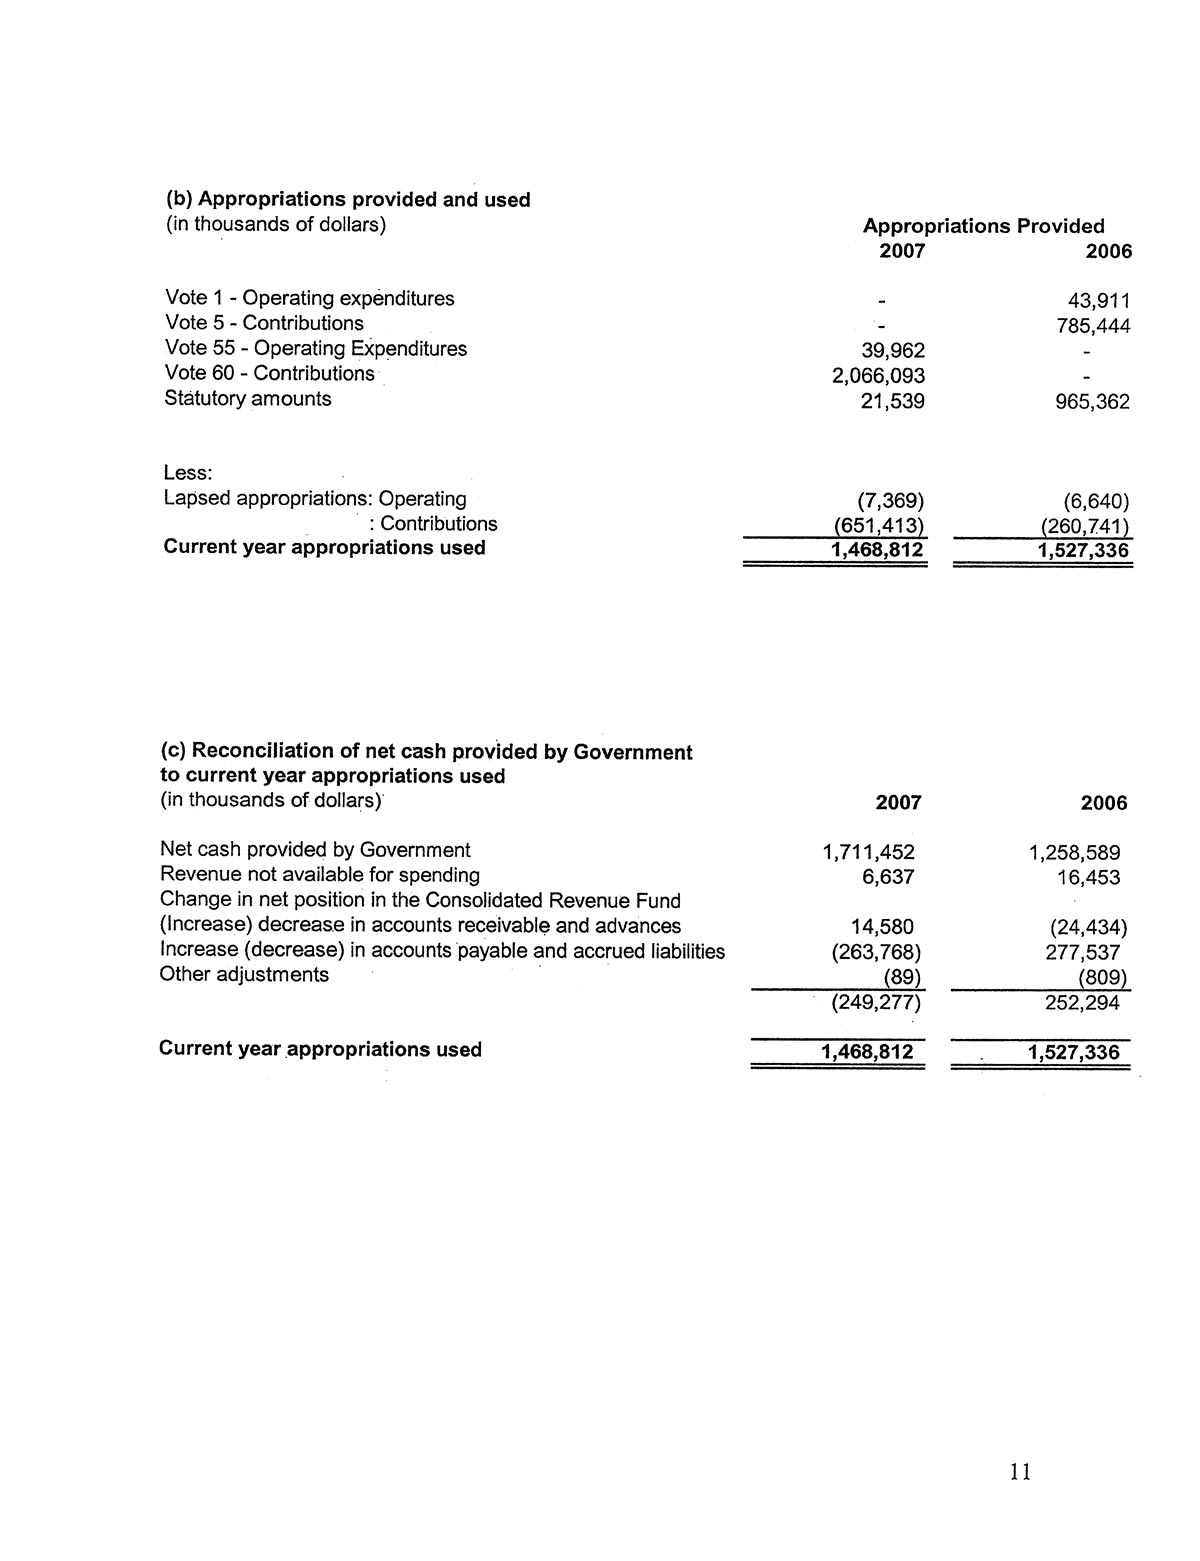
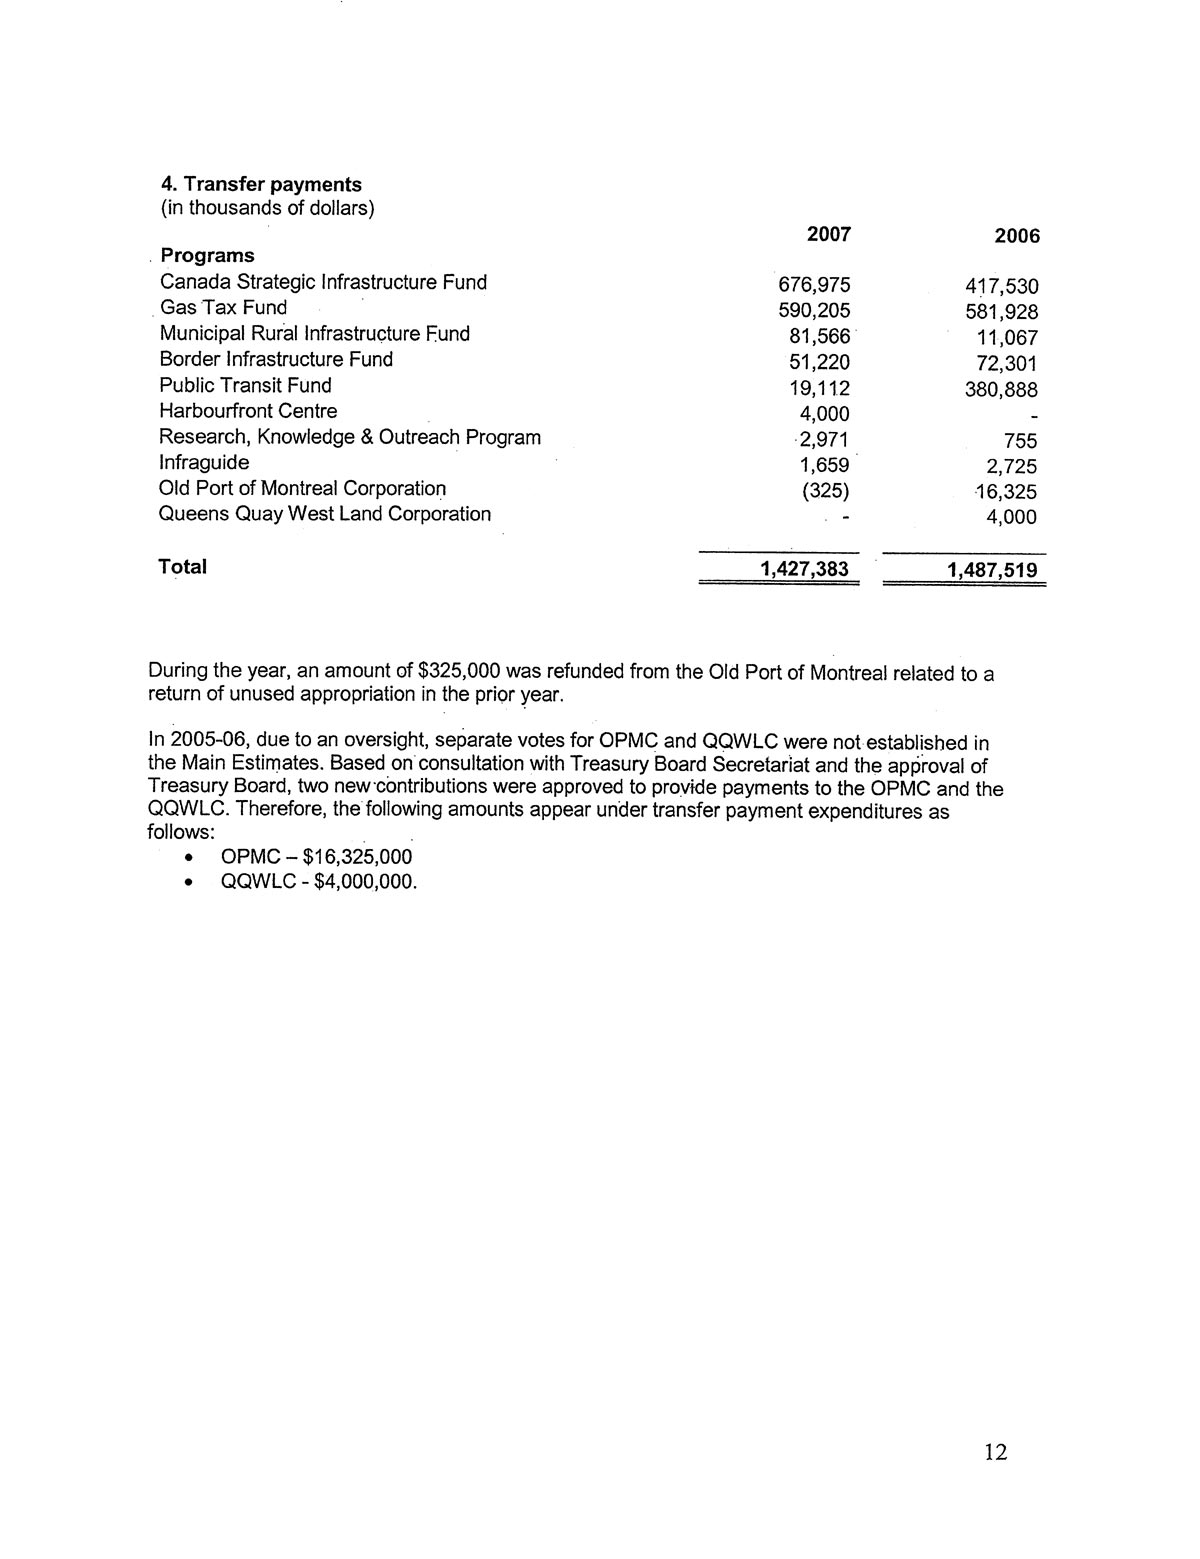
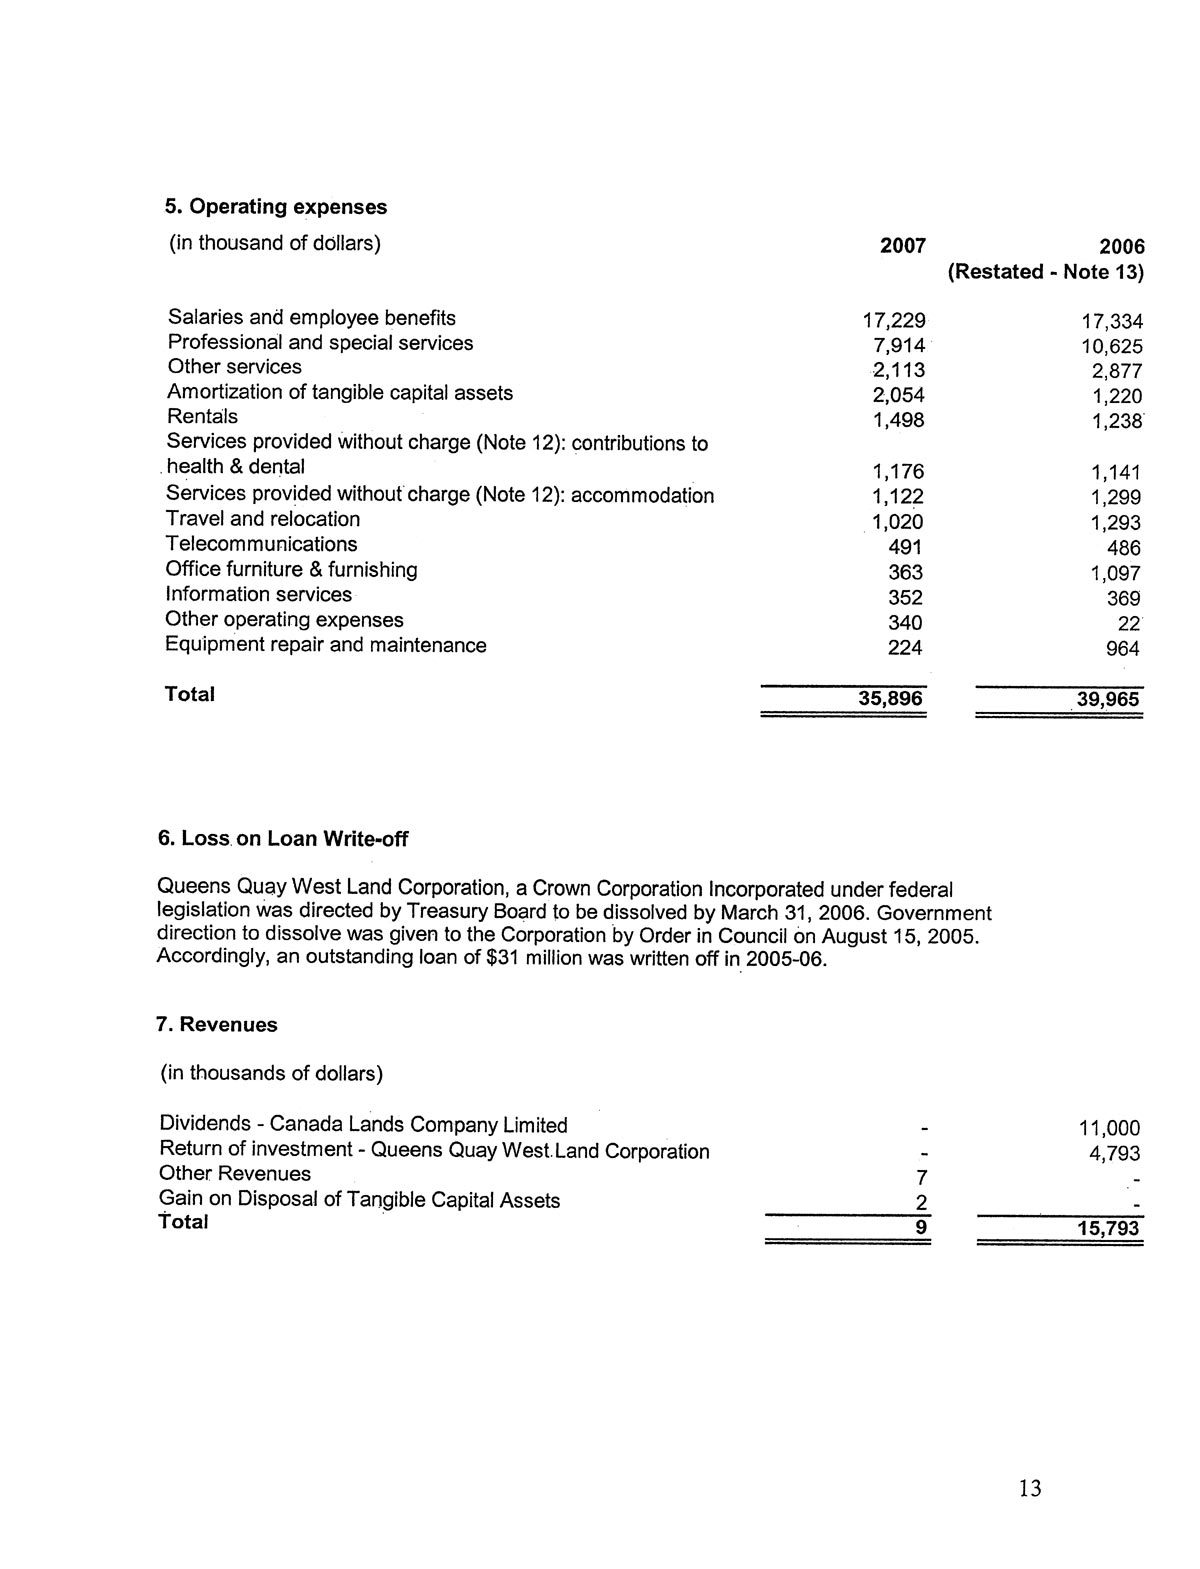
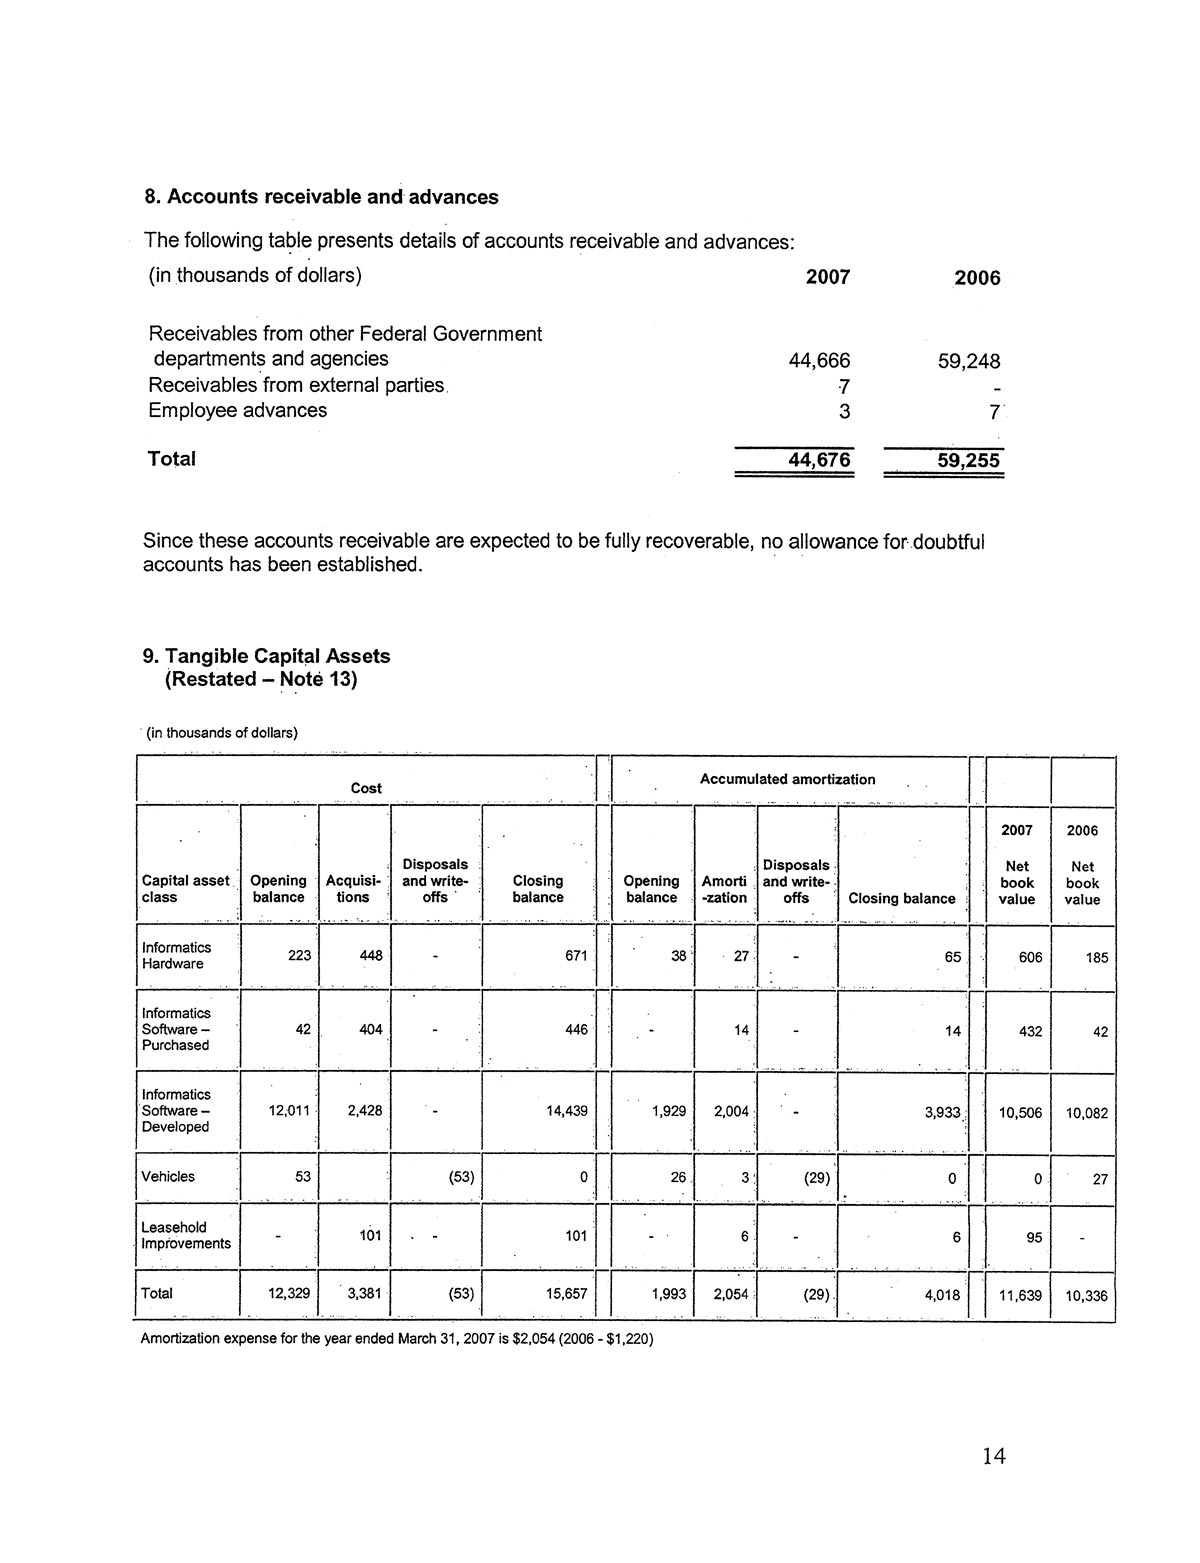
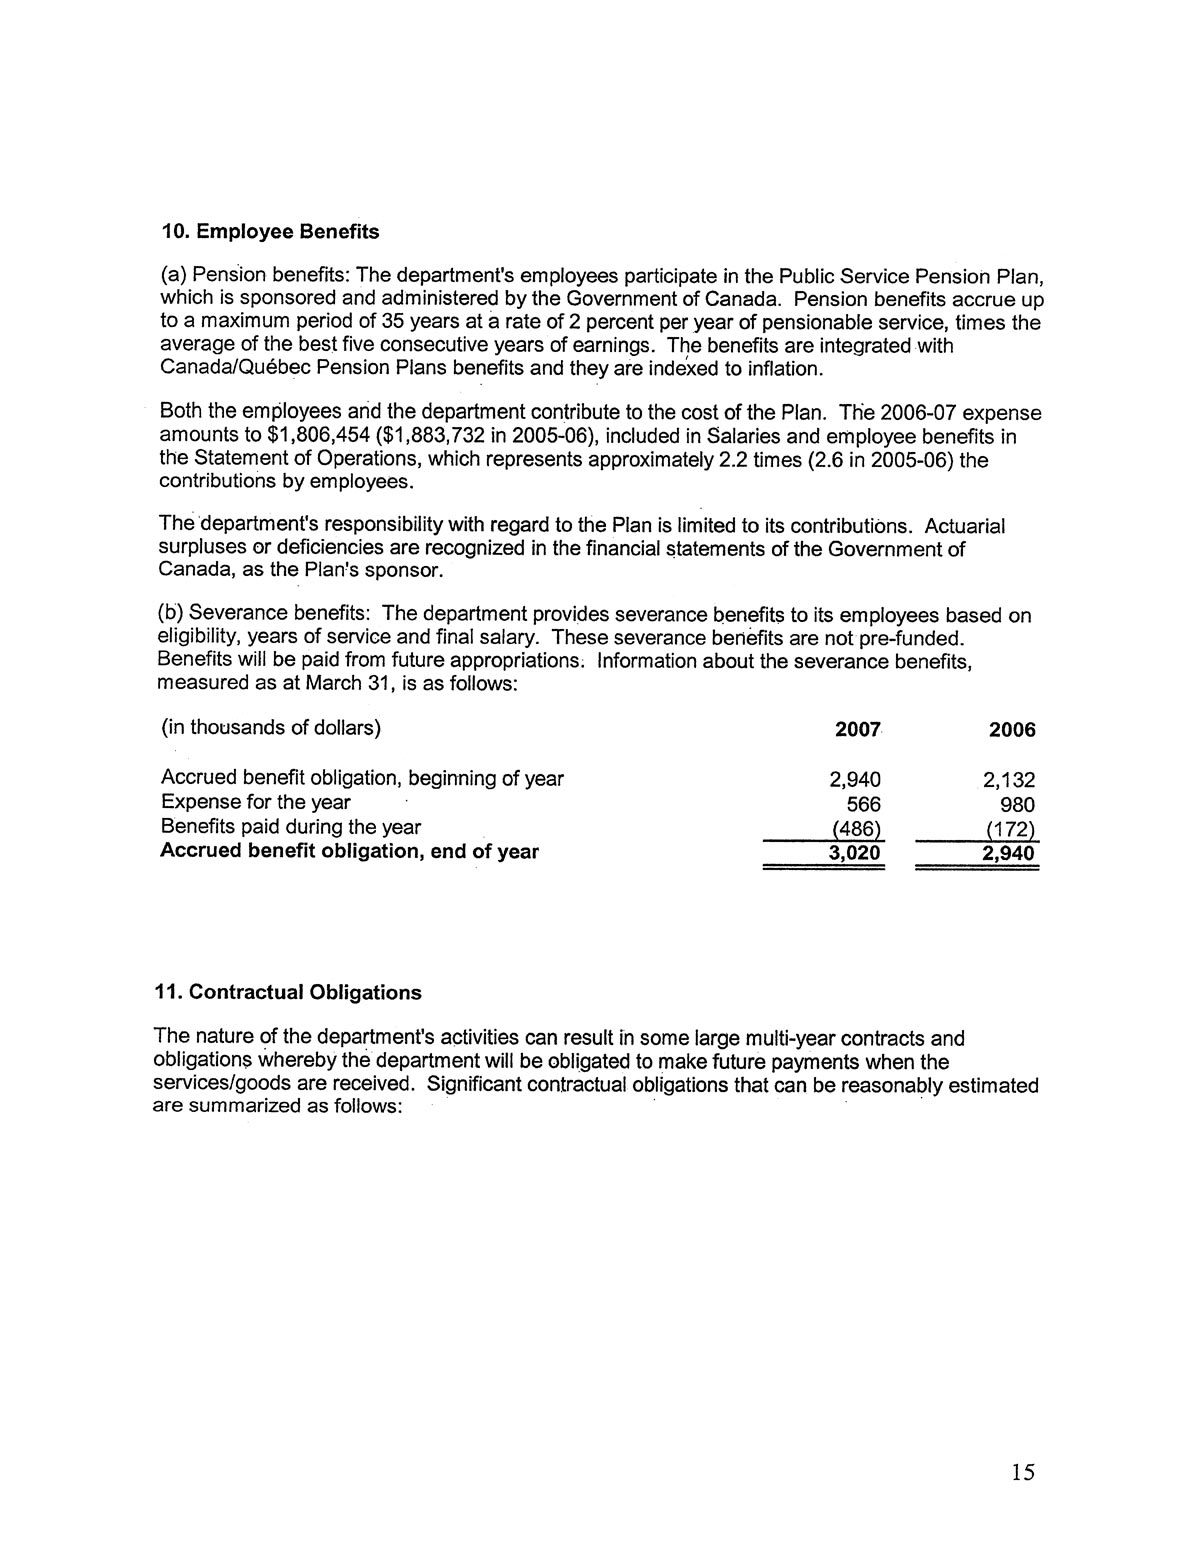
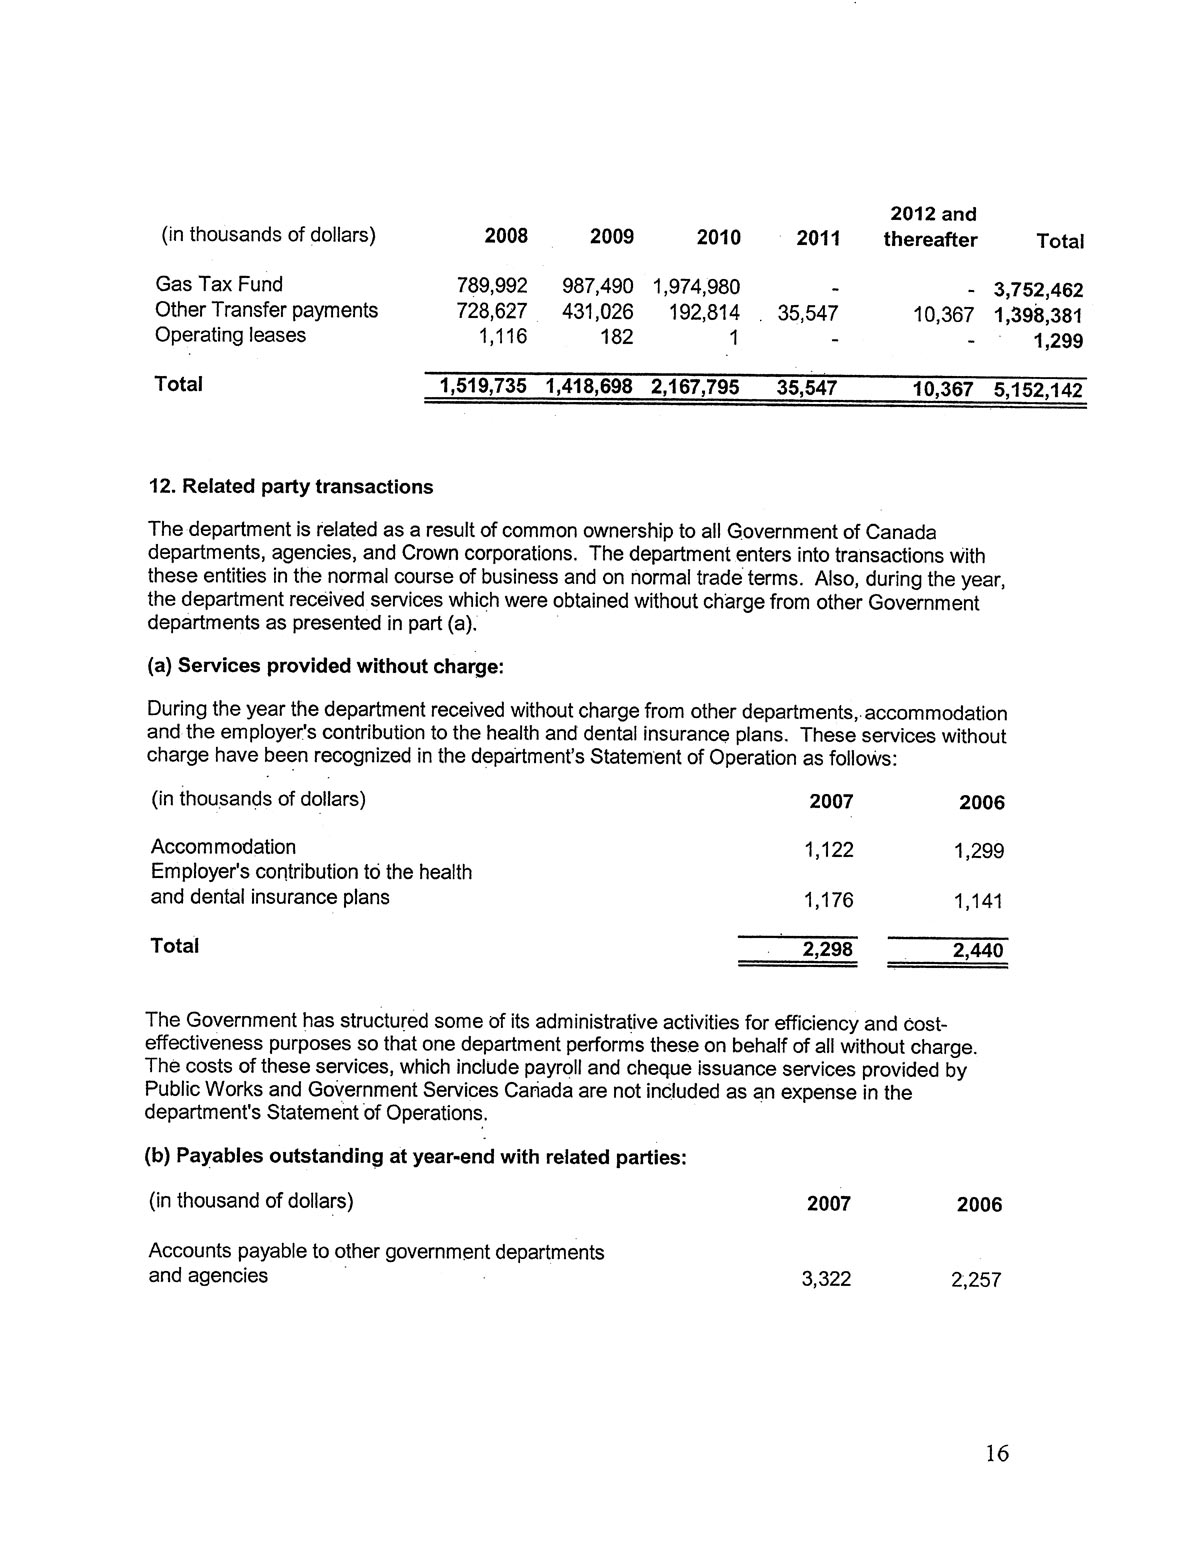
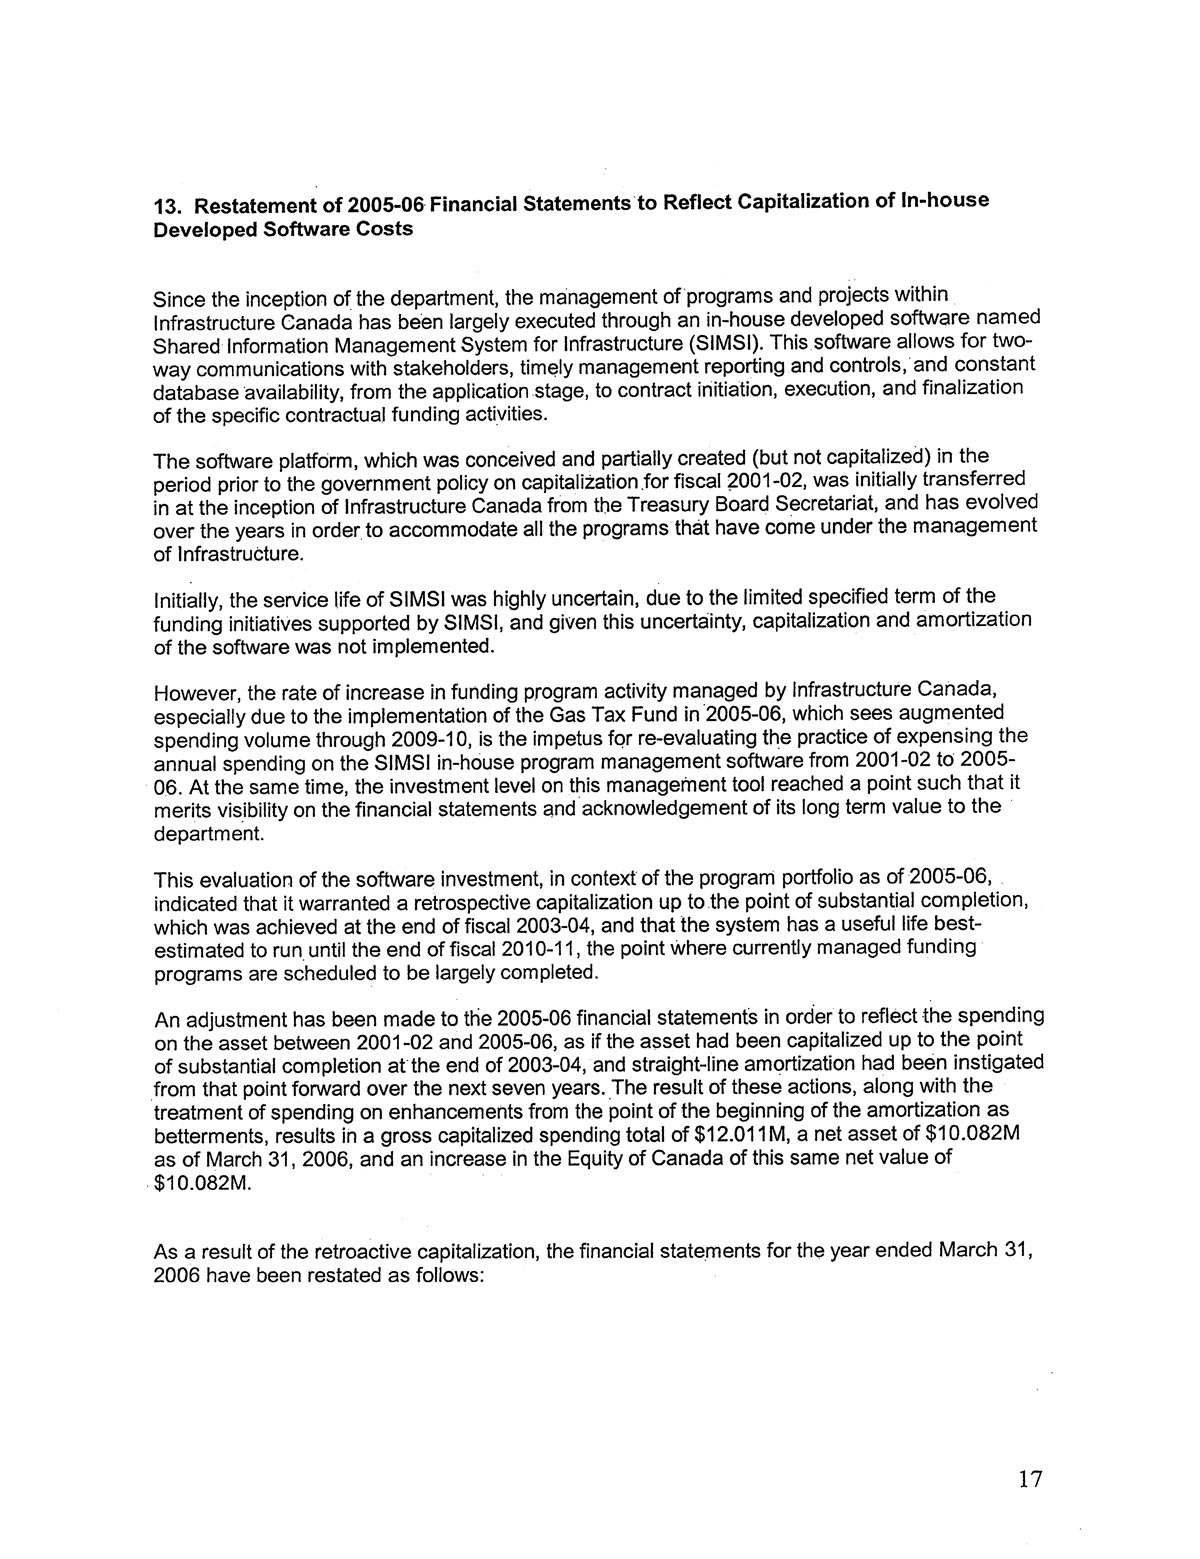
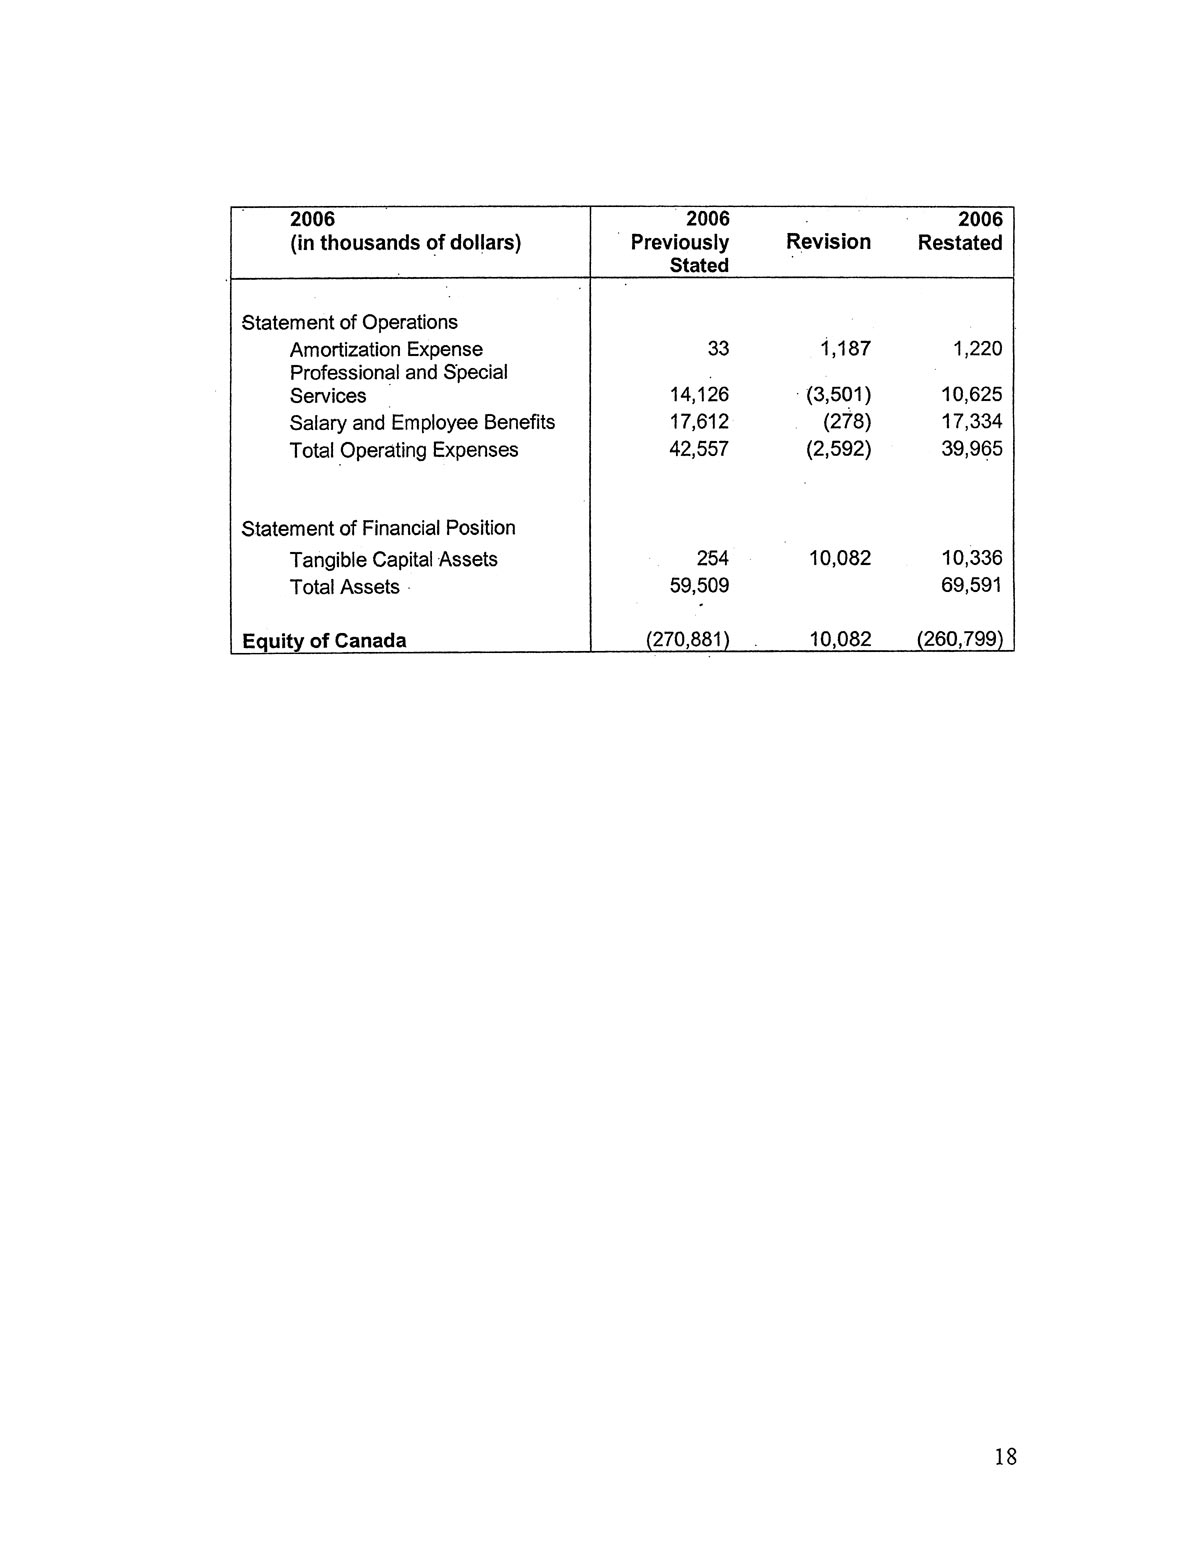
Table 3.7: Financial Statements of Infrastructure Canada (Unaudited)

Click on image to enlarge
Click on image to enlarge
Click on image to enlarge
Click on image to enlarge
Click on image to enlarge
Click on image to enlarge
Click on image to enlarge
Click on image to enlarge

Click on image to enlarge
Click on image to enlarge
Click on image to enlarge
Click on image to enlarge
Click on image to enlarge
Click on image to enlarge
Click on image to enlarge
Click on image to enlarge
Click on image to enlarge
Click on image to enlarge