
Common menu bar links
Breadcrumb Trail
ARCHIVED - Statistics Canada - Report
 This page has been archived.
Archived Content
Information identified as archived on the Web is for reference, research or recordkeeping purposes. It has not been altered or updated after the date of archiving. Web pages that are archived on the Web are not subject to the Government of Canada Web Standards. As per the Communications Policy of the Government of Canada, you can request alternate formats on the "Contact Us" page.
Section III - Supplementary Information
The future-oriented financial highlights presented in this RPP are intended as a general overview of Statistics Canada's forecast financial position and operations. Future-oriented financial statements can be found at
http://www.statcan.gc.ca/rpp/2012-2013/financ-eng.htm.
Financial Highlights
Table 17 Financial Highlights
| $ Change | Future-Oriented 2012-13 |
Future-Oriented 2011-12 |
|
|---|---|---|---|
| Total Expenses | -271,951 | 667,695 | 939,646 |
| Total Revenues | -12,156 | 97,748 | 109,904 |
| Net Cost of Operations | -259,795 | 569,947 | 829,742 |
| $ Change | Future-Oriented 2012-13 |
Future-Oriented 2011-12 |
|
|---|---|---|---|
| Total assets | -6,137 | 202,010 | 208,147 |
| Total liabilities | 1,534 | 155,267 | 153,733 |
| Equity | -7,671 | 46,743 | 54,414 |
| Total | -6,137 | 202,010 | 208,147 |
Future-Oriented Financial Statements
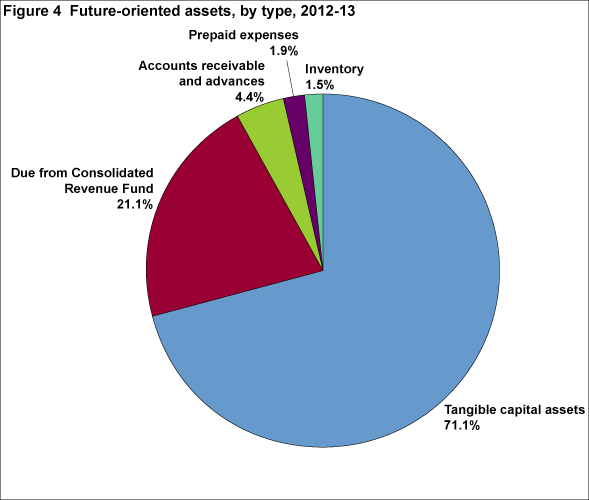
Total assets are anticipated to be $202.0 million in 2012-13, down $6.1 million from the 2011-12 projection. Of this amount, tangible capital assets are projected to total $143.6 million, down approximately $8.3 million, or 5.4%, from the 2011-12 projection. Tangible capital assets make up the largest portion of assets, 71.1% of the total. They mainly comprise computer software, $68.3 million; software under development, $45.7 million; computer hardware, $14.8 million; and leasehold improvements, $14.2 million. Of the remaining assets, accounts receivable and advances are expected to be $8.9 million; prepaid expenses, $3.7 million; and inventory, $3.0 million.
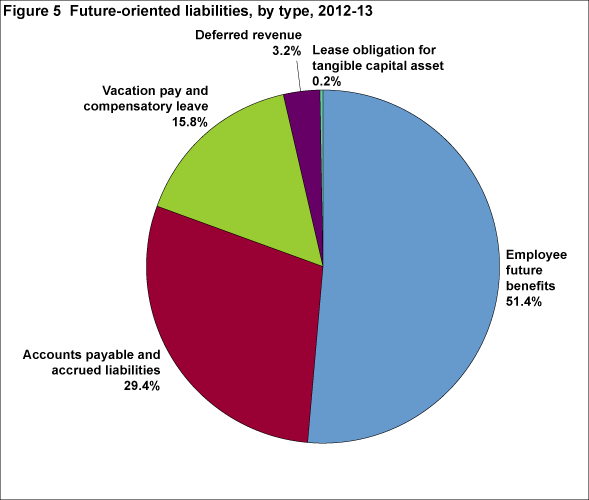
Total liabilities are anticipated to be $155.3 million for 2012-13, a net increase of $1.5 million from 2011-12 projections. Employee future benefits make up the largest portion of the liabilities, $79.7 million, or 51.4% of total liabilities. Accounts payable and accrued liabilities make up the next largest portion, $45.6 million, or 29.4% of total liabilities. It comprises accounts payable to external parties, $24.6 million; accrued salaries and wages, $10.7 million; and accounts payable to other federal government departments and agencies, $10.3 million. Vacation pay and compensatory leave make up $24.5 million, or 15.8% of the total.
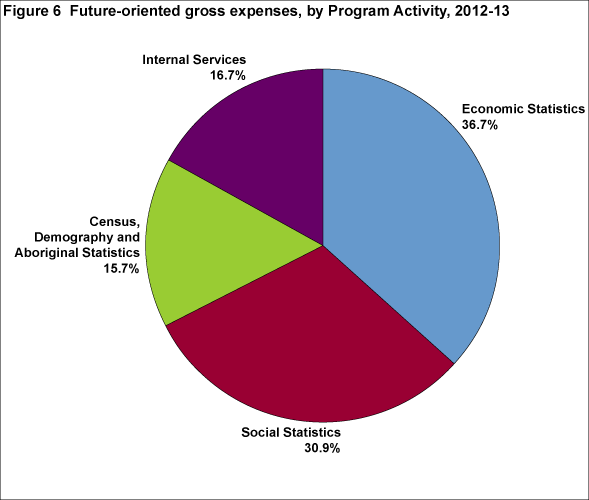
Statistics Canada projects $667.7 million in expenditures for 2012-13, a decrease of $271.9 million from 2011-12 projections. The main reason for this decrease is that 2011-12 was the peak year for the 2011 Census of Population, the National Household Survey, and the 2011 Census of Agriculture; spending on the census programs begins to wind down in 2012-13. Forecast gross expenditures for 2012-13 are broken down by Program Activity as follows: Economic Statistics, $244.6 million, or 36.7%; Social Statistics, $206.5 million, or 30.9%; Census, Demography and Aboriginal Statistics, $104.9 million, or 15.7%; and Internal Services, $111.7 million, or 16.7%.
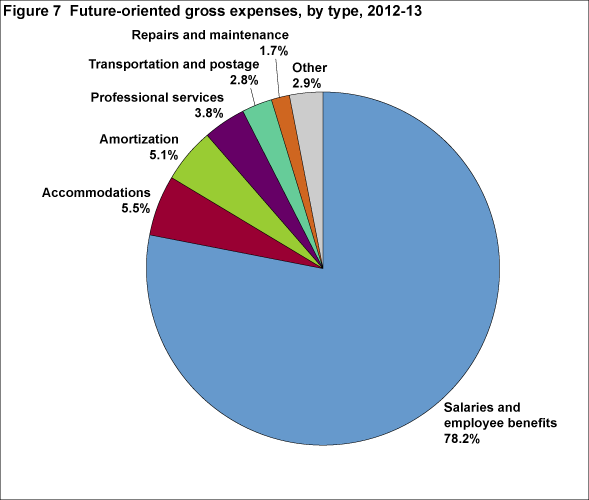
Statistics Canada projects $667.7 million in expenses for 2012-13. The expenses comprise salaries and employee benefits, $521.6 million; accommodations, $36.7 million; amortization, $34.2 million; professional services, $25.7 million; transportation and postage, $18.9 million; repairs and maintenance, $11.5 million; and other expenses, $19.1 million.
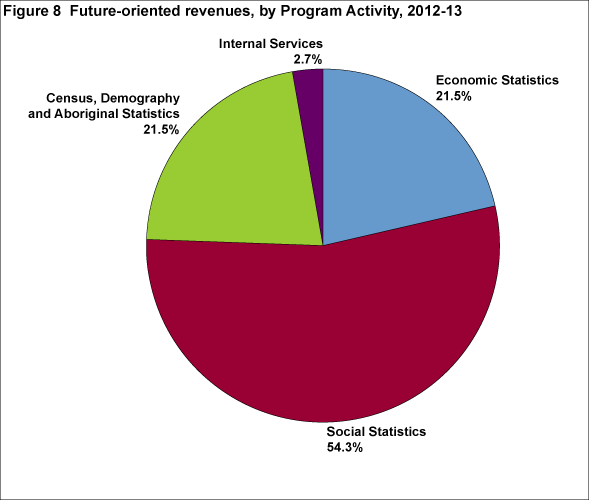
Statistics Canada's projected total revenues in 2012-13 are $97.7 million, a decrease of $12.2 million from the 2011-12 forecasts. Revenues generated by Program Activity are projected as follows: Economic Statistics, $21.0 million, or 21.5%; Social Statistics, $53.0 million, or 54.3%; Census, Demography and Aboriginal Statistics, $21.0 million, or 21.5%; and Internal Services, $2.7 million, or 2.7%.
List of supplementary information tables
All electronic supplementary information tables found in the 2012-13 Report on Plans and Priorities can be found on the Treasury Board of Canada Secretariat's website at http://www.tbs-sct.gc.ca/rpp/2012-2013/info/info-eng.asp.
These tables cover
- green procurement
- evaluations
- internal audits
- sources of respendable and non-respendable revenue
- summary of capital spending by program activity.
Section IV - Other Items of Interest
Organizational contact information
Email
infostats@statcan.gc.ca
Telephone
1-800-263-1136 or 613-951-8116
Fax
1-877-287-4369 or 613-951-0581
TTY
1-800-363-7629
Mail
Statistics Canada
150 Tunney's Pasture Driveway
Ottawa, Ontario
K1A 0T6
Website: http://www.statcan.gc.ca