
Common menu bar links
Breadcrumb Trail
ARCHIVED - Industry Canada - Report
 This page has been archived.
Archived Content
Information identified as archived on the Web is for reference, research or recordkeeping purposes. It has not been altered or updated after the date of archiving. Web pages that are archived on the Web are not subject to the Government of Canada Web Standards. As per the Communications Policy of the Government of Canada, you can request alternate formats on the "Contact Us" page.
Section 3: Supplementary Information
3.1 Financial highlights
These future-oriented financial highlights are intended to serve as a general overview of Industry Canada’s financial position and operations. They are prepared on an accrual basis to strengthen accountability and improve transparency and financial management.
Industry Canada’s future-oriented financial statements can be found on the departmental website.
| Condensed Future-Oriented Statement of Financial Position (unaudited) At March 31 |
% Change | Estimated Results 2010–11 | Forecast 2011–12 |
|---|---|---|---|
| Assets | |||
| Financial Assets | -15 | 1,540,701 | 1,309,085 |
| Non-Financial Assets | -5 | 103,526 | 98,758 |
| Total | -14 | 1,644,227 | 1,407,843 |
| Liabilities | |||
| Accounts Payable and Accrued Liabilities | -42 | 918,461 | 529,182 |
| Deferred Revenue | -14 | 3,792,475 | 3,265,951 |
| Other Liabilities | 1 | 532,863 | 538,917 |
| Total Liabilities | -17 | 5,243,799 | 4,334,050 |
| Equity | -19 | (3,599,572) | (2,926,207) |
| Total | -14 | 1,644,227 | 1,407,843 |
| Condensed Future-Oriented Statement of Operations (unaudited) For the period ended March 31 |
% Change | Estimated Results 2010–11 | Forecast 2011–12 |
|---|---|---|---|
| Expenses | |||
| Transfer Payments | -64 | 1,771,718 | 642,987 |
| Operating Expenses | -3 | 838,023 | 812,131 |
| Total Expenses | -44 | 2,609,741 | 1,455,118 |
| Revenues | |||
| Sales of Services | -4 | 1,081,510 | 1,034,353 |
| Other | -40 | 18,184 | 10,977 |
| Total Revenues | -5 | 1,099,694 | 1,045,330 |
| Net Cost of Operations | -73 | 1,510,047 | 409,788 |
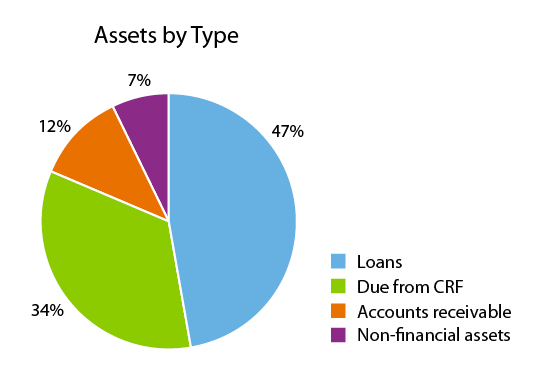
Assets by Type
Total assets for 2011–12 are projected to be $1.41 billion. Expected increases for unconditionally repayable contributions recorded as loans are largely related to the Automotive Innovation Fund and the Strategic Aerospace and Defence Initiative. Due from CRF (Consolidated Revenue Fund) amounts are largely dependent on projected payables and, as such, will vary with fluctuations in those accounts. Non-financial assets represent tangible capital assets for which no substantial increases or decreases are expected.
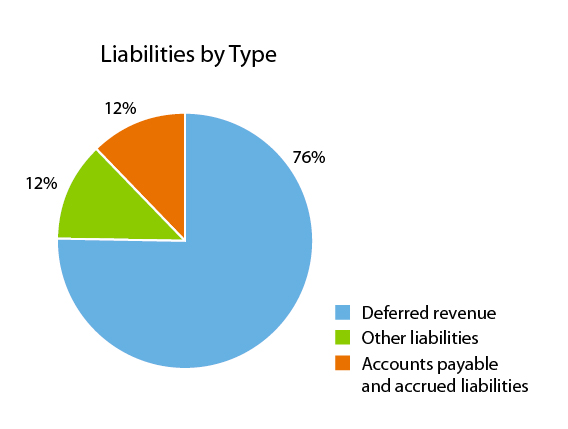
Liabilities by Type
Total liabilities for 2011–12 are projected to be $4.33 billion. The forecast deferred revenue is the largest liability in the Future-Oriented Statement of Financial Position (76 percent or $3.27 billion). This amount represents auction revenues that are deferred and recognized on a straight-line basis, with a significant portion resulting from the Advanced Wireless Services and Other Spectrum auction that was held in 2008–09. Accounts payable and accrued liabilities are projected based largely on expense levels. Other liabilities consist of an allowance for loan guarantees (conservatively held at September 30, 2010, levels), special purpose accounts, and allowances for vacation and severance pay, all of which are projected based on low-level upward trends and historic rates.
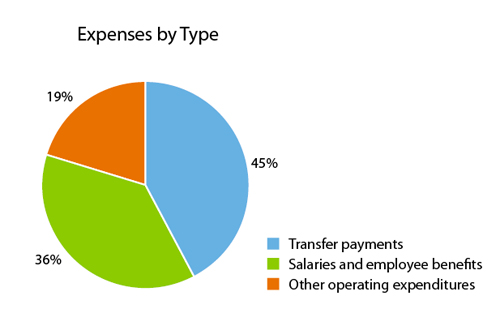
Expenses by Type
Total expenses for 2011–12 are projected to be $1.46 billion. The majority of these expenses are in the form of transfer payments. Transfer payment programs under Canada’s Economic Action Plan (EAP) were scheduled to end on March 31, 2011, except for the Broadband Canada program. This program had a predetermined end date of March 31, 2012, and will continue making payments with EAP funding during 2011–12. For this reason, projected expenses are approximately $1.25 billion less than the two previous fiscal years. Operating expenses are expected to remain at their historic levels, with a slight year-over-year decrease, including salaries and employee benefits.
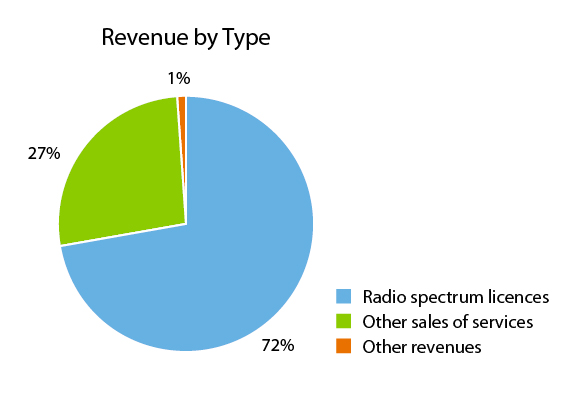
Revenues by Type
Total revenues for 2011–12 are projected to be $1.05 billion. Radio spectrum licences make up three quarters of the projected revenue, which includes yearly licence revenue as well as deferred revenue from sales of spectrum licences. Other sales of services include various sources of revenue, such as fees collected under the Canada Small Business Financing Program and by the Canadian Intellectual Property Office and the Office of the Superintendent of Bankruptcy, all of which have been projected to be consistent with amounts collected in previous years. Other revenues consist largely of fines collected under the Competition Law Enforcement program, which are projected to be half of the 2010–11 levels.
3.2 Supplementary information tables
The following tables are available on the Treasury Board of Canada Secretariat website:
- Details of Transfer Payment Programs
- Up-Front Multi-Year Funding
- Greening Government Operations

- Upcoming Internal Audits and Evaluations in the Next Three Fiscal Years
- Sources of Respendable and Non-Respendable Revenue
- Summary of Capital Spending by Program Activity
- User Fees
Section 4: Other Items of Interest
The following information is available online.
4.1 Information management and information technology governance and responsibilities at Industry Canada
4.2 Program activity titles and descriptions
The program activities are presented by the strategic outcome to which they contribute.
- The Canadian marketplace is efficient and competitive
- Advancements in science and technology, knowledge, and innovation strengthen the Canadian economy
- Canadian businesses and communities are competitive
4.3 Expected results of program subactivities by strategic outcome
The program subactivities, including their expected results, performance indicators and targets, are presented by the strategic outcome to which they contribute.
- The Canadian marketplace is efficient and competitive
- Advancements in science and technology, knowledge, and innovation strengthen the Canadian economy
- Canadian businesses and communities are competitive
4.4 Strategic environmental assessments and sustainable development activities
In accordance with the Federal Sustainable Development Strategy (FSDS), Industry Canada commits to the following:
- providing more specific information on departmental sustainable development activities, as is appropriate to the Department’s mandate;
- strengthening the application of strategic environmental assessments (SEA) by ensuring that the government’s environmental goals are taken into account when pursuing social and economic goals; and
- employing best practices when reporting summary information on the results of SEAs and linking results to FSDS goals and targets to ensure that environmental decision making is more transparent.
Complete details on Industry Canada’s sustainable development activities are available on the Environment and Sustainability subsite of the departmental website. Industry Canada’s Greening Government Operations table, one of the supplementary information tables itemized in Section 3 of this report, is available on the Treasury Board of Canada Secretariat website. For complete details on the FSDS, please see the Environment Canada website.