
Common menu bar links
Breadcrumb Trail
ARCHIVED - Human Resources and Skills Development Canada - Report
 This page has been archived.
Archived Content
Information identified as archived on the Web is for reference, research or recordkeeping purposes. It has not been altered or updated after the date of archiving. Web pages that are archived on the Web are not subject to the Government of Canada Web Standards. As per the Communications Policy of the Government of Canada, you can request alternate formats on the "Contact Us" page.
Section II Analysis of Program Activities by Strategic Outcome
This section provides more detailed information about the Department's program activities and how they support the achievement of its strategic outcomes. For each program activity, it explains the intended benefit to Canadians, and sets out performance using expected results, performance indicators, and forecasted spending. Finally, the planning highlights describe the key activities associated with each program activity that will be undertaken to support the Department's priorities and strategic outcomes.
2.1 Strategic Outcome 1: A skilled, adaptable and inclusive labour force and an efficient labour market

Click here to enlarge
Text version of the Strategic Outcome 1: A skilled, adaptable and inclusive labour force and an efficient labour market
2.1.1 Program Activity: Skills and Employment
Benefits to Canadians
Through its skills and employment programs, HRSDC helps Canadian workers adapt to a changing labour market and become more self-reliant. The Employment Insurance (EI) program provides temporary income support to eligible unemployed workers, while also helping them prepare for, find and keep jobs. Other programs are designed to support the skills development of Canadians and increase their labour market participation, focusing on those who are under-represented in the labour market, such as youth, persons with disabilities, older workers and Aboriginal people.
HRSDC’s programs also support Canadian employers by helping them meet their labour force needs and remain competitive. These programs make it easier for employers to find qualified workers (domestically or internationally trained) and also provide employers with tools to improve the skills of their workforce.
Finally, HRSDC’s programs improve labour market efficiency by: providing timely, reliable labour market information; improving labour mobility by working to remove barriers in regulated professions and trades; and improving the recognition of qualifications (both domestic and foreign) so that Canadians have opportunities to find jobs commensurate with their skills and training.
| Human Resources (FTEs) and Planned Spending ($ millions) | |||||
|---|---|---|---|---|---|
| 2011–2012 | 2012–2013 | 2013–2014 | |||
| FTEs | Planned Spending | FTEs | Planned Spending | FTEs | Planned Spending |
| 1,947 | 21,293.8 | 1,925 | 20,724.1 | 1,910 | 20,469.2 |
| Program Activity Expected Results | Performance Indicators | Targets |
|---|---|---|
| Workers in an adjustment situation have access to temporary financial assistance. | Percentage of unemployed individuals eligible to receive benefits, among those who had a recent job separation that met EI program eligibility criteria. Source: Administrative Data |
80-85% Historical Results: |
| Canadians, including the under-represented groups and vulnerable workers, have the opportunity to acquire skills to find and maintain productive employment. | The proportion of clients employed and/or returning to school following a completed employment program intervention under the following federally delivered programs: Youth Employment Strategy, Opportunities Fund for Persons with Disabilities, Aboriginal Skills and Employment Partnership, Aboriginal Skills and Employment Training Strategy and Skills and Partnerships Fund. Source: Administrative Data |
55-65% Historical Results: |
| Through increased progression in the first two years of an apprenticeship program, completions are enhanced in the designated Red Seal trades. | Number of apprentices who complete an apprenticeship program and obtain certification in a Red Seal Trade. Source: Registered Apprentice Information System, Statistics Canada |
Baseline Year |
Planning Highlights
Provide effective income support measures
HRSDC will be working to support the needs of Canadians through Employment Insurance programming which responds to evolving economic conditions through effective income support. Policy research and analysis will continue, which includes analyzing the impact of pilot projects introduced to address higher unemployment levels, including the Working While on Claim, and the Best 14 Weeks pilots.
Support Canadians in developing their skills
HRSDC will work to enhance the participation of under-represented groups in the Canadian labour market (e.g., people with disabilities, Aboriginal people, and youth) through renewal and implementation of programs designed to address their needs, as well as through ongoing policy research and development. This work will be undertaken in collaboration with key partners and stakeholders.
At the same time, HRSDC will work with employers, provinces and territories, and other partners to continue to help Canadian workers acquire the skills needed in the Canadian labour market. This will include updating key components of the essential skills methodology, and continuing work with the Canadian Council of Directors of Apprenticeships to explore an occupational performance standards framework for Red Seal trades.
In addition, HRSDC will continue to work with key partners to enhance the recognition of foreign credentials in Canada by establishing and negotiating partnerships for target occupations under Foreign Qualification Recognition agreements.
Improve the quality and dissemination of labour market information
The Department will improve the quality and accuracy of national, regional and local labour market information (LMI) and ensure the efficient dissemination of LMI products to Canadians. This will involve the streamlining of internet-based information such as the Working in Canada tool and other websites, in order to better support Canadians when they are making labour market decisions.
2.1.2 Program Activity: Learning
Benefits to Canadians
Through the Canada Student Loans Program and the Canada Student Grants Program, HRSDC helps Canadians attend college, university and trade schools by lowering financial barriers through the provision of loans and grants to students with financial need. HRSDC also encourages Canadians to save for post-secondary education by contributing to registered education savings plans through the Canada Education Savings Program. Taken together, these programs contribute to building a more skilled, adaptable, and inclusive labour force by helping all Canadians obtain the skills and credentials they need to succeed in the labour market.
For individuals, the benefits of post-secondary education are clear: workers with higher-level skills and credentials tend to be more productive, earn higher wages, remain in the labour force longer, and have greater flexibility and choice in selecting future employment. By helping Canadians finance their post-secondary education, HRSDC makes it easier for them to attend the school and program of their choice, allowing students to devote more time to their studies instead of work.
Employers looking for potential employees value post-secondary education because it increases the knowledge and skill levels of the workforce. The increase in the availability of skilled labour drives innovation and reduces skills shortages that limit economic growth. Having a better educated workforce allows employers to adopt new technologies and techniques more quickly.
| Human Resources (FTEs) and Planned Spending ($ millions) | |||||
|---|---|---|---|---|---|
| 2011–2012 | 2012–2013 | 2013–2014 | |||
| FTEs | Planned Spending | FTEs | Planned Spending | FTEs | Planned Spending |
| 414 | 2,606.7 | 414 | 2,525.2 | 413 | 2,490.1 |
| Program Activity Expected Results | Performance Indicators | Targets |
|---|---|---|
| Canadians have the skills and credentials to succeed in the labour market. | Percentage of the Canadian population (aged 25-64) who have attained a post-secondary certificate, diploma, or degree. Source: Labour Force Survey, Statistics Canada |
62.5% Historical Results: |
| Canadians, including those from under-represented groups, participate equitably in post-secondary education (PSE). | Percentage of Canadians (aged 15-64) who were attending university or college.1 Source: Labour Force Survey, Statistics Canada |
8.5% Historical Results: |
Percentage of persons with a disability who were participating in post-secondary education. Source: Survey of Labour and Income Dynamics, Statistics Canada, 2007 |
7.9% Historical Results: Note: There is a 3-year lag in the availability of data for this indicator. |
|
| Canadians have access to financing for their post-secondary education. | Percentage of full-time post-secondary students (in participating provinces/territories) who used a Canada Student loan or a Canada Student Grant or an in-study interest subsidy to help finance their participation in post-secondary education. Source: Administrative Data and Office of the Chief Actuary |
Baseline Year |
Percentage of full-time and part-time post-secondary students in Canada who used RESP funding to help finance their participation in post-secondary education. Source: Administrative Data and Labour Force Survey, Statistics Canada |
14.6% Historical Results: |
|
Percentage of children under 18 (in 2011) who have ever received a Canada Education Savings Grant. Source: Administrative Data |
43% Historical Results: |
|
Percentage of eligible children (in 2011) who have ever received a Canada Learning Bond. Source: Administrative Data |
23.4% Historical Results: |
|
| Clients are satisfied with the quality of services they receive. | Percentage of in-study and in-repayment borrowers who are satisfied with the overall loan experience provided by the Canada Student Loans Program. Source: Administrative Data |
75% Historical Results: |
% of Canada Education Savings Grant payments made within established service standards. Source: Administrative Data |
90% Historical Results: |
|
| 1 See Supplementary Table for breakdown by gender and by age group (17-21, 22-24, and 25-29), available at: http://www.rhdcc.gc.ca/eng/publications_resources/ dpr/rpp/detailed_information/2011_2012/table_learning_eng.shtml |
||
Planning Highlights
Support Canadians' efforts to acquire post-secondary education
Human Resources and Skills Development Canada will:
- Continue learning-related policy development and research, and maintain positive relationships with stakeholders and partners.
HRSDC will continue its ongoing policy development and research related to post-secondary education, with a particular emphasis on assessing the participation of under-represented groups in PSE, including students with disabilities, from low-income families, from rural/remote communities, or student parents, to improve understanding of how its programs affect Canadians.
- Improve the stewardship and accountability of post-secondary education support programs.
The Canadian public demands and deserves prudent management of public funds. The Department is committed to improving stewardship and accountability of post-secondary education support programs. In addition to ongoing efforts to improve integrity, accountability, planning and reporting, the Department will focus on reviewing the Canada Student Loan Program designation policy framework as it applies to e-learning, implementation of a long-term plan for managing the Canada Student Loan Program portfolio loan limit, completing the privacy impact assessment for the Service Delivery Vision for Student Financial Assistance, and strengthening public reporting of program performance.
2.2 Strategic Outcome 2: Safe, fair and productive workplaces and cooperative workplace relations

Click here to enlarge
Text version of the Strategic Outcome 2: Safe, fair and productive workplaces and cooperative workplace relations
2.2.1 Program Activity: Labour
Benefits to Canadians
This program activity oversees federally regulated workplaces in a number of strategically important sectors of the economy, including: banking; telecommunications; broadcasting; air, interprovincial rail, road and pipeline transportation; shipping; uranium mining; grain handling; and, Crown corporations to ensure safe, fair and productive workplaces, and cooperative workplace relations.
To promote cooperation and fairness in these sectors, the Labour Program provides mediation and conciliation services to assist employers and unions in settling disputes; appoints arbitrators, adjudicators and referees to resolve specific disputes between employers and employees; offers a comprehensive and innovative Preventive Mediation Program to assist employers and unions in building effective labour-management relations; provides grievance mediation to assist labour and management in reaching voluntary settlement of grievances as a low-cost alternative to arbitration; and, fosters cooperation through its Labour-Management Partnerships Program.
Through a coast-to-coast network of regional offices, the Labour Program works with employers and employees to ensure that laws governing occupational health and safety, labour standards and employment equity are respected. The Labour Program oversees the federal workers’ compensation system, administers the Wage Earner Protection Program and provides national fire protection services in all federal government owned and leased buildings and facilities, and in schools and major public Band buildings in First Nations communities.
To enhance working conditions and ensure healthy and fair workplaces for all Canadians, the Labour Program works closely with provincial and territorial governments, First Nations communities, and a range of international partners. The Labour Program conducts research on issues such as work-life balance and tracks a wide range of information about labour relations and workplace trends in Canada, including developments in federal, provincial and territorial labour laws.
Internationally, the Labour Program will continue to lead the negotiation and implementation of labour cooperation agreements (with countries that Canada signs free trade agreements) to protect Canadian companies and workers from foreign competitors who may be tempted to gain unfair advantages by ignoring basic labour standards. The Labour Program will also continue to represent Canada in multilateral fora, negotiate international labour standards, and advance Canadian interests and fundamental values abroad.
| Human Resources (FTEs) and Planned Spending ($ millions) | |||||
|---|---|---|---|---|---|
| 2011–2012 | 2012–2013 | 2013–2014 | |||
| FTEs | Planned Spending | FTEs | Planned Spending | FTEs | Planned Spending |
| 725 | 307.1 | 709 | 312.5 | 709 | 312.4 |
| Program Activity Expected Results | Performance Indicators | Targets |
|---|---|---|
| Workplace parties comply with relevant workplace standards, follow guidelines, and adopt best practices. | Percentage of unjust dismissal complaints settled by inspectors (Part III (Labour Standards) of the Canada Labour Code). Source: Administrative Data |
75% Historical Results: |
Percentage of money collected in relation to the amount found to be owed for complaints under Part III (Labour Standards) of the Canada Labour Code (excluding unjust dismissal complaints). Source: Administrative Data |
75% Historical Results: |
|
| Risks to life, health, and property are eliminated or mitigated. | Percentage change, over 5 year period, in the rate of lost time injuries and fatalities within the targeted higher risk federal jurisdiction industries. Source: Administrative Data |
Decrease of 15% over a five year period (2009-2013) Historical Results: |
Planning Highlights
Use modern approaches and tools to deliver services and achieve compliance in the areas of workplace health and safety, employment standards, and equity
One of the key priorities for the Labour Program is to implement the Strategic Review results announced in Budget 2010. The Labour Program will develop an agenda aimed at modernizing service delivery in all business lines and ensuring efficiency and effectiveness in service delivery and service excellence by fostering a culture of continuous improvement. As part of this Action Plan, an enhanced Quality Assurance Framework will be developed to help improve oversight in Occupational Health and Safety (OHS) investigations. This will be complemented by the implementation of a new Training Strategy framed around training needs identified as part of service modernization, and core mandatory training necessary to perform the functions in OHS, Labour Standards, Fire Protection Services, Employment Equity, the Racism-free Workplace Strategy, and the Government Employees’ Compensation Act.
Provide high quality mediation and conciliation services to assist employers and unions in settling their labour disputes
The Labour Program will be implementing its Succession Plan to replace seasoned Mediation and Conciliation Officers who will be retiring. As well, the Labour Program will be more proactive in the delivery of mediation services.
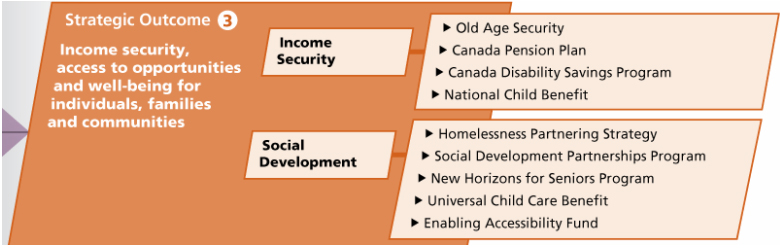
2.3 Strategic Outcome 3: Income security, access to opportunities and well-being for individuals, families and communities
Click here to enlarge
Text version of the Strategic Outcome 3: Income security, access to opportunities and well-being for individuals, families and communities
2.3.1 Program Activity: Income Security
Benefits to Canadians
Income security is essential to the quality of life and well-being of Canadians. The Department provides eligible Canadians with retirement pensions, survivor pensions, disability benefits and benefits for children, through the Old Age Security (OAS) program and the Canada Pension Plan (CPP). A particular focus is vulnerable segments of the population who have difficulty receiving information and assistance through traditional government channels when accessing these benefits.
In addition, this program activity supports low-income families and their children through the National Child Benefit. Through this initiative, the federal government works in partnership with provincial and territorial governments to provide income support, as well as benefits and services, to parents.
Finally, this program activity includes the administration of the Canada Disability Savings Program (CDSP), which helps Canadians with disabilities and their families save for the future.
| Human Resources (FTEs) and Planned Spending ($ millions) | |||||
|---|---|---|---|---|---|
| 2011–2012 | 2012–2013 | 2013–2014 | |||
| FTEs | Planned Spending | FTEs | Planned Spending | FTEs | Planned Spending |
| 361 | 71,485.0 | 356 | 75,415.9 | 356 | 79,726.7 |
| Program Activity Expected Results | Performance Indicators | Targets | ||||||||||||||||||||||||
|---|---|---|---|---|---|---|---|---|---|---|---|---|---|---|---|---|---|---|---|---|---|---|---|---|---|---|
| Canada's seniors have an adequate level of income to maintain a minimum standard of living. | Incidencea and depthb of low income among seniors using the Market Basket Measure (MBM)c. Source: Survey of Labour and Income Dynamics, 2008 |
Historical Results:
Note: There is a 2-year lag in the availability of data for this indicator |
||||||||||||||||||||||||
| Eligible working-aged Canadians with severe and prolonged disabilities have a measure of income security. | Percentage of CPP contributors who have contributory coverage/eligibility for Canada Pension Plan Disability. Source: Administrative Data |
67% Historical Results: Note: There is a 1-year lag in the availability of data for this indicator. |
||||||||||||||||||||||||
| Eligible individuals with severe disabilities (and their families / guardians) open Registered Disability Saving Plans (RDSPs) to save for the future. | Total number of registered accounts opened since the inception of the program. Source: Administrative Data |
48,336 accounts Historical Results: |
||||||||||||||||||||||||
| Canada's families with children have an adequate level of income to maintain their standard of living. | Low-income incidenced, depthe and persistencef for Canadians in families with childreng with income security supporth, using the Market Basket Measure. Source: HRSDC calculations based on the Survey of Labour and Income Dynamics, 2008 |
Historical Results: Note: There is a 2-year lag in the availability of data for this indicator |
||||||||||||||||||||||||
a Low income incidence is the percentage of individuals in any group living in families with a disposable income below their low income threshold. |
||||||||||||||||||||||||||
Planning Highlights
Improve CPP/OAS services and policies for seniors
A number of factors affect the need to ensure the Canada Pension Plan and Old Age Security programs remain responsive to the needs of Canadians now and in the future. These include an aging population, the lingering effects of the recent economic downturn on income security, and the current climate of fiscal restraint. HRSDC will undertake the necessary policy work and program analysis to support the modernization of the Canada Pension Plan and Old Age Security in response to these factors.
2.3.2 Program Activity: Social Development
Benefits to Canadians
The Social Development program activity helps communities and non-profit organizations move forward with their own solutions in support of children, families, seniors, communities and people with disabilities, and prevention and reduction of homelessness.
For children and families, the Department supports Canadians through the Universal Child Care Benefit, which helps Canada's families balance work and family life by financially supporting their child care choices. Additionally, the children and families stream of the Social Development Partnership Program supports not-for-profit organizations in addressing local challenges that individuals and families experience in accessing opportunities to participate in learning, the labour market, and communities.
Through the New Horizons for Seniors Program, the Department helps seniors benefit from and contribute to the quality of life in their communities. Community-based projects address social challenges ‘on the ground’ and recognize communities as the focal point for program and service delivery, while national or regional projects address elder abuse (including financial abuse) through raising awareness, developing and sharing information, and networking.
The Department supports the participation and integration of people with disabilities in all aspects of Canadian society through the Enabling Accessibility Fund and the disability component of the Social Development Partnerships Program (SDPP-D). These programs support a wide range of community-based initiatives that address social issues and barriers faced by people with disabilities.
The Homelessness Partnering Strategy works to prevent and reduce homelessness in Canada by making strategic investments in community priorities. Its planning process promotes cooperation between governments, agencies and community based organizations, and encourages communities to determine the need, develop appropriate strategies and implement projects to find local solutions for homeless people and those at risk of becoming homeless.
In addition, HRSDC will honour the commitment in the 2010 Speech from the Throne to establish a Prime Minister’s Volunteer Award to recognize the enormous contribution that volunteers make to Canada.
| Human Resources (FTEs) and Planned Spending ($ millions) | |||||
|---|---|---|---|---|---|
| 2011–2012 | 2012–2013 | 2013–2014 | |||
| FTEs | Planned Spending | FTEs | Planned Spending | FTEs | Planned Spending |
| 578 | 2,898.3 | 544 | 2,936.3 | 502 | 2,950.1 |
| Program Activity Expected Results | Performance Indicators | Targets |
|---|---|---|
| Homelessness is prevented and reduced. | Number of people placed in longer-term stable housing through Homelessness Partnering Strategy-funded projects. Source: Administrative Data |
Baseline Year |
| Not-for-profit organizations have capacity to respond to existing and emerging social issues for target populations. | Number of partnerships/networks developed by funding recipients as a result of funded projects. (Social Development Partnership Program – Disability component). Source: Administrative Data |
110 Historical Results: |
| Social not-for-profit organizations have capacity to respond to existing and emerging social issues related to people with disabilities. | Number of partnerships/networks developed by funding recipients as a result of funded projects. (Social Development Partnership Program – Disability component). Source: Administrative Data |
138 Historical Results: |
| Seniors are engaged within communities. | Number of seniors participating in or benefiting from New Horizons for Seniors Program-funded projects. Source: Administrative Data |
100,000 Historical results: |
| People with disabilities can access community facilities. | Number of facilities funded through the Enabling Accessibility Fund. Source: Administrative Data |
210 Historical results: |
Ratio of rural funded projects to urban funded projects. Source: Administrative Data |
43.5% Historical results: 2008-2009: |
Planning Highlights
Implement the new approach to the Homelessness Partnering Strategy
The government has renewed the Homelessness Partnering Strategy until 2014 at the current funding level of $134.8 million per year and with a number of key enhancements to be implemented and tracked. The Homelessness Partnering Secretariat, through its strategic partnerships with provinces and territories, communities and other stakeholders, will continue to assist those who are homeless or at risk of homelessness to move towards self-sufficiency, including low-income seniors, people with disabilities, recent immigrants and Aboriginal people in need of support.
Strengthen social partnerships and promote contributions from different sectors of society in the development of new approaches to social challenges
In the 2010 Speech from the Throne, the Government expressed its interest in looking to innovative charities and forward-thinking private-sector companies to partner on new approaches to social challenges. HRSDC will continue to support communities and non-profit organizations in their efforts to tackle local challenges by partnering with innovative charities and forward-thinking private sector companies. HRSDC will also work to implement the Government of Canada's commitment to establish a Prime Minister's Volunteer Award.
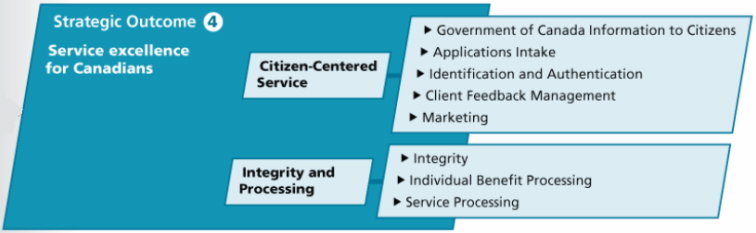
2.4 Strategic Outcome 4: Service Excellence for Canadians
Click here to enlarge
Text version of the Strategic Outcome 4: Service Excellence for Canadians
2.4.1 Program Activity: Citizen-Centred Service
Benefits to Canadians
This program activity aims to improve and integrate government service delivery by providing Canadians one-stop personalized service, and easy access to programs and services across all of its service delivery channels: on the internet, by telephone, in person, and by mail. These service delivery channels provide a platform for dialogue and for building sustained client relationships with Canadians.
Guided by the ongoing feedback of citizens and front-line employees, and in collaboration with partners, the Department continuously refines its service strategies, approaches and offerings so that Canadians can easily and securely access the government information or services they need.
This program activity supports the Government of Canada's efforts to achieve single-window, seamless service delivery to promote timely, positive service experiences and overall client satisfaction.
| Human Resources (FTEs) and Planned Spending ($ millions) | |||||
|---|---|---|---|---|---|
| 2011–2012 | 2012–2013 | 2013–2014 | |||
| FTEs | Planned Spending | FTEs | Planned Spending | FTEs | Planned Spending |
| 5,818 | 431.3 | 5,808 | 430.4 | 5,678 | 422.3 |
| Program Activity Expected Results | Performance Indicators | Targets |
|---|---|---|
| Canadians have one-stop, personalized access to Government of Canada programs and services. | Percentage of in-person clients who were proactively offered targeted information in addition to their original request. Source: Client Satisfaction Survey, 2010 |
Baseline Year |
Percentage of clients satisfied with the quality of service received through each channel. Source: Client Satisfaction Survey, 2010 |
85% Historical Results: 2006: 84% |
|
Number of federal partners under agreement with Service Canada for service delivery. Source: Administrative Data |
11 Historical Results: |
|
| Canadians are able to access information on Government of Canada programs and services online, over the telephone and in-person. | Percentage of availability of Internet (http://servicecanada.gc.ca). Source: Administrative Data |
98% Historical Results: |
Percentage of calls to 1 800 O-Canada answered by an agent within 18 seconds. Source: Administrative Data |
85% Historical Results: |
|
Percentage of Canadians with access to a Service Canada point of service within 50 kilometres of where they live. Source: Administrative Data |
90% Historical Results: |
|
| Canadians receive an accurate review of passport applications by Service Canada agents. | Percentage of passport applications accurately reviewed and authenticated by receiving agents. Source: Administrative Data |
98% Historical Results: |
| Canadians receive a timely response to the feedback they submitted regarding delivery of services by Service Canada. | Percentage of Office for Client Satisfaction feedback replied to within seven working days of receipt. Source: Administrative Data |
100% Historical Results: |
Planning Highlights
The following plans for 2011-2012 support this priority by responding to citizen demands for service delivery that is organized from their perspective and easier to access.
Modernize service delivery and enhance the service delivery channels that Canadians use
Efforts will continue to focus on ensuring that clients are provided with a consistent service experience across all service channels (i.e., internet, telephone, in-person). Clients will be encouraged to take advantage of the electronic services and self-service options when they are seeking information and conducting transactions with the Department. At the same time, a Client Contact Centre approach will be implemented with the aim of resolving enquiries the first time a client contacts the Department. For this year, the work will include enhancing the call centre network for Employment Insurance, Canada Pension Plan and Old Age Security. This will be achieved by improving the Interactive Voice Response System in support of self-service and equipping call-centre staff to perform additional transactions with clients.
Improving the delivery of student financial assistance will be supported through collaborative work with provincial/territorial governments to modernize the delivery of student financial assistance through the use of new technologies, by integrating federal and provincial/territorial student financial assistance programs, and through improvements to the awareness and outreach on incentives for post-secondary education assistance and savings.
Increase the use of client feedback
The Department will strengthen its ability to capture client feedback, such as through the Voice of the Client, to ensure that the needs and experiences of Canadians shape service improvements and inform the modernizing of service delivery.
Increase the scope of services to which Service Canada provides access
In addition to delivering core programs on behalf of HRSDC, work will be undertaken to advance the vision of Service Canada as the service delivery agent for the Government of Canada. This work will include developing a partnership strategy and negotiating and managing service delivery arrangements with other departments.
2.4.2 Program Activity: Integrity and Processing
Benefits to Canadians
In delivering benefits of over $95.8 billion annually, the Department processes applications, establishes the eligibility of Canadians to receive benefits and issues payments. Canadians receive the most value from benefit payments which are timely, secure and accurate. The Integrity and Processing program activity positions the Department to be better able to ensure the timeliness and accuracy of payments, the security and privacy of personal information, and the overall quality of service offerings. The Department continues to modernize the way it handles processing and service delivery functions to help improve the efficiency, accuracy, timeliness and integrity of its operations while lowering the costs to deliver its services. These efforts not only serve to streamline application processes but also increase public confidence and trust in the delivery of government services. These efforts result in savings for the federal government - a total of $701.6 million in savings was realized in 2009–2010. Measured and reported as program savings, these results consist of both direct and indirect savings:
- Direct savings are overpayments and associated penalties that are identified as a result of integrity activities and are subject to recovery.
- Indirect savings are reductions in future program payments (i.e. avoidance of future costs) resulting from the discontinuation of benefits.
The Department maintains management frameworks, processes and risk-based controls to strengthen its processing efficiency and the integrity of its programs by ensuring operational and service compliance. In addition, the Department continues to place significant emphasis on the importance of protecting the information entrusted to it by Canadians.
| Human Resources (FTEs) and Planned Spending ($ millions) | |||||
|---|---|---|---|---|---|
| 2011–2012 | 2012–2013 | 2013–2014 | |||
| FTEs | Planned Spending | FTEs | Planned Spending | FTEs | Planned Spending |
| 8,292 | 638.4 | 8,268 | 636.6 | 8,272 | 637.1 |
| Program Activity Expected Results | Performance Indicators | Targets |
|---|---|---|
| Services and benefits are delivered accurately. | Payment Accuracy of Employment Insurance. Source: Administrative Data |
95% Historical Results: |
Payment Accuracy of Canada Pension Plan. Source: Administrative Data |
95% Historical Results: |
|
Payment Accuracy of Old Age Security/Guaranteed Income Supplement. Source: Administrative Data |
95% Historical Results: |
|
| Services and benefits are delivered securely. | Once identified, percentage of clients notified within 10 business days that their personal information was potentially put at risk. Source: Administrative Data |
100% Historical Results: |
| Services and benefits are delivered in a timely manner. | Percentage of Employment Insurance benefit payments or non-payment notifications issued within 28 days of filing. Source: Administrative Data |
80% Historical Results: |
Percentage of Canada Pension Plan retirement benefits paid within the first month of entitlement. Source: Administrative Data |
90% Historical Results: |
|
Percentage of Old Age Security basic benefits paid within the first month of entitlement. Source: Administrative Data |
90% Historical Results: |
|
Percentage of initial Apprenticeship Incentive Grant payments and non-payment notifications issued within 28 calendar days. Source: Administrative Data |
95% Historical Results: |
|
Percentage of initial Apprenticeship Completion Grant payments and non-payment notifications issued within 28 calendar days. Source: Administrative Data |
95% Historical Results: |
|
Percentage of initial Wage Earner Protection Program payments and non-payment notifications issued within 42 calendar days. Source: Administrative Data |
80% Historical Results: |
|
Percentage of Social Insurance Numbers (SINs) issued in one visit and cards issued within five business days from date of receipt of request (based on complete applications with all supporting documents). Source: Administrative Data |
90% Historical Results: |
|
| Clients are accurately identified for the purpose of receiving the appropriate service or benefit for SIN-based programs. | Amount of program savings estimated from overpayments identified and the avoidance of future costs. Source: Administrative Data |
$730M Historical Results: |
Percentage of clients identified accurately. Source: Administrative Data |
Baseline year |
|
Accuracy rate for legitimate Social Insurance Numbers in the Social Insurance Registry. Source: Administrative Data |
99.9% Historical Results: |
Planning Highlights
The following plans for 2011-2012 will improve the efficiency and integrity of operations and support the Department's priority of modernizing service delivery approaches:
Enhance internal efficiencies through automation of Employment Insurance
By transforming and modernizing its business operations through automation and other process improvements, the Department will ensure there continues to be progress in advancing service excellence. It will work to finalize automation and other re-engineering initiatives to realize the objective of "one client, one workload and one process" for Employment Insurance. There will be further work this year to enhance the electronic services available to individuals and businesses. Increasing the use of automation, including imaging to reduce the reliance on paper handling, will help to reduce the costs of delivering the Employment Insurance program, improve data accuracy and support the integrity of the Department's benefit processing.
Improve Canada Pension Plan and Old Age Security services for seniors
With increases in workload on the horizon as the population ages, the Department will improve Canada Pension Plan and Old Age Security to secure a strong, modernized and sustainable approach to the delivery of benefits for seniors. This work includes a redesign and streamlining of application processes for Canada Pension Plan and Old Age Security and efforts to increase the use of electronic services.
Improve the integrity of operations
The Department will continue to modernize its integrity control framework for the EI, CPP and OAS programs to effectively mitigate program integrity risks. This will be achieved through the further automation of many existing control measures, the continued implementation of risk-based approaches to address program integrity issues, and the enhanced use of information sharing agreements to support these activities. Identity management policies, practices and controls, including initiatives such as information-sharing agreements with provincial vital statistics organizations, will support continued effective administration of the Social Insurance Number and Social Insurance Register.
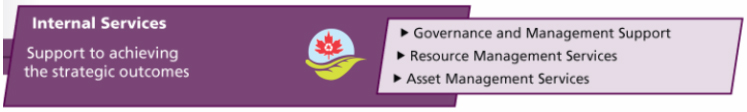
2.5 Internal Services
Click here to enlarge
Text version of the Internal Services
Description
Internal Services support the achievement of the Department's strategic outcomes by providing the resources, guidance, support services, and information necessary to design and deliver its programs and services. The definition of internal services is broad and includes policy development, research, audits, evaluation, planning, risk management, and executive functions, as well as the more traditional corporate services such as information management, information technology, human resources and financial management.
At HRSDC, these services are: Corporate Secretariat, the Chief Financial Officer, Human Resources Services, Strategic Policy and Research, Legal Services, Public Affairs and Stakeholder Relations, Internal Audit Services, Internal Integrity and Security, and Innovation and Information Technology.
The proportion of resources dedicated to internal services across the country reflects the complexity and breadth of the Department’s mandate, as well as the number and diversity of its points of service and service channels. The Department’s decentralized service delivery network is complex and is supported by an equally complex network of internal services, with over 2,000 Internal Services FTEs located outside the National Capital Region.
| Human Resources (FTEs) and Planned Spending (millions of dollars) | |||||
|---|---|---|---|---|---|
| 2011–2012 | 2012–2013 | 2013–2014 | |||
| FTEs | Planned Spending | FTEs | Planned Spending | FTEs | Planned Spending |
| 5,820 | 859.5 | 5,791 | 860.3 | 5,747 | 834.6 |
Planning Highlights
Continue to modernize and integrate internal service functions and systems in order to improve our ability to deliver results for Canadians
In support of ongoing value for money, compliance, and stewardship, HRSDC will transform enabling services by moving to an integrated three-tiered service delivery model for human resources, finance, and information technology services over the next 5 years. This initiative emphasizes self-serve options, and updates the Department's enterprise resource planning system with new tools that provide better support for managing human and financial resources.
Pursuing public service renewal through a healthy and enabled workplace, workforce development and leadership
The Department's approach to people management is built on three core elements: workforce, workplace, and leadership. These principles will help develop the strategies, policies, and guidance HRSDC needs to renew the organization, meet its workforce needs, and implement the government’s agenda. In addition, the Department will improve HR planning and develop standardized tools, training, guides, and awareness sessions to help managers exercise their HR accountabilities.
Strengthen management measures in support of legislative and policy requirements in the areas of privacy, security, and internal integrity
The Department will also work to strengthen its privacy management practices. It will also strengthen its internal integrity and security by updating the departmental Security Plan, implementing the new TBS Policy on Government Security, and developing a new code of conduct for HRSDC through consultations with employees.
Develop a sound multi-year Departmental Investment Plan
Treasury Board requires departments to table an integrated investment plan for their major projects and asset investments over a 5-year time horizon. In times of constrained resources, investment plans allow organizations to focus resources on the areas of greatest importance and risk to promote the timely and cost-effective completion of projects. HRSDC's investment plan will be completed in 2011-2012.
Contribute to the Federal Sustainable Development Strategy
HRSDC is a participant in the Federal Sustainable Development Strategy (FSDS) and contributes to the fourth goal of “Shrinking the Environmental Footprint of Government” and other areas related to Greening Government Operations (GGO) through Internal Services. The Department contributes to the following GGO target areas:
- Green procurement;
- E-waste, printing units, paper consumption and green meetings; and,
- Greenhouse gas emissions (from vehicle fleet only).
For additional details on HRSDC’s GGO activities, please see http://www.rhdcc-hrsdc.gc.ca/eng/publications_resources/dpr/rpp/index.shtml