
Common menu bar links
Breadcrumb Trail
ARCHIVED - Transport Canada
 This page has been archived.
Archived Content
Information identified as archived on the Web is for reference, research or recordkeeping purposes. It has not been altered or updated after the date of archiving. Web pages that are archived on the Web are not subject to the Government of Canada Web Standards. As per the Communications Policy of the Government of Canada, you can request alternate formats on the "Contact Us" page.
Minister’s Message
 As Canada’s Minister of Transport and Infrastructure, I am pleased to present Transport Canada’s Report on Plans and Priorities for 2009-2010. It describes the department’s commitment to do our part in
strengthening Canada’s economy and delivering a cleaner, safer and more secure national transportation system.
As Canada’s Minister of Transport and Infrastructure, I am pleased to present Transport Canada’s Report on Plans and Priorities for 2009-2010. It describes the department’s commitment to do our part in
strengthening Canada’s economy and delivering a cleaner, safer and more secure national transportation system.
In these uncertain times, Transport Canada is well placed to help improve Canada’s economy. We are working to help to boost the economy and create jobs for Canadians by making significant improvements to the transportation systems they use.
Infrastructure is key to a prosperous Canada. We will speed up and fund much-needed projects through the Building Canada plan and the new funds announced in Budget 2009, including the Infrastructure Stimulus Fund and the Green Infrastructure Fund. We will continue to invest in passenger rail services. We will also continue to invest in our gateways and trade corridors as well as vital border crossings, such as the one at Windsor-Detroit, so that Canadian goods and services reach the United States, Europe, and Asia as quickly as possible. We will also look at the North’s growing transportation infrastructure needs, while protecting the fragile Arctic environment.
Transportation has always played an important role in connecting Canadians. They must continue to drive to work, transport goods and reach other communities in safety and without fear. This is why Transport Canada will promote and monitor industry best practices, with a focus on improved railway safety and aviation security.
Transport Canada, along with other departments, will help improve the overall health of Canadians by introducing and enforcing laws to reduce air pollution linked to transportation. We will also continue to work with international partners to meet the challenge of global warming.
Transport Canada will deliver results for Canadians. We will work to improve Canadians’ prosperity, safety, security, environment and quality of life. These are our priorities; this is our plan.
John Baird, P.C., M.P.
Minister of Transport and Infrastructure
Section I – Departmental Overview
1.1 Summary Information
1.1.1 Raison d’être
Transport Canada is responsible for the Government of Canada’s transportation policies and programs. The department has the added responsibility, under the Canada Transportation Act, to monitor the ongoing health of the national transportation system. As such, while not directly responsible for all aspects or modes of transportation, the department plays a leadership role to ensure that all parts of the transportation system work together effectively.
A transportation system in Canada that is recognized worldwide as safe and secure, efficient and environmentally responsible.
The department’s vision of a sustainable transportation system is one that integrates and balances social, economic and environmental objectives. Our vision is guided by the following principles:
- highest practicable safety and security of life and property – guided by
performance-based standards and regulations when necessary; - efficient movement of people and goods to support economic prosperity and a sustainable quality of life – based on competitive markets and targeted use of regulation and government funding; and
- respect for the environmental legacy of future generations of Canadians – guided
by environmental assessment and planning processes in transportation decisions
and selective use of regulation and government funding.
1.1.2 Responsibilities
From opening the continent to building railways, ports, airports, the Seaway and the
Trans-Canada Highway, transportation has been the key to building Canada. For the first hundred years of Confederation, the federal role was to build, maintain, subsidize and regulate the infrastructure and services needed to meet the needs of a new nation. Managing change in the transportation sector has been a recurrent theme for Transport Canada in recent decades.
In the mid-1980s, guided by its landmark document, Freedom to Move, the department initiated major economic deregulation measures in the rail, air and trucking sector. Transport Canada was also a champion of program review in the mid-1990s and transformed itself from an operator and regulator of key transportation infrastructure and services with over 20,000 employees to a
policy, regulatory and landlord organization with less than 25 per cent of its former workforce. The operation of ports, airports, the Seaway, and the air navigation system was transferred to not-for-profit entities, and annual subsidies were cut by $1 billion.
In February 2006, Transport Canada became part of the Transport, Infrastructure and Communities portfolio, which also includes Infrastructure Canada, three agencies operating at arm’s length from the department, 16 Crown corporations (e.g. VIA Rail, Marine Atlantic) and over 40 shared-governance organizations (e.g. Port of
Montreal, Vancouver International Airport). The creation of this portfolio has provided an unprecedented opportunity to integrate transportation policies and infrastructure funding programs (e.g. $2.1 billion for gateways and border crossings). Under this portfolio, the Minister heads a complex organizational structure, and
is responsible for administering over 60 statutes.
1.1.3 Strategic Outcomes and Program Activity Architecture
In this report, Transport Canada details its plans, priorities and expected results against the new Program Activity Architecture and Performance Management Framework, adopted in 2009-2010, for the first time. The new Program Activity Architecture strengthens Transport Canada’s ability to allocate resources, monitor results and realign spending to the highest priority programs, and reflects the department’s vision, focusing on four strategic outcomes:
- an efficient transportation system;
- a clean transportation system;
- a safe transportation system; and
- a secure transportation system.
Fifteen new program activities are aligned to these four strategic outcomes, with one additional program activity related to internal services. This new Program Activity Architecture structure contributes to the broader Government of Canada outcome areas of strong economic growth; a fair and secure marketplace; an innovative knowledge-based economy; a clean and healthy environment; and safe and secure communities.

1.1.4 2008-2009 and 2009-2010 Program Activity Crosswalk
In the past, Transport Canada reported on three strategic outcomes, with safety and security combined into a single results area. Given the growing importance of the department’s security mandate, and the difference in measuring performance in safety and security, they have each become separate strategic outcome areas. The wording of all strategic outcomes has also been streamlined and clarified.
Other changes took place within the program activities. The new Program Activity Architecture includes not three, but 15 separate and distinct program activities that cover all transportation policies and programs, as well as one program activity for internal services. Program activities are now largely defined by transportation mode (air, marine, rail, road). Program sub-activity levels are defined by function (regulatory framework, oversight, capital support). We believe this new Program Activity Architecture is clear and concise, and when combined with the new performance measurement framework, the department can better evaluate the total cost of each program and the benefits or results they deliver for Canadians.
| 2008-2009 | 2009-2010 | |
|---|---|---|
|
An efficient transportation system that contributes to Canada’s economic growth and trade objectives
|
 |
An efficient transportation system
|
|
A safe and secure transportation system that contributes to Canada’s social development and security objectives
|
|
A safe transportation system
|
 |
A secure transportation system
|
|
|
An environmentally responsible transportation system that contributes to Canada’s sustainable development objectives
|
|
A clean transportation system
|
|
||
1.2 Planning Summary
| 2009-10 | 2010-11 | 2011-12 |
|---|---|---|
| 1,476 | 1,427 | 1,080 |
The financial resources table above provides a summary of the total planned spending for Transport Canada for the next three fiscal years. For more detailed information about planned spending including adjustments, see Transport Canada’s website on Planned Spending.
| 2009-10 | 2010-11 | 2011-12 |
|---|---|---|
| 5,314 | 5,250 | 5,130 |
The human resources table above provides a summary of the total planned human resources for Transport Canada for the next three fiscal years. For more detailed information, please see the department’s Integrated Human Resources Plan.
1.2.3 Summary Tables by Strategic Outcomes
| Performance Indicators | Targets |
|---|---|
| Level of productivity of transportation sector | Increase by 2.5% to 5% relative to 2009 baseline (Productivity Index >113 in 2014) |
| Cost level in the transportation sector | Growth in unit costs does not exceed 11% over a 5-year horizon relative to the 2009 baseline (Cost Index < 111 in 2014) |
| Program Activity 2 | Expected Results | Forecast Spending ($ millions) |
Planned Spending ($ millions) |
Alignment to Government of Canada Outcomes | ||
|---|---|---|---|---|---|---|
| 2008-09 | 2009-10 | 2010-11 | 2011-12 | |||
| Transportation Marketplace Frameworks | A competitive and financially viable transportation sector through effective transportation marketplace frameworks | 13 | 9 | 9 | 8 | A fair and secure marketplace |
| Gateways and Corridors | Enhanced level of trade through Canada’s strategic gateways and trade corridors | 80 | 658 | 832 | 527 | Strong economic growth |
| Transportation Infrastructure | Modern transportation system | 13 | 48 | -80 | -106 | Strong economic growth |
| Transportation Innovation | An innovative transportation system | 13 | 10 | 9 | 6 | An innovative and knowledge-based economy |
| Total Planned Spending* | 119 | 725 | 770 | 435 | ||
* Due to rounding, columns may not add to the totals shown.
| Performance Indicators | Targets |
|---|---|
| Level of greenhouse gas emissions from the transportation sector measured in tonnes of CO2 equivalent | Greenhouse gas emission levels from the transportation sector reduced consistent with government targets as identified in Turning the Corner |
| Level of air pollutants produced by the transportation sector | Level of air pollutants from the transportation sector reduced consistent with targets to be established under the Clean Air Agenda |
| Program Activity 2 | Expected Results | Forecast Spending ($ millions) |
Planned Spending ($ millions) |
Alignment to Government of Canada Outcomes | ||
|---|---|---|---|---|---|---|
| 2008-09 | 2009-10 | 2010-11 | 2011-12 | |||
| Clean Air from Transportation | A transportation system that is less intensive in its emissions of greenhouse gases and air pollutants | 205 | 34 | 25 | 6 | A clean and healthy environment |
| Clean Water from Transportation |
Canadian waters protected from discharges of transportation pollutants Transfer of alien aquatic species into domestic water through ship ballast water prevented |
1 | 6 | 6 | 6 | A clean and healthy environment |
| Environmental Stewardship of Transportation | Transport Canada aware of, and responsive to environmental impacts of its activities | 33 | 44 | 8 | 8 | A clean and healthy environment |
| Total Planned Spending* | 240 | 84 | 39 | 20 | ||
* Due to rounding, columns may not add to the totals shown.
| Performance Indicators | Targets |
|---|---|
| Number/rate of accidents or fatalities by mode | Maintain or improve accident/fatality rates by mode, based on each mode’s strategic objectives |
| Degree of public confidence in the safety of the transportation system | Maintain or improve public confidence in the safety of transportation, based on the strategic objectives of each mode |
| Program Activity 2 | Expected Results | Forecast Spending ($ millions) |
Planned Spending ($ millions) |
Alignment to Government of Canada Outcomes | ||
|---|---|---|---|---|---|---|
| 2008-09 | 2009-10 | 2010-11 | 2011-12 | |||
| Aviation Safety | A safe civil aviation system | 257 | 241 | 243 | 240 | Safe and secure communities |
| Marine Safety | A safe marine transportation system | 89 | 75 | 68 | 75 | Safe and secure communities |
| Rail Safety | A safe rail transportation system | 30 | 28 | 28 | 29 | Safe and secure communities |
| Road Safety | Safe roads | 31 | 35 | 31 | 29 | Safe and secure communities |
| Transportation of Dangerous Goods | Public safety during the transportation of dangerous goods | 14 | 14 | 14 | 14 | Safe and secure communities |
| Total Planned Spending* | 420 | 393 | 384 | 387 | ||
* Due to rounding, columns may not add to the totals shown.
| Performance Indicators | Targets |
|---|---|
| Level of credibility of Canada’s transportation security internationally | No countries impose special security measures on goods and people arriving from Canada |
| Degree of public confidence in the security of the transportation system | Maintain or improve confidence in the security of the transportation systems, based on the strategic objectives of each mode |
| Program Activity 2 | Expected Results | Forecast Spending ($ millions) |
Planned Spending ($ millions) |
Alignment to Government of Canada Outcomess | ||
|---|---|---|---|---|---|---|
| 2008-09 | 2009-10 | 2010-11 | 2011-12 | |||
| Aviation Security | A secure aviation system | 63 | 62 | 41 | 43 | Safe and secure communities |
| Marine Security | A secure marine transportation system | 28 | 29 | 12 | 16 | Safe and secure communities |
| Surface and Intermodal Security | Urban transit operators aware of and adopt voluntary and regulatory requirements when latter are in place | 78 | 11 | 7 | 6 | Safe and secure communities |
| Total Planned Spending* | 169 | 102 | 60 | 65 | ||
* Due to rounding, columns may not add to the totals shown.
1.3 Risks and Departmental Priorities
1.3.1 Operating Environment
Transport Canada’s responsibilities are undertaken in an operating environment that includes many services, jobs and assets important to Canadians. For example:
- The transportation sector accounts for approximately 12 per cent of Canada’s Gross Domestic Product and moves over $1 trillion worth of goods to market and 1.8 billion passengers each year.
- 900,000 Canadians hold transportation-related jobs.
- Canada’s vast transportation network is made up of 38,000 km of national highways; over 46,000 ships; 17.6 million road vehicles; 50,000 km of rail;
30,000 aircraft; and 1,600 aerodromes.
Since transportation is such an important part of Canadian life, the department must always be mindful of risks that might affect its priorities and planned program results. Over this planning period, Transport Canada faces a number of significant risks, challenges and opportunities.
1.3.2 Economic and Transportation Competitiveness Risks
Globalization and influences from new Asian economic powers are transforming Canada’s manufacturing process and trade patterns. Today, success in international commerce depends on integrated production or "value" chains that maximize efficiency. This means that rapid access to and from Canadian markets is essential if Canada is to take part in modern manufacturing and trade.
Canada is facing congestion problems, capacity constraints, and a lack of infrastructure at several key border points, notably the West Coast and the Windsor-Detroit international crossing. Transport Canada’s gateways and corridors approach aims to position Canada as an efficient and reliable transportation choice to connect North America to the world. This systems-based approach to transportation planning takes advantage of trade patterns, geography, infrastructure and partnerships to address congestion, inefficiencies and other impediments to moving goods and people efficiently. Improving Canada’s gateways and corridors will continue to be a high priority for the department over the next three years.
Other risks to Canada’s competitiveness include shifts in the global economy that may prevent our transportation sector from accessing new markets or finding new investors. Transport Canada will make these international and multi-lateral agreements a priority, particularly those related to air service rights, and will consider increased foreign investment in the airline industry.
Finally, 80 per cent of multinational executives believe that poor infrastructure quality affects Canada as an investment destination (see Building Canada – Modern Infrastructure for a Strong Canada). In addition, there is great economic potential in Canada’s North because of rapid increases in global commodity prices, but the lack of transportation infrastructure is putting this development at risk.
Given current economic circumstances, Transport Canada, with Infrastructure Canada, will implement measures aimed at accelerating funding, fast-tracking project approvals, reducing duplication, and streamlining federal processes for transportation infrastructure projects in partnership with provincial, territorial and municipal governments. This will save money for companies; attract or keep investments in Canada’s industrial, service and commodity markets; and create jobs during an economic slowdown. The department will also support Canada’s Northern Strategy over the next three years by identifying future transportation infrastructure needs, and by taking steps to protect the Arctic’s sensitive environment.
Operational Priority #1: Advancing Trade and Competitiveness Through the Transportation System
Transportation Infrastructure:
- Accelerating existing Building Canada transportation infrastructure projects and speeding up approvals for new projects
- Identifying future transportation infrastructure needs in Canada’s North
Gateways and Corridors:
- Continuing to implement Asia-Pacific Gateway and Corridors Initiative
- Developing and implementing an Ontario-Quebec Continental Gateway and Trade Corridor Strategy as well as the Atlantic Gateway Strategy
- Advancing work on the Windsor-Detroit Crossing
Transportation Marketplace Frameworks:
- Concluding Canada-EU Air Transport Agreement
- Considering increased foreign investment in the airline industry
1.3.3 Balancing Transportation Sector Expansion With Canada’s Environment
Canadians expect all levels of government to protect their environment and health while increasing Canada’s economic prosperity. Economic growth is usually linked to transportation sector growth, which can increase air, water and noise pollution and reduce farmland and wildlife habitats. The federal government must facilitate vital economic growth through efficient environmental approaches. As the department works to advance trade and competitiveness in the transportation sector, it must balance the full impact of its policies and work with its partners to reduce or prevent harm to the environment.
Canadians are very concerned about the quality of our air. The transportation sector is responsible for about 26 per cent of all greenhouse gas emissions in this country. Addressing this issue is a challenge because:
- there are many different sources of transportation-related emissions;
- the responsibility for regulating transportation is shared among many levels
of government; - North America’s integrated transportation system requires cooperation among international partners; and
- transportation operators, consumers and users must be part of the solution.
Operational Priority #2: Advancing the Clean Air Agenda Through New Transportation Emission Regulations
- Supporting the development of a common North American light-duty motor vehicle fuel efficiency standard
- Rail emissions regulations
- Marine air emissions regulations
- Aviation and marine sectors emissions negotiations with international bodies
1.3.4 Growth, Globalization, and Safety Impacts
A safe and secure transportation system is vital to Canada’s economic competitiveness, standard of living and relationships with global trading partners. Transport Canada’s challenge is to support transportation sector growth in a globally competitive environment, while further reducing accident rates.
In order to continue making improvements to Canada’s high safety standards, a stronger, systemic safety culture and more accountability from transportation sector operators is needed to succeed. That is why Transport Canada, working closely with industry in all modes, will take innovative approaches to managing safety risks. In particular, reducing safety risks and increasing accountability in the rail industry, as well as streamlining processes under the Navigable Waters Protection Act, will be priorities for the department over the next three years.
Operational Priority #3: Strengthening Transportation Safety
- Improving railway safety
- Streamlining the regulation of navigable waters
- Advancing and promoting Safety Management Systems
1.3.5 The Evolving Threat of Terrorism
The tragic events of September 11, 2001, followed by the Madrid and London bombings, led to real changes in Canada’s approach to national security. Transport Canada had to instantly assume new and broader security responsibilities. The department has relied on its strong links with industry to implement a new security agenda.
Both domestic and international intelligence confirm that Canada is still viewed as a target for potential attacks, and that terrorist methods continue to evolve. The possibility of an attack on our transportation system puts Canada’s access to continental markets at risk. This is why Transport Canada must respond to the threat of terrorism and the security concerns of our major trading partners, while keeping security policies from becoming trade barriers and obstacles in this time of economic uncertainty.
Over the next three years, the department will focus on the aviation sector, to reduce priority security risks and bring Canada’s security measures in line with key international partners.
Operational Priority #4: Strengthening Transportation Security
- Enhancing screening of passengers and non-passengers
- Implementing air cargo security screening program
1.3.6 Governance Pressures
While accountability, sound governance and strong management practices are always part of a solid economic foundation, their importance to Canadians is greater during times of financial uncertainty. In 2008-2009, Transport Canada completed its strategic review, identifying ways to streamline its operations, realign its activities and transform its organization to deliver better results for Canadians. Over the coming planning period, the department will begin to implement the findings of the review, as well as take action to integrate and improve governance throughout the Transport, Infrastructure and Communities portfolio.
Management Priority #1: Enhancing Portfolio Governance Through Integrated Management Strategies
- Improving portfolio management of Crown corporations specifically with respect to challenges faced by Canada Post Corporation, Federal Bridge Corporation Ltd., Ridley Terminals Inc. and Marine Atlantic Inc.
- Implementing the department’s strategic review including the development of action plans
- Promoting integration by establishing joint Transport Canada/Infrastructure Canada processes and initiatives with respect to governance, corporate planning, public service renewal, and reducing the government’s "web of rules"
1.3.7 Transport Canada’s Corporate Risk Profile and Changing Workforce Demographics
Transport Canada’s Executive Management Committee is using the 2008 Corporate Risk Profile to identify ways to manage and prevent risk. The profile identifies human and knowledge capital as the highest risk: without any action, the department will not be able to attract, develop and retain enough staff with the necessary competencies and knowledge to fully and effectively support its operations and responsibilities.
Demographic trends
- More than 57% of Transport Canada employees are now over the age of 45, with an average age of 46.0 years old
- About 9% of the department’s employees have 30+ years of pensionable service and nearly 13% are eligible to retire
- About 79% of Transport Canada’s executive workforce is aged over 45, with an average age of 51; and
- About 25% of the department’s executives are eligible to retire in 2009
Transport Canada, like the rest of the federal public service, faces major human resources pressure related to an aging workforce and a shortage of younger employees to replace those who retire. These general trends, along with specific risks linked to shortages or high turnover in certain specialty groups, are shaping the department’s plans for renewing its workforce.
The Corporate Risk Profile also supports Transport Canada’s Executive Team decision-making with respect to internal audit planning and other types of integrated business planning.
Management Priority #2: Supporting Public Service Renewal and Improving People Management
- Implementing Transport Canada’s Public Service Renewal Action Plan on planning, recruitment, development and enabling infrastructure
- Pursuing the implementation of the Transport Canada’s People Management Strategy (including the Diversity Action Plan) and the Integrated Human Resources Plan
1.4 Contribution of Priorities to Strategic Outcomes
The following figure illustrates how the department’s four operational priorities and two management priorities are related to the department’s strategic outcomes.
Figure 3: Contribution of Priorities to Strategic Outcomes
| Strategic Outcome 1: An Efficient Transportation System | Strategic Outcome 3: A Safe Transportation System |
|
Advancing trade and competitiveness through the transportation system Ongoing 3 |
Strengthening transportation safety Ongoing 3 |
| Strategic Outcome 2: Clean Transportation System | Strategic Outcome 4: A Secure Transportation System |
|
Advancing the Clean Air Agenda through new transportation emission regulations Ongoing 3 |
Strengthening transportation security Ongoing 3 |
| Internal Services (supporting all four Strategic Outcomes) | |
|
Enhancing portfolio governance through integrated management strategies New |
Supporting public service renewal and improving people management New |
1.5 Expenditure Profile
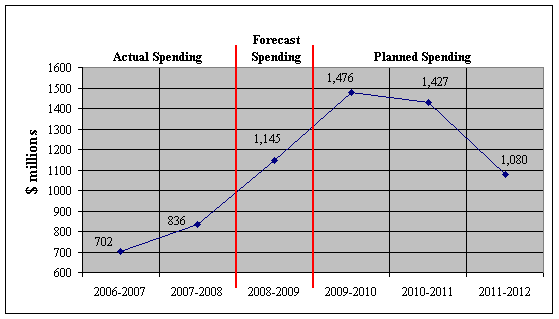
For the 2009-2010 fiscal year, Transport Canada plans to spend $1,476 million to meet the expected results of its programs activities and contribute to its strategic outcomes. This represents a net increase in spending of $331 million over the 2008-2009 forecast spending level of $1,145 million.
The difference is related primarily to changes in several grants and contributions programs. Specifically, with the implementation of Gateway and Borders Crossing projects and the continuation of the Asia Pacific Gateway Corridor Initiative, there is a planned increase of $557 million over the 2008-2009 fiscal year. This increase is offset in part by a decline in other spending, including Transit-Secure – a decrease of $72 million in 2009-2010 over the previous fiscal year – as well as the ecoauto Rebate Program – a decrease of $177 million in 2009-2010 over the previous fiscal year.
Looking forward, the overall planned spending for Transport Canada is expected to decrease from $1,476 million in 2009-2010, to just under $1,427 million in 2010-2011, then decline again to $1,080 million in 2011-2012. These spending reductions, particularly in 2011-2012, are due to major initiatives nearing completion, such as Gateway and Borders Crossing projects, the Asia Pacific Gateway Corridor Initiative, the Port Divestiture Fund and security spending for the 2010 Olympics.
In 2008, Transport Canada completed an in-depth Strategic Review of the funding, relevance and performance of all its programs to determine value for money and results for Canadians. The recommendations of this Strategic Review were submitted to Treasury Board for approval in the fall of 2008. It is expected that the results of this Strategic Review, along with the related implementation activities, will be reflected in future reporting to Parliament.
1.5.1 Departmental Spending Trend
Figure 4 shows Transport Canada’s expenditures (actual, forecast and planned) from 2006-2007 to 2011-2012. The trend shows a gradual increase in actual spending from $702 million in 2006-2007, to $836 million in 2007-2008, and with a forecast of $1,145 million for 2008-2009. The increased spending over this period is attributable to some of the department’s major initiatives including the ecoauto Rebate Program, the Asia Pacific Gateway Corridor Initiative, and Transit-Secure. As described in Section 1.5, Transport Canada planned spending is expected to peak in 2009-2010 at $1,476 million, and then decline over the following two fiscal years to $1,427 million in 2010-2011 and $1,080 million in 2011-2012.
Figure 4: Spending Trend for Transport Canada
1.5.2 Allocation of Funding by Strategic Outcome
The following table displays the allocation of funding according to Transport Canada’s four strategic outcomes, as well as the program activity related to internal services. For more detailed information about Transport Canada’s spending including adjustments following Main Estimates, non-respendable revenues, and estimated cost of services received without charge, see Transport Canada’s website on Planned Spending.
| Strategic Outcomes (and Internal Services) |
Forecast Spending 2008-2009 ($ millions) |
Planned Spending 2009-2010 ($ millions) |
Planned Spending 2010-2011 ($ millions) |
Planned Spending 2011-2012 ($ millions) |
|---|---|---|---|---|
|
An Efficient Transportation System |
119 | 725 | 770 | 435 |
| A Clean Transportation System | 240 | 84 | 39 | 20 |
| A Safe Transportation System | 420 | 393 | 384 | 387 |
| A Secure Transportation System | 169 | 102 | 60 | 65 |
| Internal Services | 197 | 172 | 173 | 173 |
| Total * | 1,145 | 1,476 | 1,427 | 1,080 |
* Due to rounding, columns may not add to the totals shown.
As shown in figure 5, Transport Canada’s forecast spending for 2009-2010 is allocated primarily to the strategic outcome of an efficient transportation system. As described in section 1.5, this is mostly due to the increased spending in the Gateways and Corridors Program Activity.
Figure 5: Allocation of Funding by Strategic Outcome
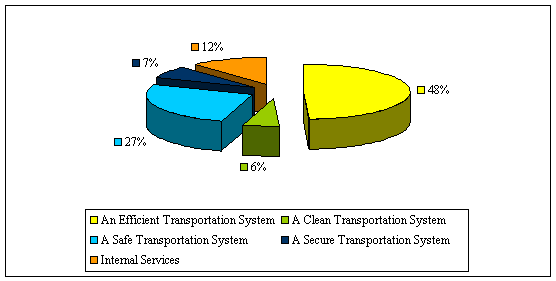
Note: Internal Services is a program activity.
1.5.3 Voted and Statutory Items
The following table illustrates the way in which Parliament approved Transport Canada resources, and shows the changes in resources derived from supplementary estimates and other authorities.
| Vote # or Statutory Item (S) 4 | Truncated Vote or Statutory Wording | 2008-09 Main Estimates ($ millions) |
2009-10 Main Estimates ($ millions) |
|---|---|---|---|
|
Vote 1 |
Operating expenditures |
315 |
331 |
| Vote 5 | Capital expenditures | 78 | 81 |
| Vote 10 | Grants and contributions | 472 | 861 |
| (S) | Contributions to employee benefit plans | 67 | 66 |
| (S) | Northumberland Strait Crossing subsidy payment under the Northumberland Strait Crossing Act | 55 | 58 |
| (S) | Payments in respect of St. Lawrence Seaway agreements under the Canada Marine Act | 42 | 48 |
| (S) | Payments to Canadian National Railway Company in respect of the termination of the collection of tolls on the Victoria Bridge, Montreal and for rehabilitation work on the roadway portion of the Bridge |
3 | 3 |
|
Total* Department |
1,032 |
1,448 |
|
* Due to rounding, columns may not add to the totals shown