Results from the 2007 census of EXs and feeder group (core public administration); final report
Archived information
Archived information is provided for reference, research or recordkeeping purposes. It is not subject à to the Government of Canada Web Standards and has not been altered or updated since it was archived. Please contact us to request a format other than those available.
Table of Contents
- Executive summary
- 1. Introduction
- 2. Career goals/mobility
- 3. Retention/retirement
- 4. Learning and development
- 4.1 Experience in different areas
- 4.2 Development requirements
- 4.3 Frequency of development exercises
- 4.4 Interest in leadership development programs
- 4.5 Barriers to participating in leadership development programs
- 4.6 Language training as a barrier to progression
- 4.7 Barriers to learning objectives
- 4.8 Participation in leadership development programs
- 5. Profile of census respondents
- Appendix A: Detailed methodology
- Appendix B: List of classifications included in census population
Executive summary
The workforce of the Public Service of Canada is aging, posing a challenge for future human resource planning, particularly in senior managerial, professional and executive positions. This census was undertaken to improve the government's understanding of the executive community and feeder groups to this community See footnote 1, and to support the strategic management and renewal of the EX community. The EX and Feeder Group Census-Core Public Administration See footnote 2 was completed as a self-administered web-based survey from June through July 2007. The total number of employees within the sample frame for the census was close to 35,000 individuals: including 3,823 EXs, 4,797 EX equivalents, and 25,858 EX minus 1s and minus 2s. 15,990 employees responded to the census, for an overall response rate of 46 per cent. The response rate for EXs, EX minus 1s/ minus 2s, and EX equivalents was 57 per cent, 47 per cent and 36 per cent respectively. A separate agency census (Schedule V) is forthcoming.
Key census findings can be summarized as follows:
Mobility
Career progression is an important goal for many feeder groups and executives. Most executives expressed an interest in progressing to a higher level position, and this interest is only somewhat less marked among feeder group members (of whom roughly three-quarters expressed at least some interest in advancement). Interest in progression is particularly important for younger employees. Roughly half of feeder group members and EXs indicate that attaining a higher position is a high priority for the next three years. Key factors motivating an interest in progression include a desire for greater challenges, as well as the opportunity to participate in more senior-level decision making, along with increased financial compensation and interesting work.
Fewer EX equivalents are very interested in becoming an executive compared to EX minus 1s. Those who are not interested are more satisfied with their current job, and working environment and substantive subject matter work. They also feel that EX compensation is not adequate.
Executives are considerably more apt to feel ready to progress in their career immediately, while feeder group members feel that they require some time to prepare (over the next three years), to obtain more formal development and additional work experience. The need to meet language requirements, and current personal situations are also cited by feeder group members as important factors in feeling they are not ready to advance their careers.
Concern over work-life balance for both feeder groups and executives and satisfaction with their current position are reasons some choose not to seek advancement. More EXs than feeders mentioned satisfaction with their current job. Other reasons include managerial and people management responsibilities, removal from substantive areas of expertise, lack of adequate compensation and language requirements.
Retention
Meaningful work is the most positive or important aspect of working in the Public Service for both feeder groups and executives. Meaningful work was stressed by scientific and professional employees, EX-04s and 05s and older employees. For executives, the opportunity to serve Canadians is also a key component of their Public Service career, while job security and work-life balance are more important for feeder group members.
While work-life balance was identified as an important or positive aspect of a Public Service career by only a small portion of executives, and primarily at the EX-01 level, it is also regarded as one of the greatest challenges facing executives by more than half of executives and feeder groups. Work-life balance was stressed by women and those in their 40s. Other key challenges executives face according to both executives and feeder group members include the ability to attract and retain talent and heavy workloads, followed by people management and language requirements.
Executives and feeder group members tend to believe that their compensation package (e.g., salary, benefits, pension and leave) in the federal Public Service is better than that available to employees in small to medium private sector organizations, or within provincial and municipal governments, but not as good as packages available to employees in large private sector organizations, particularly for EX-03s and EX-04s. In general, EX equivalents are less positive than other feeder group members in their rating of their total compensation package.
Most executives and feeder group members plan on remaining in the Public Service until their retirement, although feeder group members are somewhat less certain of this. Of the small number of employees intending to leave before retirement, bureaucracy, more meaningful work and better use of education are the three top reasons.
The opportunity to work on an interesting and meaningful project is the most likely incentive to stay on in the Public Service (instead of retiring), followed by promotion or alternate work arrangements. Executives would be particularly motivated by an opportunity to help with transition through mentoring, coaching and knowledge transfer. The most senior EXs (EX-04s and EX-05s) and older employees are more inclined to extend their career if requested from senior management. Primary reasons to return to the Public Service after retirement include employment opportunities that would not affect the receipt of their pension, and paid work as a mentor or coach in the Public Service. It seems that pension plan considerations are paramount in any decision to move in and out of the Public Service.
Learning and development
EX and feeder group members most often report having the most extensive experience in the areas of operations and policy. Feeder group members identify a need for development in a wide range of areas with parliamentary relations, international perspectives, language training and senior management exposure topping the list. A lack of access to language training is a significant concern for a minority of respondents (although more marked among feeder groups). This is a much greater concern for all feeder equity group members and regional employees.
Participation in learning events (i.e., presentations, conferences, workshops) and classroom training is prevalent among most feeder group members and executives, and most report receiving regular, constructive feedback on their performance.
Many express interest in participating in leadership development programs, either offered by departments or corporately. Despite this interest, many feel that they are simply too busy at work to pursue or participate in programs available. Being too busy at work is also seen as a barrier to reaching objectives identified by feeder group members and executives in their learning plan. Furthermore, lack of awareness of development programs clearly represents additional barriers to participation in development programs.
Conclusion
In short, the census findings demonstrate that:
- Most current and potential executives in the Public Service are interested in furthering their careers through promotion. As well, most express an interest and intention to pursue their Public Service career until retirement.
- Executives and those in the feeder groups are motivated by meaningful work. In fact, many could be persuaded to extend their career or return following retirement by interesting and meaningful projects, or by the opportunity to help guide transitions. They would not, however, entertain any opportunities that jeopardize their pension.
- Work-life balance represents an important challenge; one which may discourage some from seeking advancement. Work-life balance is seen to be a positive aspect of working in the Public Service for feeder groups but not for the EX cadre. In fact it appears to be becoming a deterrent at the EX level. New and younger EXs want work-life balance.
- Heavy work-loads, management responsibilities/people management issues (e.g., difficulties attracting and retaining talent) are also seen as challenges or areas of frustration.
- Commitment to a public service career is greater than in 2002 feeder study.
- While large numbers are interested in promotions, many cite development needs to progress.
- Language requirements and access to language training present a challenge for some feeder group members that limit or delay their career progression.
- Drivers for each group (EX, equivalents and feeders) and demographic variables (e.g., age, life stage) are different. We cannot brand or manage the talent of these segments in the exact same way.
Return to footnote reference 1 Feeder group is defined as including EX equivalents, EX minus 1s, and EX minus 2s.
Return to footnote reference 2 Organizations included in the Financial Administration Act, Schedule I and IV.
Executive summary
The workforce of the Public Service of Canada is aging, posing a challenge for future human resource planning, particularly in senior managerial, professional and executive positions. This census was undertaken to improve the government's understanding of the executive community and feeder groups to this community See footnote 1, and to support the strategic management and renewal of the EX community. The EX and Feeder Group Census-Core Public Administration See footnote 2 was completed as a self-administered web-based survey from June through July 2007. The total number of employees within the sample frame for the census was close to 35,000 individuals: including 3,823 EXs, 4,797 EX equivalents, and 25,858 EX minus 1s and minus 2s. 15,990 employees responded to the census, for an overall response rate of 46 per cent. The response rate for EXs, EX minus 1s/ minus 2s, and EX equivalents was 57 per cent, 47 per cent and 36 per cent respectively. A separate agency census (Schedule V) is forthcoming.
Key census findings can be summarized as follows:
Mobility
Career progression is an important goal for many feeder groups and executives. Most executives expressed an interest in progressing to a higher level position, and this interest is only somewhat less marked among feeder group members (of whom roughly three-quarters expressed at least some interest in advancement). Interest in progression is particularly important for younger employees. Roughly half of feeder group members and EXs indicate that attaining a higher position is a high priority for the next three years. Key factors motivating an interest in progression include a desire for greater challenges, as well as the opportunity to participate in more senior-level decision making, along with increased financial compensation and interesting work.
Fewer EX equivalents are very interested in becoming an executive compared to EX minus 1s. Those who are not interested are more satisfied with their current job, and working environment and substantive subject matter work. They also feel that EX compensation is not adequate.
Executives are considerably more apt to feel ready to progress in their career immediately, while feeder group members feel that they require some time to prepare (over the next three years), to obtain more formal development and additional work experience. The need to meet language requirements, and current personal situations are also cited by feeder group members as important factors in feeling they are not ready to advance their careers.
Concern over work-life balance for both feeder groups and executives and satisfaction with their current position are reasons some choose not to seek advancement. More EXs than feeders mentioned satisfaction with their current job. Other reasons include managerial and people management responsibilities, removal from substantive areas of expertise, lack of adequate compensation and language requirements.
Retention
Meaningful work is the most positive or important aspect of working in the Public Service for both feeder groups and executives. Meaningful work was stressed by scientific and professional employees, EX-04s and 05s and older employees. For executives, the opportunity to serve Canadians is also a key component of their Public Service career, while job security and work-life balance are more important for feeder group members.
While work-life balance was identified as an important or positive aspect of a Public Service career by only a small portion of executives, and primarily at the EX-01 level, it is also regarded as one of the greatest challenges facing executives by more than half of executives and feeder groups. Work-life balance was stressed by women and those in their 40s. Other key challenges executives face according to both executives and feeder group members include the ability to attract and retain talent and heavy workloads, followed by people management and language requirements.
Executives and feeder group members tend to believe that their compensation package (e.g., salary, benefits, pension and leave) in the federal Public Service is better than that available to employees in small to medium private sector organizations, or within provincial and municipal governments, but not as good as packages available to employees in large private sector organizations, particularly for EX-03s and EX-04s. In general, EX equivalents are less positive than other feeder group members in their rating of their total compensation package.
Most executives and feeder group members plan on remaining in the Public Service until their retirement, although feeder group members are somewhat less certain of this. Of the small number of employees intending to leave before retirement, bureaucracy, more meaningful work and better use of education are the three top reasons.
The opportunity to work on an interesting and meaningful project is the most likely incentive to stay on in the Public Service (instead of retiring), followed by promotion or alternate work arrangements. Executives would be particularly motivated by an opportunity to help with transition through mentoring, coaching and knowledge transfer. The most senior EXs (EX-04s and EX-05s) and older employees are more inclined to extend their career if requested from senior management. Primary reasons to return to the Public Service after retirement include employment opportunities that would not affect the receipt of their pension, and paid work as a mentor or coach in the Public Service. It seems that pension plan considerations are paramount in any decision to move in and out of the Public Service.
Learning and development
EX and feeder group members most often report having the most extensive experience in the areas of operations and policy. Feeder group members identify a need for development in a wide range of areas with parliamentary relations, international perspectives, language training and senior management exposure topping the list. A lack of access to language training is a significant concern for a minority of respondents (although more marked among feeder groups). This is a much greater concern for all feeder equity group members and regional employees.
Participation in learning events (i.e., presentations, conferences, workshops) and classroom training is prevalent among most feeder group members and executives, and most report receiving regular, constructive feedback on their performance.
Many express interest in participating in leadership development programs, either offered by departments or corporately. Despite this interest, many feel that they are simply too busy at work to pursue or participate in programs available. Being too busy at work is also seen as a barrier to reaching objectives identified by feeder group members and executives in their learning plan. Furthermore, lack of awareness of development programs clearly represents additional barriers to participation in development programs.
Conclusion
In short, the census findings demonstrate that:
- Most current and potential executives in the Public Service are interested in furthering their careers through promotion. As well, most express an interest and intention to pursue their Public Service career until retirement.
- Executives and those in the feeder groups are motivated by meaningful work. In fact, many could be persuaded to extend their career or return following retirement by interesting and meaningful projects, or by the opportunity to help guide transitions. They would not, however, entertain any opportunities that jeopardize their pension.
- Work-life balance represents an important challenge; one which may discourage some from seeking advancement. Work-life balance is seen to be a positive aspect of working in the Public Service for feeder groups but not for the EX cadre. In fact it appears to be becoming a deterrent at the EX level. New and younger EXs want work-life balance.
- Heavy work-loads, management responsibilities/people management issues (e.g., difficulties attracting and retaining talent) are also seen as challenges or areas of frustration.
- Commitment to a public service career is greater than in 2002 feeder study.
- While large numbers are interested in promotions, many cite development needs to progress.
- Language requirements and access to language training present a challenge for some feeder group members that limit or delay their career progression.
- Drivers for each group (EX, equivalents and feeders) and demographic variables (e.g., age, life stage) are different. We cannot brand or manage the talent of these segments in the exact same way.
1. Introduction
Today's Canadian economy offers many employment opportunities and employers, including the Public Service of Canada, face much higher competition for talented employees. In turn, talent management in any organization is vital to its success – from the design or renewal of a functional community's needs, to recruitment and retention, to an organization's ability to succession plan. A successful talent management strategy should also take into consideration and understand the decisions employees make in their own career management. These can include career goals, learning and development needs, and anticipated retirement.
The 2007 EX and Feeder Census - Core Public Administration was undertaken to help refine and improve the government's understanding of the EX community and its feeder groups See footnote 3 to facilitate talent management in this community. This study will provide valuable evidence to support strategic management and renewal of the EX community. It has obtained the views of executives and feeder group members on issues relating to the Clerk's Public Service Renewal priorities, including recruitment, retention and learning.
This census explores three sets of related issues: retirement intentions, learning and development needs, career goals and mobility. The census findings will provide the Canada Public Service Agency (CPSA) and the Public Service as a whole with a better understanding of the community, help support the management of the community, and inform the development of policies, programs and communications unique to the EX community. The analysis of this census focuses and brings clarification to the conditions for the EX and feeder groups within the core public administration (CPA). See footnote 4 This includes the willingness of the members of feeder groups to become executives, the desire for career progression among current executives, and the elements that influence their career decisions.
This study was targeted to EXs and members of feeder groups in the CPA. The total number of employees within the sample frame for the census was close to 35,000 individuals: including 3,823 EXs, 4,797 EX equivalents, and 25,858 EX minus 1s and minus 2s. The census was conducted from June through July of 2007. In total, 15,990 employees responded to the census, for a response rate of 46 per cent. See footnote 5 The response rate for EXs, EX minus 1s/ minus 2s, and EX equivalents is 57 per cent, 47 per cent and 36 per cent respectively.
Throughout the report, results are presented for EXs and the feeder group (EX minus 1s and EX minus 2s and EX equivalents) separately. Appendix B presents classifications included in our census population.
Considering the size of the dataset, only large and statistically significant differences were reported. For questions with many answer categories or large number of survey items, only differences for the top five categories are presented in the report. In most cases, results are presented for valid responses; that is, responses not including the "don't know" or "not applicable" categories. Exceptions are noted in the body of the report. Detailed results were also explored in terms of sub-group patterns of results within the EX pool, as well as (separately) within the feeder group. Sub-groups included region of work, type of classification, age, gender, employment equity, language and other key dimensions.
1.1 Organization of the report
The results of the census are presented in the next three chapters. Chapter Two examines results in regards to perceptions about positive aspects of working in the Public Service, retirement and other attrition from the CPA. Chapter Three explores career aspirations and mobility and Chapter Four deals with learning and development, as well as barriers to learning and the take-up of learning opportunities.
Chapter Five presents a general profile of survey respondents. Because of its descriptive nature it has been placed at the end of the report, however, it should be noted that some readers may prefer to read this chapter first in order to better understand the detailed results contained in Chapters Two through Four.
2. Career goals/mobility
2.1 Priority areas
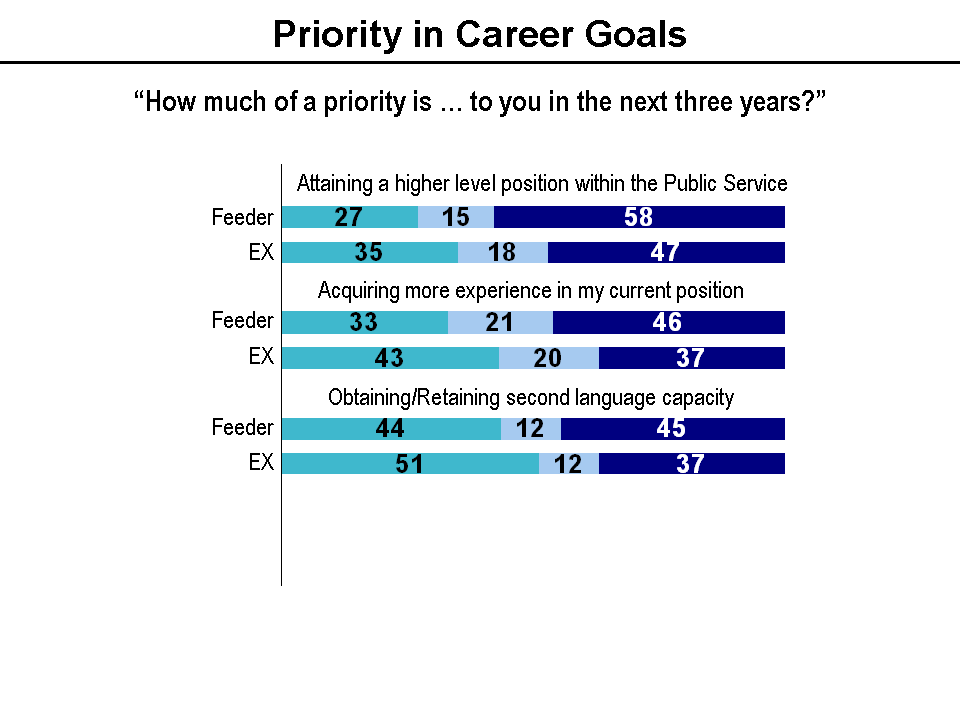
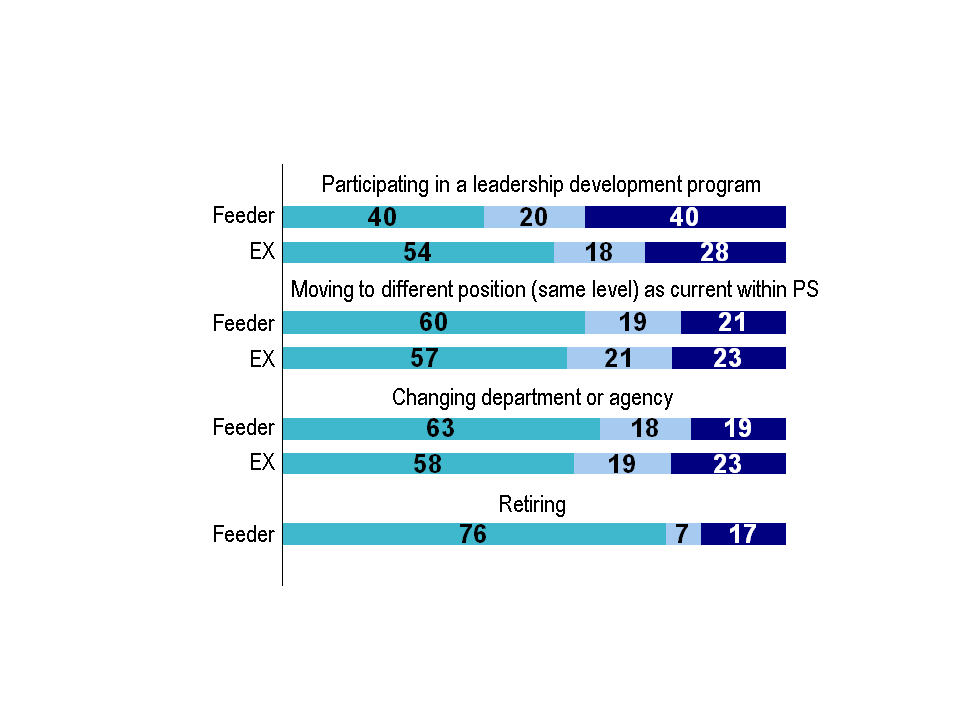
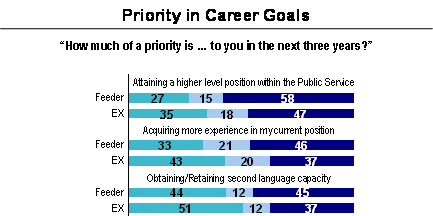
Attaining a higher level position within the Public Service was the top career priority among feeders and EXs. More feeder employees (58 per cent) indicated that attaining a higher level position is a priority within the next three years compared to EX employees (47 per cent). This makes sense as age is highly associated with wishing to attain a higher position. The younger the respondent, the more apt they are to rate this as a priority in their career. Forty-six per cent of feeders and 37 per cent of EXs rated the acquisition of more experience in their current position as a high priority. EX minus 1s were less apt to rate this as a high priority than the other feeder groups. Obtaining or retaining second language capacity was a high priority for 45 per cent of feeders and 37 per cent of EXs. Participating in a leadership development program ranked fourth, by 40 per cent of feeders and 28 per cent of EXs. EX minus 2s are more apt than EX minus 1s or equivalents to place priority on advancement to a higher position, second language capacity and participation in a leadership development program (and EX equivalents are generally the least likely to set these as priorities).
Moving to a different position at the same level is considered a priority by just over one in five employees. This is followed closely by 19 per cent of the feeder group and 23 per cent of EXs who considered a change of department or agency a priority.
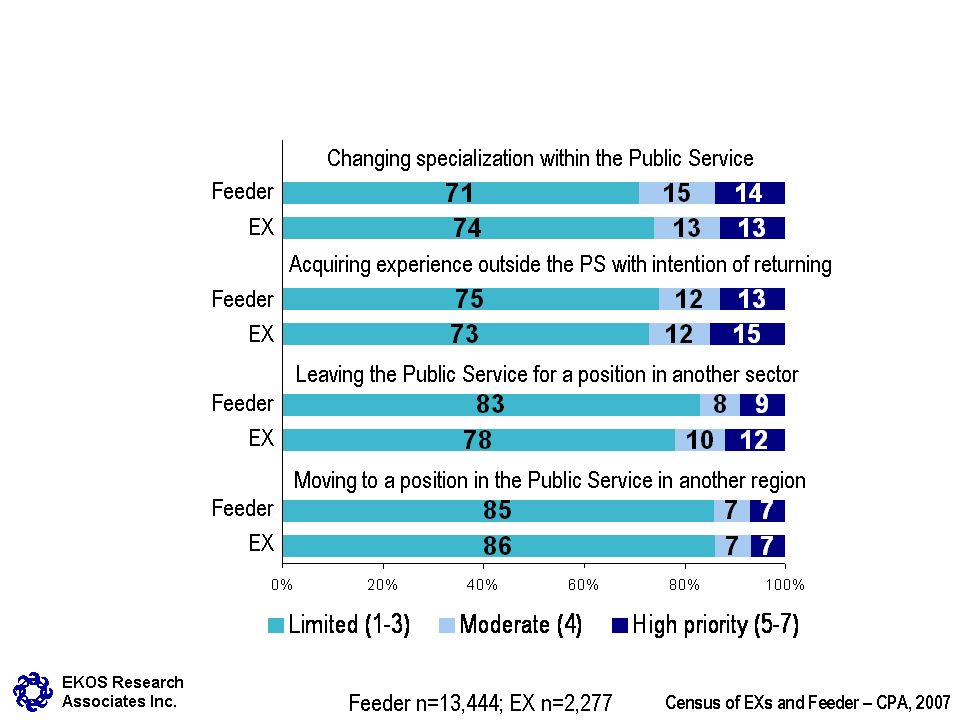
Four career goals are less likely to be a priority. Fourteen per cent of the feeder group and 13 per cent of EXs indicate that changing specialization within the Public Service is a priority. This is followed by acquisition of experience outside the Public Service with the intention of returning (such as via Interchange Canada), according to 13 per cent of feeders and 15 per cent of EXs. Roughly one in ten assign priority to leaving the Public Service for a position in another sector, and a small portion wish to leave the Public Service for another sector or to move to a position in another region.
These findings are similar to results of the 2002 survey of feeder groups See footnote 6, when 54 per cent of respondents identified attaining a higher position as a career goal for the next three years, followed by a special or acting assignment (43 per cent) or participation in a leadership developmental program (36 per cent). Note that differences in the question asked makes direct comparison difficult (in 2002 respondents were asked to identify three-year goals, while as in 2007 they were asked to rate the extent of priority of different goals).
Display full size graphic - part 1
Display full size graphic - part 2
Display full size graphic - part 3
a) Sub-group differences
- Both the feeder group and EXs with less than 20 years of Public Service experience, and younger employees (under 45), are more apt than other employees to choose the top five career goals as priorities.
Attaining a higher level position within the public service
- As previously indicated, age is highly associated with being interested in attaining a higher level position (and is highest among the youngest employees). Being in an acting position is also associated with wanting to attain a higher position. Given that the youngest are the most keen, this interest declines with years in the Public Service and level (for both feeders and EXs).
- Among the feeder group, attaining a higher level position is more often a priority for those in the National Capital Region (NCR).
- Among EX employees, EX-01s are more likely to assign a high priority to attaining a higher level position.
Obtaining/retaining second language capacity
- Not having CBC language proficiency is highly associated with interest in obtaining a second language capacity, as is being an Anglophone (to a lesser degree). Age is again highly associated, with the youngest showing the strongest interest.
- Feeder group members who are located in the National Capital Region (NCR), along with those who have relocated to the NCR are more apt to indicate that second language capacity is a priority.
- Within both the feeder group and EXs, employment equity groups are more apt than the other two groups to see second language capacity as a priority.
Participating in a leadership development program
- Age again is highly associated, with the youngest employees showing the greatest interest in participating in a leadership development program. The more years in government (and in a position) and higher level they have attained, the less interested they are in participating in a leadership development program. Those in acting positions are again among the keenest.
- Women and employees with CBC language proficiency are more likely to view a leadership development program as a priority.
- Among EX employees, EX-01s are more likely to assign a high priority to participating in a leadership development program than other EXs.
Moving to different position at same level as current position within the public service
- Individuals located in the NCR are more likely than others to view a lateral move as a priority for the next three years.
2.2 Interest in career progression
Roughly four in ten feeders and EXs are interested in progressing to a higher level or becoming an executive within the Public Service. Interest is higher among EXs (46 per cent) than it is among the feeder group (37 per cent). Within the feeder group, a higher proportion of EX minus 1s are interested in becoming an executive than EX equivalents or EX minus 2s.
Interest in an executive position or career is quite similar to that reported in the 2002 survey of feeder groups, although the proportion of those "very" interested is slightly higher in this census. In 2002, 33 per cent reported being "very interested" and 38 per cent were "somewhat interested".
- Within the feeder group, those identified as top 10 EX feeder groups See footnote 7 are more interested in progressing, as are employees who have relocated to the NCR (consistent with 2002 findings).
- Among the EX group, EX-01s are more apt to be very interested in progressing, whereas EX-03s and EX 04/05s are typically less interested.
a) Sub-group differences
- Both the feeder group and EXs share the following characteristics:
- Those with less than 20 years experience in the Public Service, as well as individuals who are under age 45, are typically more interested in progressing to a higher level or becoming an executive than others are. In fact, age is highly associated with interest in career progression. This is followed by whether the person is currently in an acting position (which also indicates a keen interest) and then years of experience in the Public Service, followed by current level and being in the top 10 (among feeders).
- Differences are also reflected in retirement plans, whereby those expecting to stay until they can receive a maximum pension or beyond (or are uncertain about their plans) are more interested in progressing than those who want to reduce or minimize their time before retirement.
- Individuals with a graduate degree are more interested in progressing than those with less education (also consistent with 2002 findings). Those with less than a university diploma are the least interested in career progression. Education is associated less, however, than age and experience or level and whether one is in an acting position.
- Employees with their CBC language proficiency are typically more interested, whereas those not tested are often less interested in progressing.
- With regard to employment equity groups, it is members of visible minority groups and Aboriginal employees who are more often interested in career progression. Interest among employees with a disability is less pronounced. Members of visible minority groups also expressed relatively greater interest in advancement in 2002.
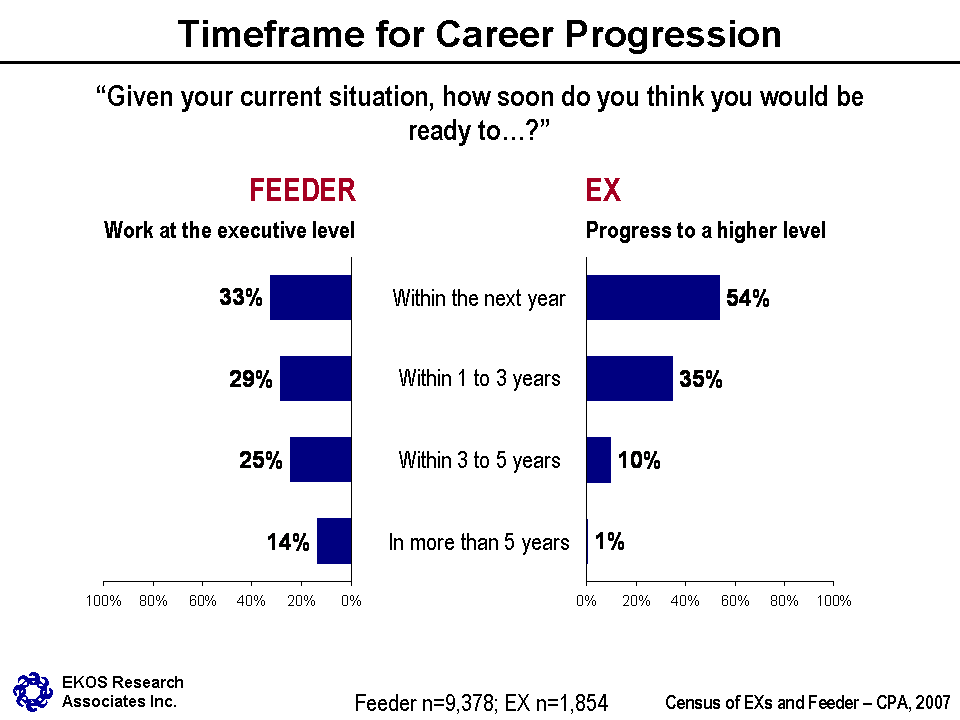
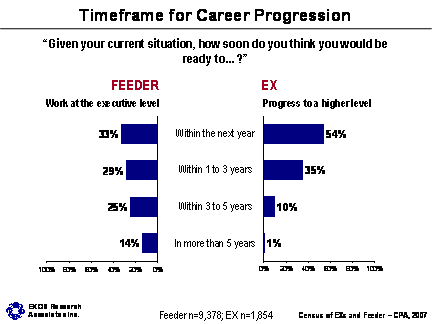
2.3 Timeframe for progression
Of those who are at least somewhat interested in progressing to the next level, 33 per cent of feeder employees say they are ready to progress to the executive level within the next year, 29 per cent say it will take one to three years, and 25 per cent expect it to take three to five years. One in seven (14 per cent) are predicting that it would take more than five years to be ready to progress to a higher level. EX equivalents and EX minus 1s more often report themselves as ready to work at the executive level within the next year, compared with EX minus 2s.
More than half of EXs (54 per cent) with a keen interest for progression to the next level feel they would be ready within the next year. Over one third (35 per cent) believe they would need one to three years and 10 per cent feel they would be ready within three to five years. Virtually no one believed that it would take them more than five years to be prepared to progress to a higher level.
a) Sub-group differences
- Among the feeder group who believe they would be ready to progress to the executive level, those in the top 10 feeder categories are more apt to say they would be ready within the next year than those in non-top 10. As well, men and employees with CBC language proficiency are more likely than others to say they would be ready within the year to work at the executive level.
- For both feeder and EX employees who are at least somewhat interested in progressing, the age and experience relationship exists for being ready within the next year. Those who have been in the Public Service for 30 or more years (only 20 or more years for feeder employees), and those who are over age 50 are also more apt to indicate readiness within the year.
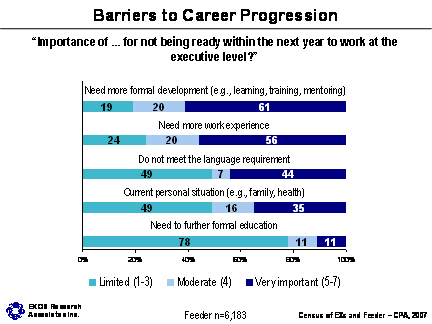
Employees in feeder positions in the Public Service who do not feel that they will be ready to work at the executive level within the next year were asked to rate the most important reason for not being ready. The reason most often identified as important was the need for more formal development such as learning, training, and mentoring (identified as very important by 61 per cent of feeder employees). The reason cited next most often was the need for more work experience (56 per cent). EX minus 2s more frequently cited the need for formal development and work experience as important, compared to others in the feeder group. This is followed by just less than half (44 per cent) of feeder employees indicating that not meeting the language requirements is a very important reason that they will not be ready for the executive level in the next year.
Factors relating to the employee's current situation, such as family and health, were identified as very important by 35 per cent of the feeder group. Finally, only eleven per cent of this group believe that the need for further formal education is a barrier to career progression for them. EX minus 2s were more likely than EX equivalents and EX minus 1s to cite the need for further formal education as important.
b) Sub-group differences
Need more work experience and need more formal development
- Feeder employees in the NCR, women, newer public servants (with less than 10 years of service), and employees under age 40 are each more likely than others to cite that they need more work experience and development. Age is highly associated with a perceived need for more work experience, followed by level. Whether or not an employee has their CBC language proficiency is also moderately associated with perceiving more work experience as a barrier to progression.
- Feeder group members with university education are more apt to cite the need for more work experience as a barrier.
Do not meet the language requirement
- Anglophone members of the feeder group, employees who have less than CBC and those who have not been tested for language proficiency are more apt to cite not meeting the language requirement as a major reason for not being ready for advancement.
- Those in the scientific and professional occupations indicate inability to meet the language requirement as a reason for not being ready more than administrative and foreign services do See footnote 8.
- Regional employees, men, and those aged 50 and over are more apt to identify language requirements as a barrier, with location having the highest association.
- Aboriginal people, and members of visible minority groups of the feeder groups, as well as people with a disability are all more apt to say not meeting language requirement is a very important reason for not being ready for advancement.
Current personal situation (e.g., family, health)
- Younger members of the feeder group (under age 45) and women are more apt to identify their current personal situation as being a very important reason they will not be ready to work at the executive level within the next year.
Need for further formal education
- Those with less than university education are more likely to indicate the need for further formal education as a reason for not been ready for advancement.
- Aboriginal feeder employees are more also apt to cite this factor.
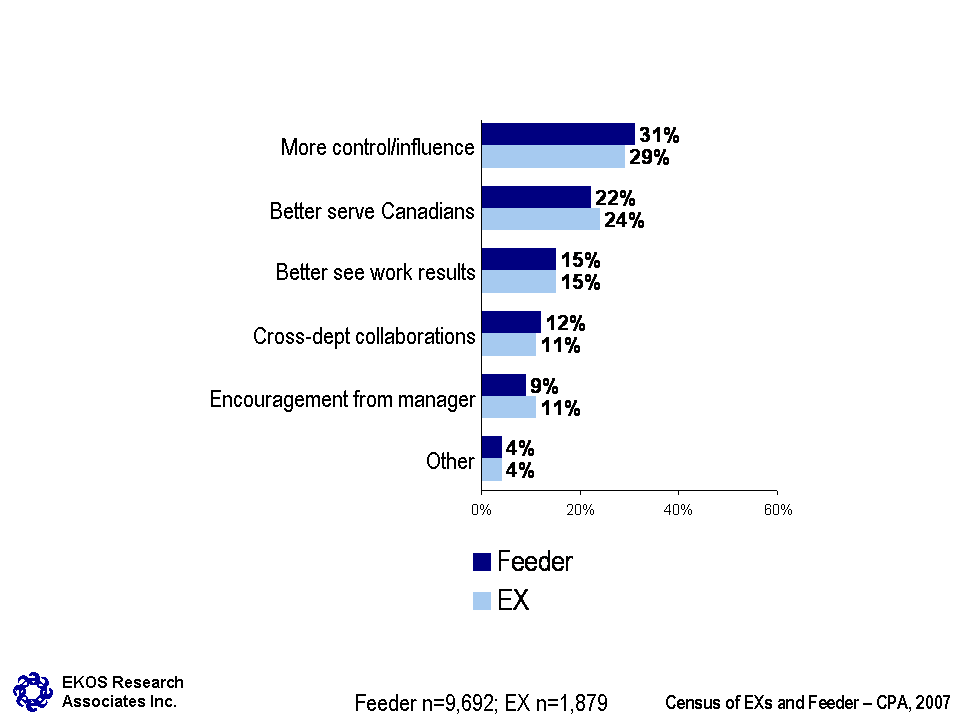
2.4 Motives for career progression
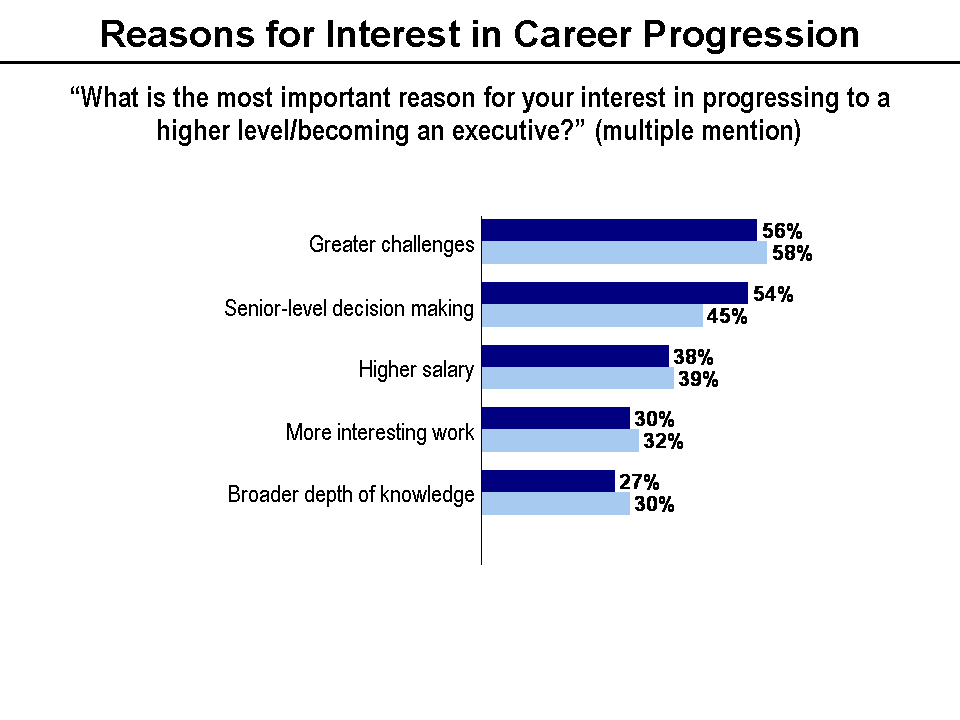
Public Service employees are interested in progressing to a higher level or becoming an executive for a variety of reasons. Of the motivations explored, the strongest was the opportunity for greater challenges, cited by nearly equal portions of feeder (56 per cent) and EX (58 per cent) employees. This is followed by the opportunity to participate in senior level decision making, which is a motive for proportionately more of the feeder group (54 per cent) than the EX group (45 per cent). The third strongest reason for progressing is a higher salary, according to 38 per cent of the feeder group and 39 per cent of EXs.
About three in ten employees rated the following factors as being among the top reasons they are interested in progressing to a higher or executive position: opportunity to do more interesting work, opportunity to obtain a broader depth of knowledge, and opportunity for more control and influence at the top.
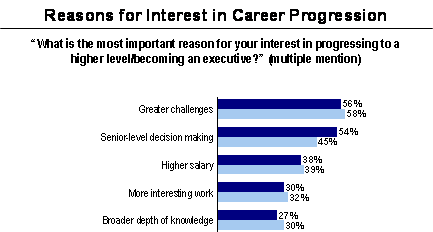
Four other motives fall lower on the list of reasons: 22 per cent of the feeder group and 24 per cent of EXs are interested in a higher or executive level position in order to better serve Canadians. Fifteen per cent of each group would like to advance in order to see better work results. Eleven to twelve per cent are interested in greater cross department collaborations through their advancement. One in ten indicated encouragement from manager and/or colleagues as a primary reason.
It is difficult to compare these results to 2002 feeder group findings, given a difference in the question asked (in 2002, respondents were invited to identify multiple reasons for advancing, while in the present census they were asked to specify the most important one). In 2002, to influence progress toward a goal was mentioned most frequently as a reason to advance into an executive position, followed by senior level decision making.
Display full size graphic - part 1
Display full size graphic - part 2
a) Sub-group differences
Within the EX and the feeder groups, the following differences were noticed:
- Men are more apt to list salary and better serving Canadians among their reasons for interest in becoming an executive. Women, on the other hand, are more likely than men to cite broader depth of knowledge as a reason for progressing.
- Employees under age 40 and with less than 10 years experience are more apt than others to indicate greater challenges and senior level decision making as their reasons for interest in career progression. Those over age 55 and individuals with 30 or more years of experience are more apt to cite salary among their reasons for interest.
Specific feeders findings:
- Education is strongly associated with citing senior level decision making as a motive to progress, followed by age. Those with university degrees are more apt than those with other education levels to cite senior level decision making as their reason, likewise the younger the employee the more likely they are to cite this.
- Regional employees have a slightly greater propensity than others to want an opportunity for a broader depth of knowledge as a motive for career progression.
- Length of time in the Public Service, followed by gender, is strongly associated with higher salary being cited as a motive for career progression. Men and those with more years of experience are more apt to cite salary.
EX findings:
- EX-01 employees are more apt than other EXs to cite salary as a reason for interest in progressing to a higher level. Age among EXs is strongly associated with higher salary being cited, followed by gender. Men and those who are older are more apt to cite salary.
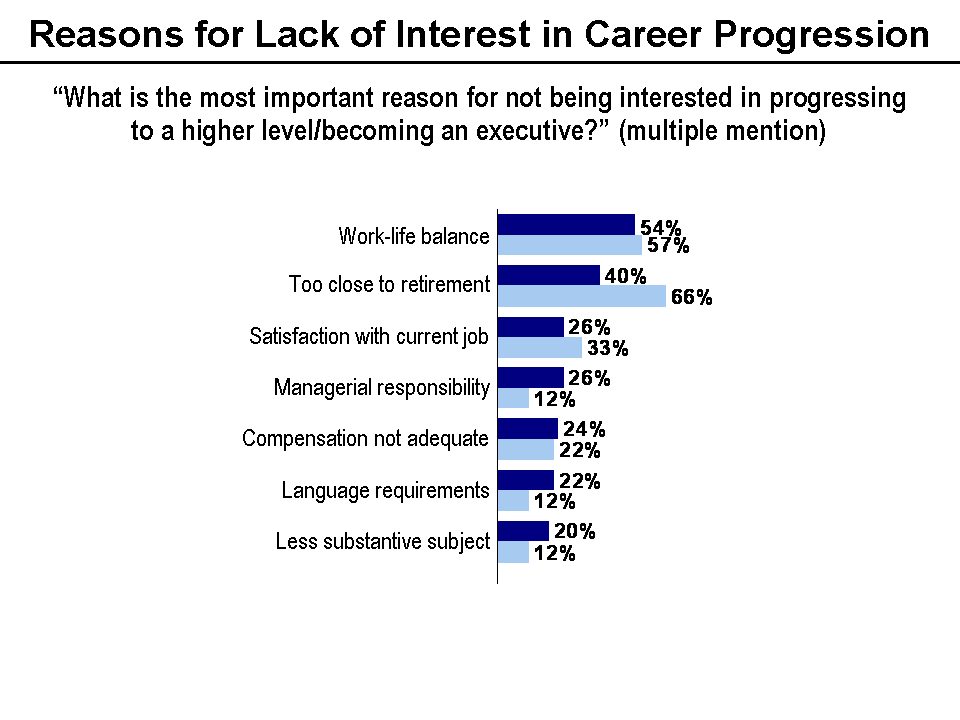
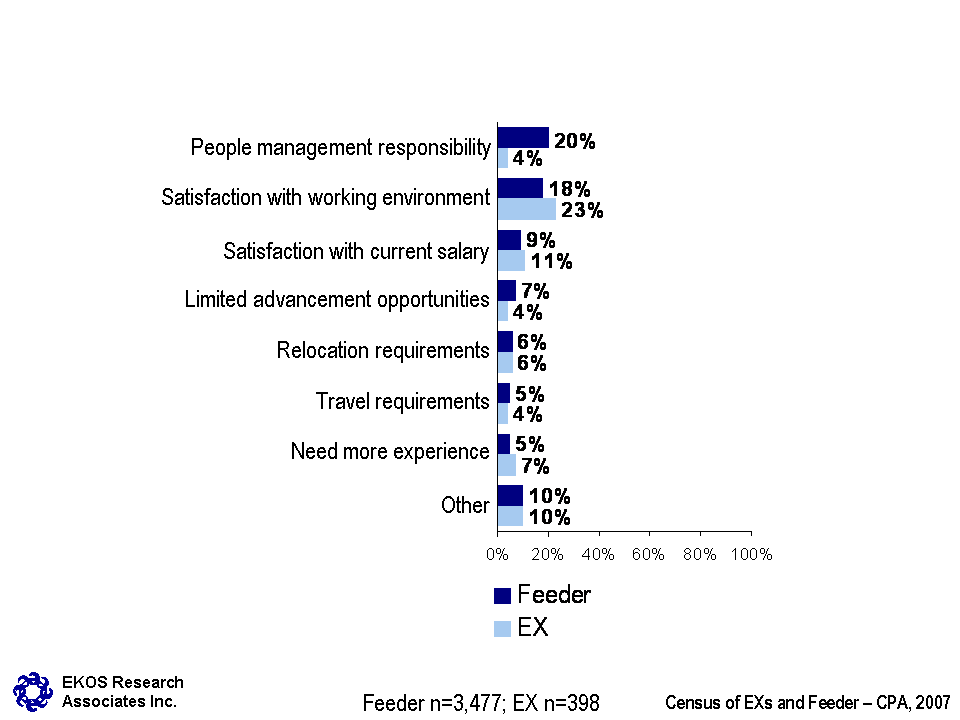
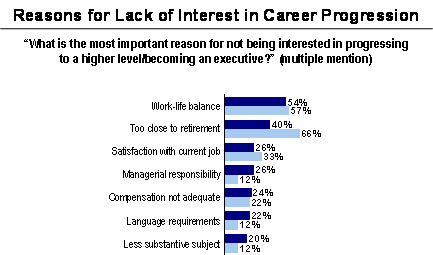
2.5 Barriers to career progression
Over half of feeder and EX employees cite concerns with work-life balance as the top reason they are not interested in progressing to a higher level or becoming an executive. The second most often reported reason is impending retirement. EXs are considerably more apt to cite nearing retirement (at 66 per cent) than the feeder group (40 per cent). Satisfaction with their current job was the third most often named reason, where again, significantly more EXs than feeder group members mention this reason (26 per cent of the feeder group and 33 per cent of EXs).
Work-life balance was also the barrier cited most frequently in the 2002 survey of feeder group members, although again differences in the question asked makes direct comparison difficult.
EX equivalents were less apt than others in the feeder group to consider work-life balance or being too close to retirement as important reasons for not being interested in progressing to a higher level. These employees were more likely to cite satisfaction with both their current job and working environment as well as concern about fewer opportunities to do substantive subject matter work as important reasons, compared to EX minus 1s and 2s. EX minus 2s are more likely to feel work-life balance and people management responsibility are important reasons, while EX minus 1s are more likely to feel being too close to retirement is an important reason for not being interested in progressing to a higher level/being an executive.
Increase in managerial responsibility (such as meetings, committees, and budgets) is a greater concern among the feeder group (26 per cent) than it is among EXs (12 per cent). Just over one in five says that their compensation is not adequate for the increased responsibility.
Difficulty meeting language requirements was given as a reason by 22 per cent of the feeder group and considerably fewer EXs (12 per cent). Again, a greater proportion of the feeder group (21 per cent) than EXs (11 per cent) cited fewer opportunities to do substantive subject matter work. Twenty per cent of the feeder group also cited an increased level of people management responsibilities among their reasons (although this is not a concern for many EXs).
An average of one in five feeders and EXs indicates that satisfaction with their current working environment is a reason for their lack of interest. Nine per cent of the feeder group and 11 per cent of EXs also indicate that they are satisfied with their current salary.
Reasons that are important to only a few include limited opportunities for advancement in their field of work, concerns with potential relocation requirements, concerns with travel requirements, and the need for more experience in their current job.
Display full size graphic - part 1
Display full size graphic - part 2
a) Sub-group differences
Within the feeder group, the following differences include:
- Scientific and professional employees had a propensity to state they are satisfied with their current job, and to express concerns with increased managerial responsibility and less substantive subject matter if they were to progress.
- NCR employees are more apt than those in other regions to state concerns with work-life balance, increased managerial responsibility, and compensation not adequate as reasons they are not interested in becoming an executive.
- Women more often than men listed work-life balance as an issue, while men more often pointed to proximity to retirement or language requirements as issues.
- Employees under age 50 more often cited work-life balance, concerns with increased managerial responsibility, and inadequacy of compensation for increased responsibility as reasons for lack of interest in progressing. Those with less than 10 years experience in the Public Service more often cited work-life balance and concerns with less substantive subject matter as concerns compared to those with more experience. Those over the age of 50 and with the most experience pointed more often to the proximity of retirement as a reason.
3. Retention/retirement
3.1 General views about work environment
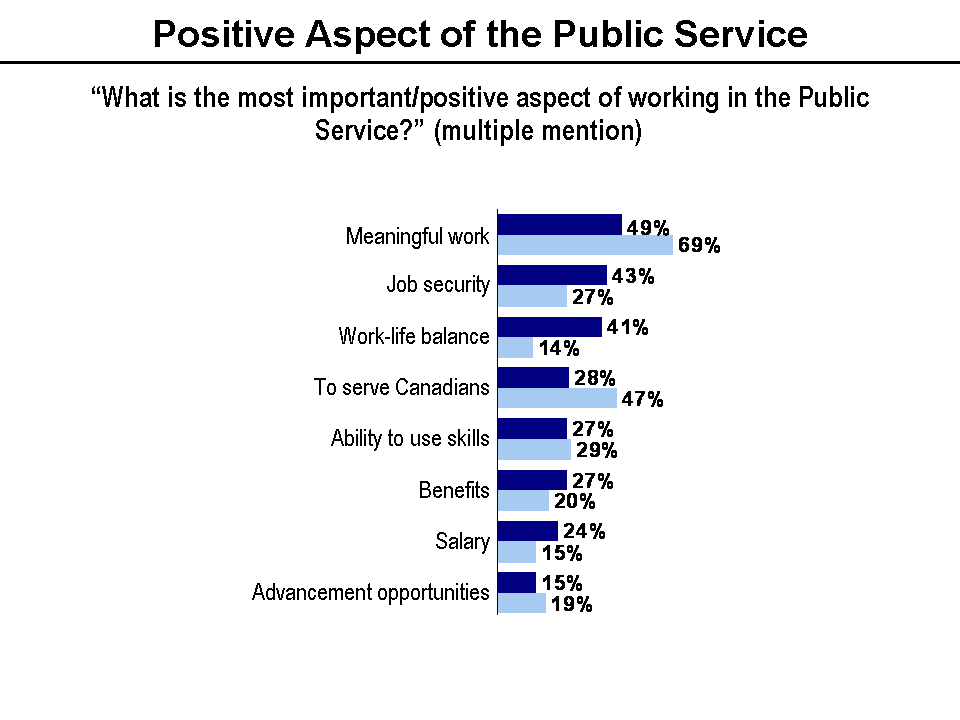
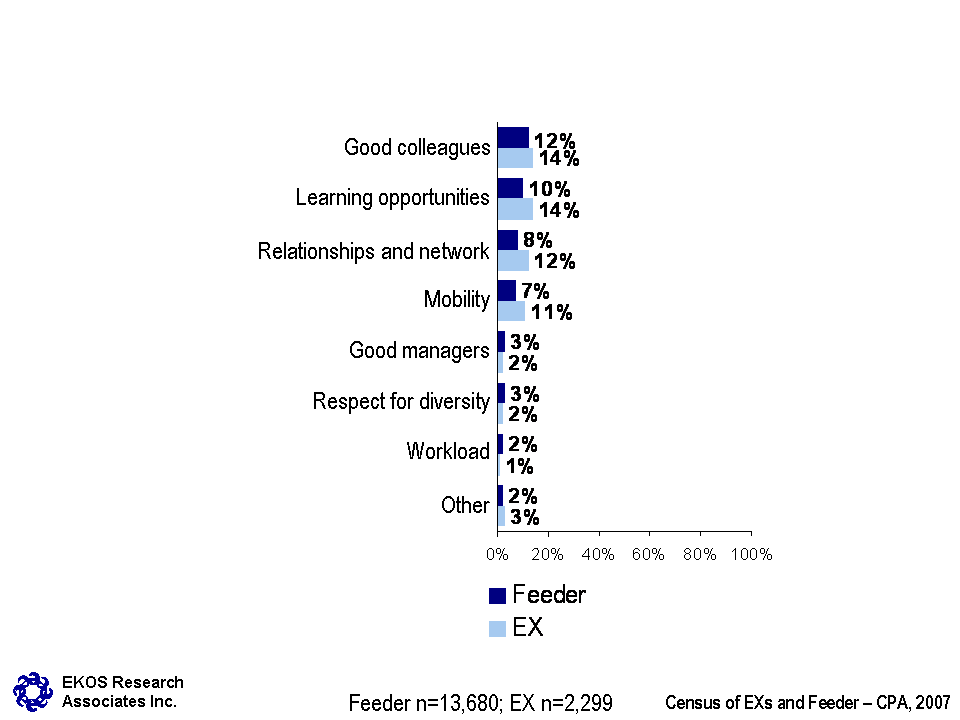
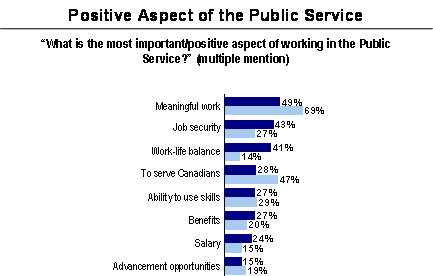
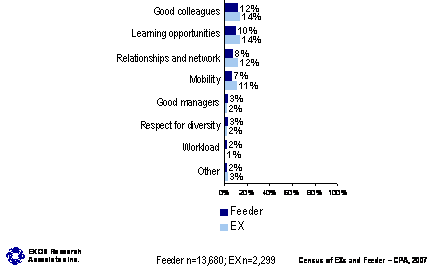
While the most important/positive aspect of working in the Public Service is the same for both the feeder group and EXs, EXs tend to cite 'meaningful work' much more frequently than the feeder group. Within the feeder group, EX equivalents cite meaningful work more often than others (16 percentage points more than the overall average) and EX minus 2s who cite it least often. Job security is also often cited by the feeder group, as well as work-life balance, although EX equivalents are less concerned than other feeders about job security, and EX minus 2s are most likely to cite job security. Serving Canadians, however, is very close to the top of the list for EXs. This is followed at a distance by job security and ability to use skills. Work-life balance is much less apt to be cited as a positive aspect among EXs. EX equivalents are more likely than other feeders to view ability to use skills as an important aspect of working for the Public Service. Salary and benefits, along with job security are more often cited in the feeder group than among EXs.
Display full size graphic - part 1
Display full size graphic - part 2
a) Sub-group differences
Meaningful work
- Meaningful work is more important among scientific and professional employees and those who have a graduate degree, as well as older feeder group employees.
- Among EXs, meaningful work is more often cited as a positive aspect of working in the Public Service by EX-04s and EX-05s, and those with a graduate degree.
Job security
- Among EXs, those with the most experience (over 30 years in the Public Service) and those who intend to stay the minimum required for an unreduced pension are more likely to cite job security as an important aspect of working in the Public Service.
Work-life balance
- Among feeder employees, those under the age of 44 cited work-life balance more often.
- EX-01s and EX-02s and EXs under the age of 45 were more likely to cite "work-life balance" as an important aspect of working in the Public Service.
To serve Canadians
- Older and more senior level EXs, as well as EXs in regions, were more apt to cite "serving Canadians" as one of the most important aspects of working in the Public Service.
Ability to use skills
- Feeder employees in the science or professional fields and those over 55 years of age cited ability to use skills more often than other feeder group employees as a positive aspect of working in the Public Service.
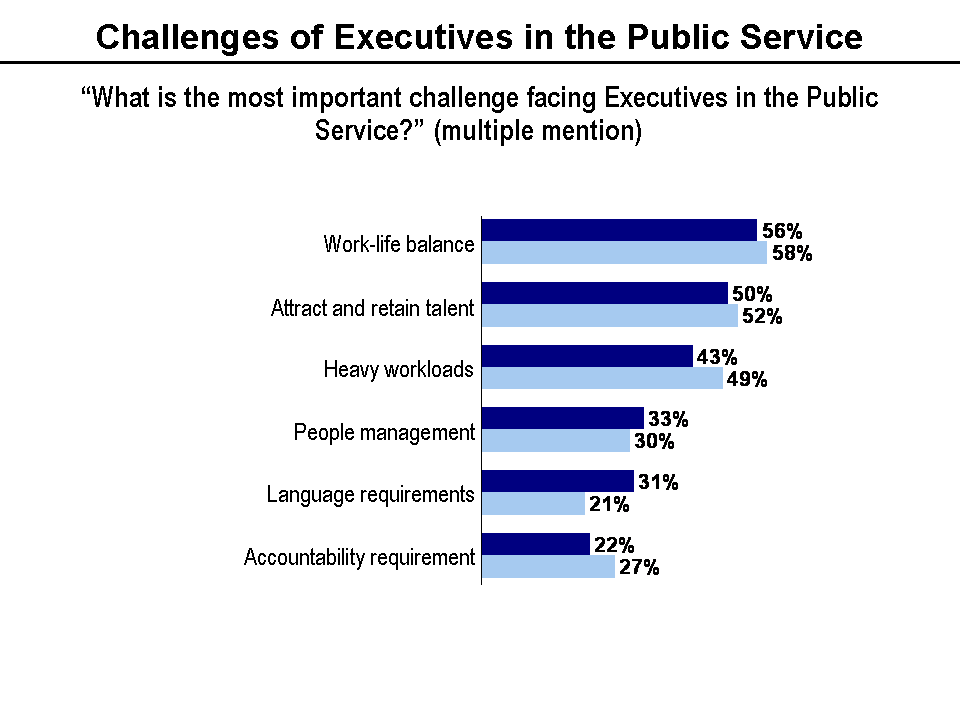
While "work-life balance" was not cited as one of the most important/positive aspects of working in the Public Service among executives, it was cited as the most important challenge by EXs and the feeder group alike. Attracting and retaining talent followed, heavy workload, people management and language requirements trail behind as substantial challenges facing executives in the Public Service.
Display full size graphic - part 1
Display full size graphic - part 2
b) Sub-group differences
Work-life balance
- Among feeders, work-life balance is cited more often by women and individuals between the ages of 40 and 49. EX-01s are also more apt to cite work-life balance as a challenge than EX equivalents and EX-02s are.
- EXs are more apt to cite work-life balance as a challenge, as are women and those between the ages of 40 and 44.
Heavy workloads
- Feeders who have worked in the Public Service between 20 and 29 years (and correspondingly, those between the ages of 45 and 54) and women are more apt to cite heavy workloads as an important challenge facing executives. Feeders who have worked under 10 years in the Public Service were among the least likely to cite heavy workload as a challenge.
- Executives between 45 and 49 and women are more likely to consider heavy workloads to be a challenge facing executives in the PS.
People management
- EXs who would retire now and accept a reduced pension were among those more likely to cite people management as a challenge facing executives.
Language requirements
- Individuals over the age of 55, men, Anglophones, those who have less than CBC language proficiency, as well as those with a disability or who are members of visible minority groups feel that the language requirements are an important challenge facing executives.
- Those working outside the NCR more often cited language requirements to be among the top five challenges facing executives in the Public Service.
Many EX and feeder employees believe that the total compensation package (e.g., salary, benefits, pension and leave) in the federal Public Service is better than that of small to medium sized organizations in the private sector, and in other governments. Much fewer are positive about their total compensation package relative to those in large private sector organizations. EX equivalents are less positive than other feeder group members in their rating of their total compensation package, rating it more often as worse than compensation packages in other sectors. EX minus 2s are the least negative about their compensation package compared with those offered by large private sector employers.
c) Sub-group differences
Feeder group:
- While those with more experience in the Public Service (over 30 years) consider their compensation package to be better than small and medium enterprises (SMEs) and large private sector employers, those with less experience (less than 10 years) are less positive about their compensation packages compared with other government packages.
- Women are more favourable than men about their compensation package relative to both SMEs and large private sector employers.
- Feeder group members with an undergraduate degree or less tend to rate their total compensation package as better than SMEs, large private sector employers and other government packages. Those with a graduate degree, more often, believe they are worse off.
EXs:
- EXs contemplating leaving the Public Service with a reduced pension are more apt to believe that they would do better in other governments.
- EX-01s are the most apt to believe that they are well compensated relative to what is offered in SMEs.
- The perception of being worse off in the federal Public Service relative to a large private sector organization is even more prevalent among EX-03s and EX-04s.
- Although few were positive about their relative compensation compared with large private sector organizations, the largest proportion of favourable responses are found among EX-01s (where 21 per cent see the federal government as having a better package).
3.2 Leaving the public service
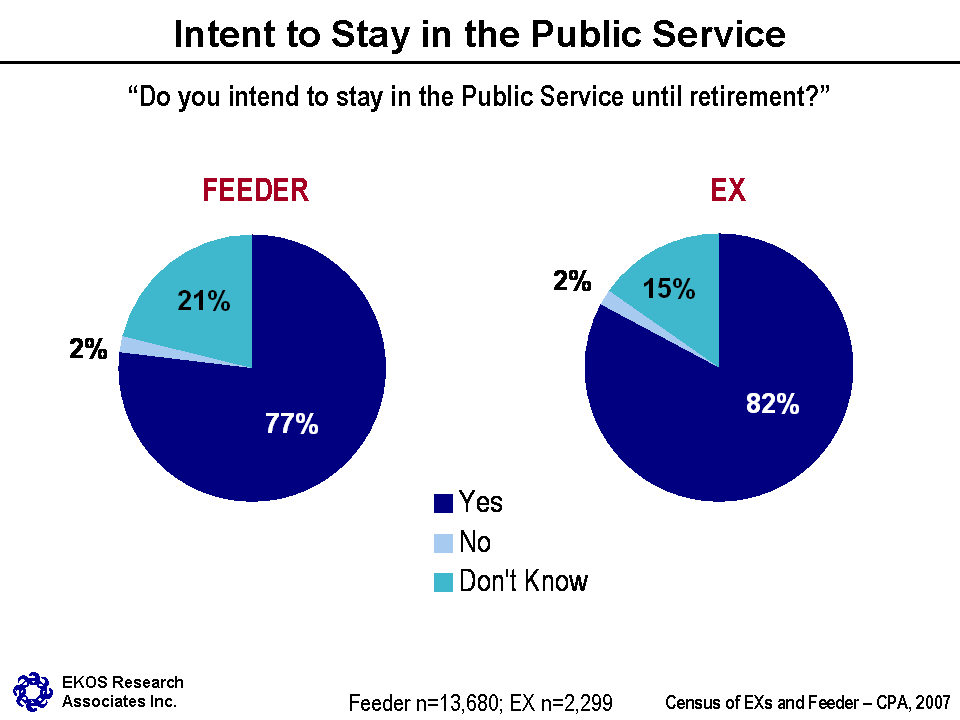
Respondents were asked whether they intend to stay in the Public Service until retirement. Among the feeder group, over three-quarters (77 per cent) say they will be staying; two per cent do not intend to stay in the Public Service until retirement; and one in every five respondents (21 per cent) are unsure. Very few in the EX community are sure that they will be leaving the Public Service before retirement. Eighty-two per cent say that they will be staying until retirement. On the other hand, 15 per cent are not sure at this point, but only two per cent say that they are sure they will be leaving.
Commitment to a Public Service career appears to be greater than in the 2002 survey of feeder groups, when only 66 per cent planned on remaining in the federal Public Service until retirement and 10 per cent planned on leaving.

a) Sub-group differences
- Among the feeder group, it is those with the most experience in the Public Service and those with less than a graduate level of education who are most apt to say they will stay. The strongest difference is by age, with those over 45 years of age reporting the greatest willingness to stay.
- The few EXs intending to leave the Public Service before retirement are more prevalent among those with less experience in the Public Service (who have invested less time in their Public Service career) and are younger, although even among these segments the numbers are small (six per cent or less).
3.3 Timeframe for leaving
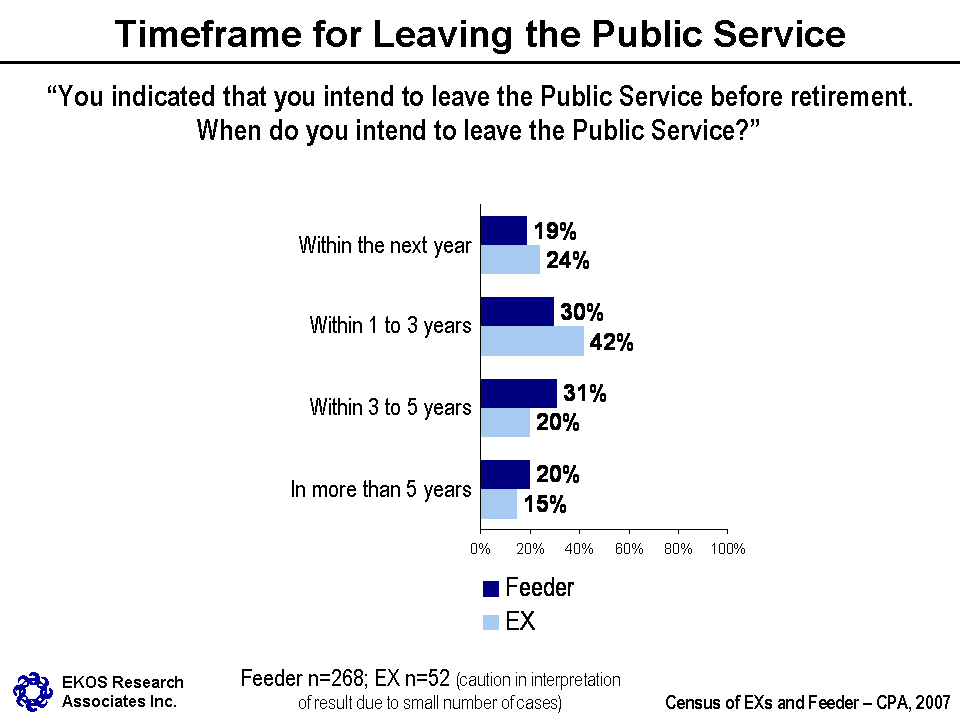
Of the very few feeder employees (268 or 2 per cent) who intend to leave the Public Service for reasons other than retirement, one third intend to leave within one to three years, while one in five intend on leaving sooner. An additional one third indicated they will leave within three to five years and a final one-fifth (of respondents who intend to leave the Public Service), believe they will leave in more than five years. EX equivalents were less likely to report a longer timeline for leaving the Public Service than EX minus 1s and EX minus 2s.
Among the few EXs intending to leave (52 or 2 per cent), almost half believe that they will leave within the next one to three years, a quarter think that they will be leaving sooner and one in three expect to stay for at least three years. Generally, EXs who intend to leave the Public Service before retirement intend to leave sooner than the feeder group. However due to the small number of EXs who reported they intend to leave before retirement, results should be interpreted with caution.
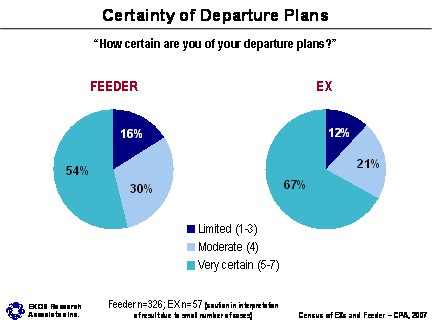
3.4 Certainty of departure
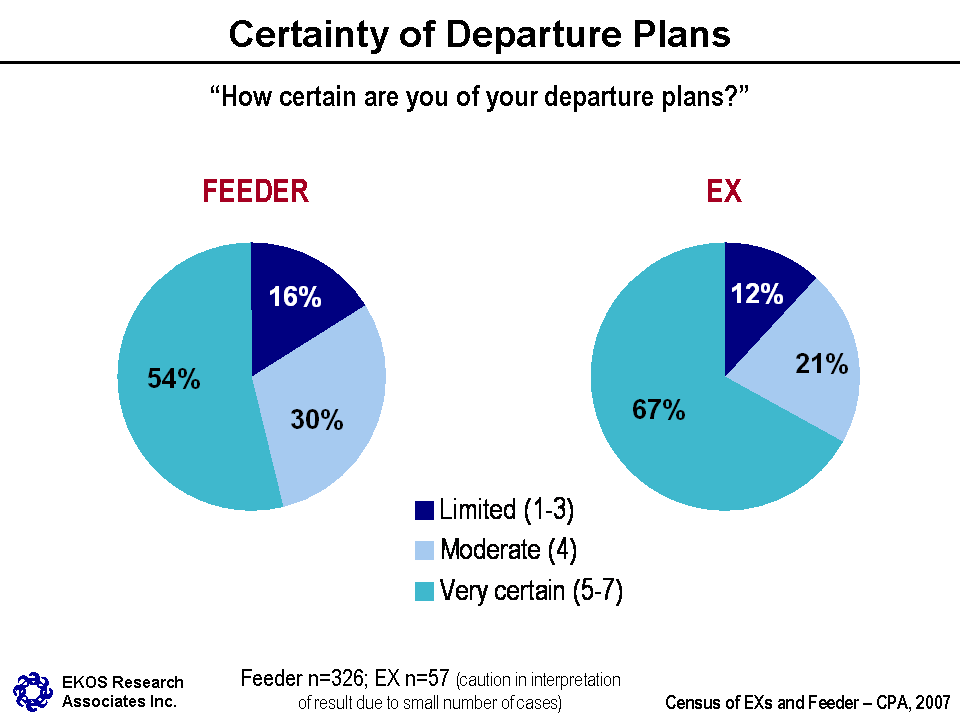
Of those respondents who indicated they intend to leave the Public Service for reasons other than retirement, over half of feeders and two-thirds of EXs were very certain of their departure plans. However due to the small number of EXs who reported they intend to leave before retirement, results should be interpreted with caution.
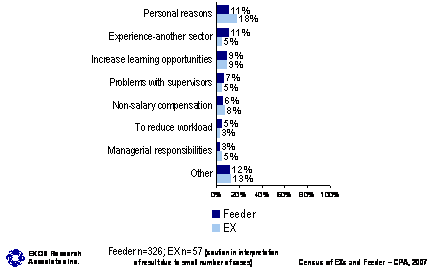
3.5 Motives to leave the public service
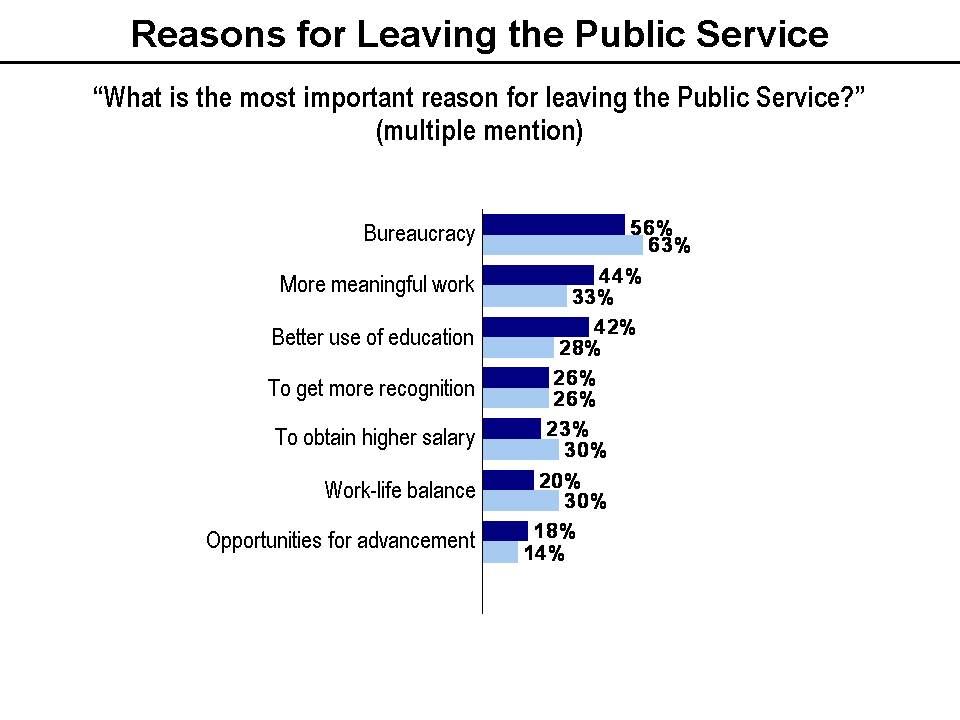
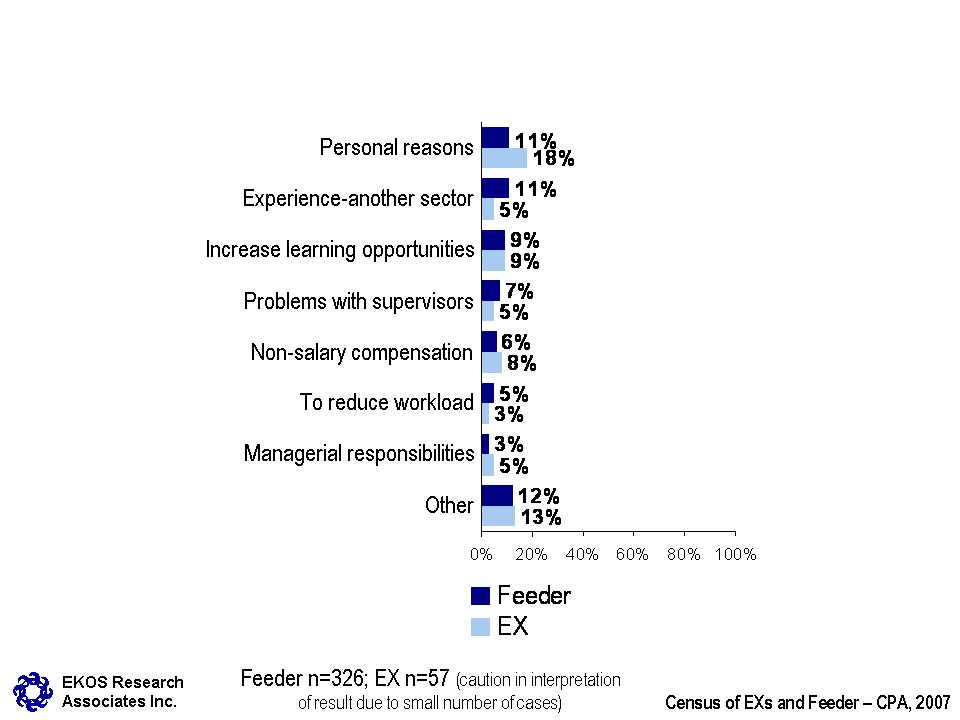
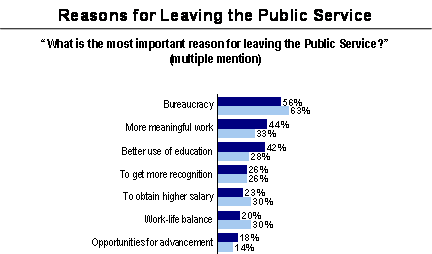
The top three reasons cited by the feeder group for leaving the public service are bureaucracy, more meaningful work and a better utilization of their education. EX equivalents seem to be less likely to cite more meaningful work as a reason to leave compared to EX minus 1s and EX minus 2s See footnote 9. While EXs also rate bureaucracy as the most important reason, this is followed by more meaningful work, to obtain a higher salary and work-life balance. Also, EX equivalents were more likely than others in the feeder group to cite obtaining a higher salary as an important reason for leaving the Public Service. However due to the small number of EXs who reported they intend to leave before retirement, results should be interpreted with caution.
Display full size graphic - part 1
Display full size graphic - part 2
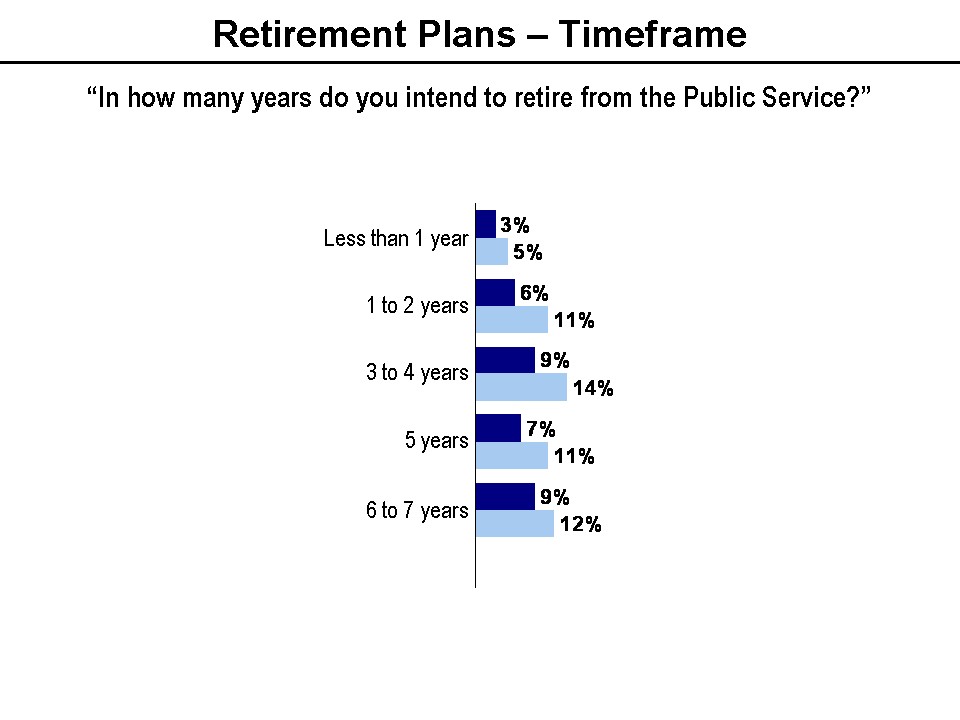
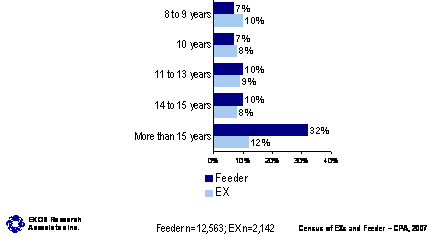
3.6 Retirement plans
EXs have a shorter overall timeframe for retirement than employees in the feeder group, given that they generally have more years of service. Twenty five per cent of feeders intend to retire within the next 5 years, 23 per cent intend to retire within the next 6 to 10, with the remaining 52 per cent expect to retire in more than 10 years. EX minus 2s have a longer horizon for retirement than either EX equivalents or EX minus 1s, with more saying that they would retire in 15 years or more.
Forty one per cent of EXs intend to retire from the Public Service within 5 years or less. Another 30 per cent will retire within the next 6 to 10 years and 29 per cent do not expect to retire for another 10 years or more.
Display full size graphic - part 1
Display full size graphic - part 2
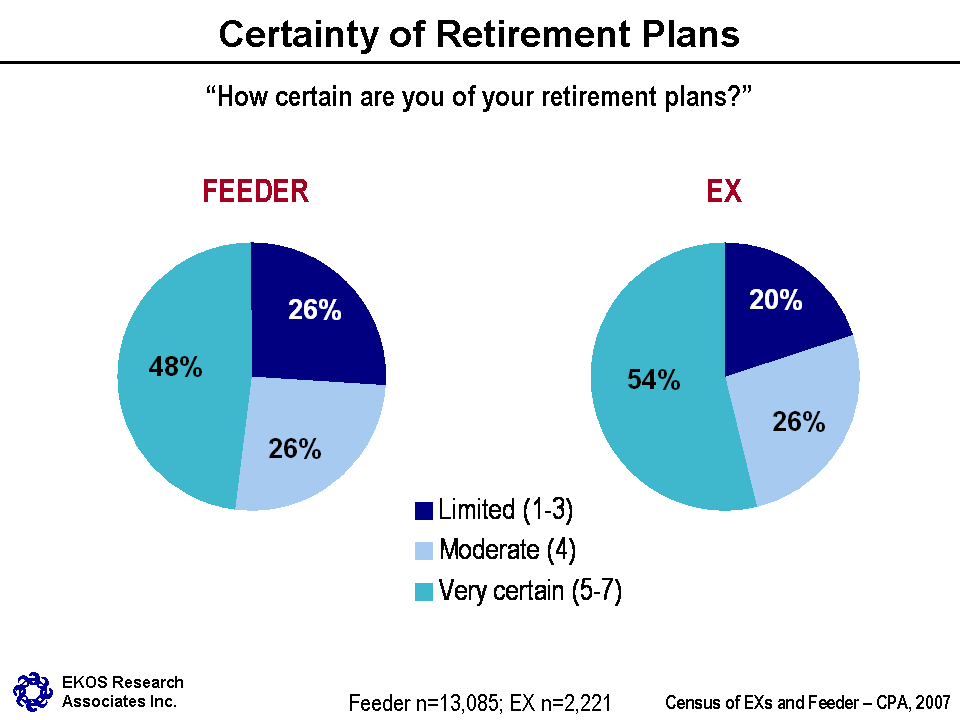
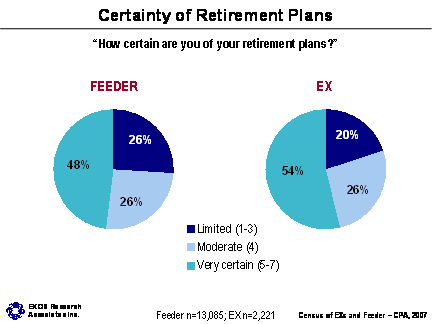
Just over half of EXs consider their retirement plans to be very certain. Another one quarter says their plans are moderately certain and one in five is less certain of their retirement plans. The feeder group is only marginally less certain of their plans. EX equivalents are somewhat less certain of their retirement plans compared to EX minus 1s and EX minus 2s.
a) Sub-group differences
- Older employees and those with more years of service are also more certain of their retirement plans compared to newer and younger employees at both the feeder and the EX level.
Feeder groups
- Women, Aboriginal people and members of visible minority groups are more likely to state they intend to stay longer than 15 years in the Public Service, but are also less certain of their plans.
- Of those who intend on retiring with a reduced pension, 38 per cent plan to do so within the next 5 years. Of those who intend to stay for an unreduced pension, 29 per cent plan to retire within the next 5 years. Of those who intend to remain until they are eligible to receive maximum pension benefit, 35 per cent intend on retiring in more than 15 years.
- Of those who are uncertain of their retirement plans, 57 per cent intend on retiring in more than 15 years.
EXs
- EXs in more senior positions (EX-03, EX-04 and EX-05) are more apt to say they intend to retire within the next 5 years compared to those in less senior positions.
- Executives in the NCR are somewhat less likely to be planning to retire in the short-term compared to regional employees at the EX level.
- Men (who are, on average, older than female EXs) are more likely than women to plan to retire in the next 5 years and are also more certain of their retirement plans.
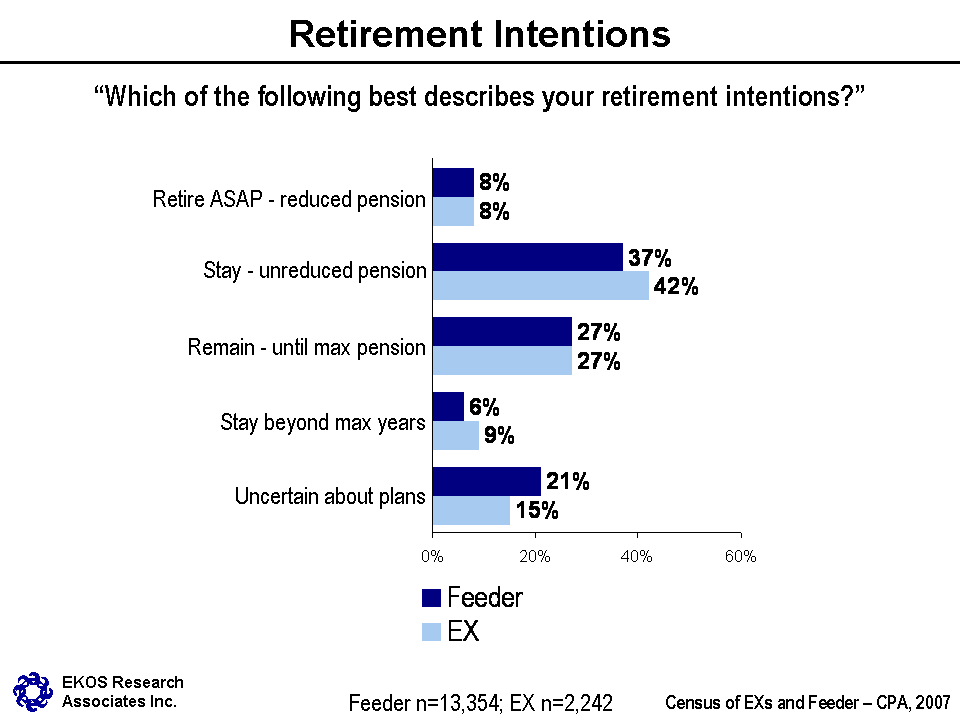
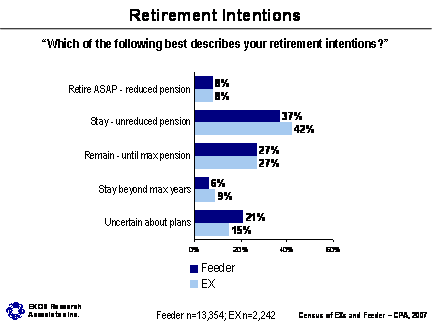
When asked about retirement intentions, only a small proportion of feeder group employees and EXs reported that they expect to be retiring as soon as possible, with a reduced pension. This triangulates well with the few who say that they will be leaving before retirement. Thirty-seven per cent of feeders and 42 per cent of EXs expect to retire with a full pension, although 27 per cent of both groups said that they will try and stay as long as they are able to collect a maximum pension. Six per cent of feeder employees and nine per cent of EXs think that they will stay even beyond the timeframe to collect a maximum pension. Twenty-one per cent of feeders and 15 per cent of EXs are uncertain of their plans.
Pension plan considerations loom large in decisions about when to retire for both groups. Most feeder employees and EXs (78 and 80 per cent, respectively) believe it to be a strong consideration. Fewer than one in ten of both groups say that pension plan considerations are relatively unimportant in their retirement decision.
b) Sub-group differences
Feeder group
- Eight per cent would retire now with a reduced pension.
- Those who are more apt to stay with an unreduced pension work in regions, have between 10-29 years experience in the Public Service, and are over the age of 45.
- Those less certain about their plans more often hold scientific or professional occupations, have less experience with the Public Service (less than 10 years), and are younger (under 40 years of age).
EXs
- Older EXs with more years in the Public Service are more apt than others to say they will stay beyond the time required to collect a maximum pension, as is also the case for EXs who relocated (to the NCR) to join the Public Service (further demonstrating their commitment to federal Public Service).
- Those least certain about their plans are those for whom the decision is farthest away, and who have the least investment in their Public Service career to date (including those with fewer years of service and younger EXs).
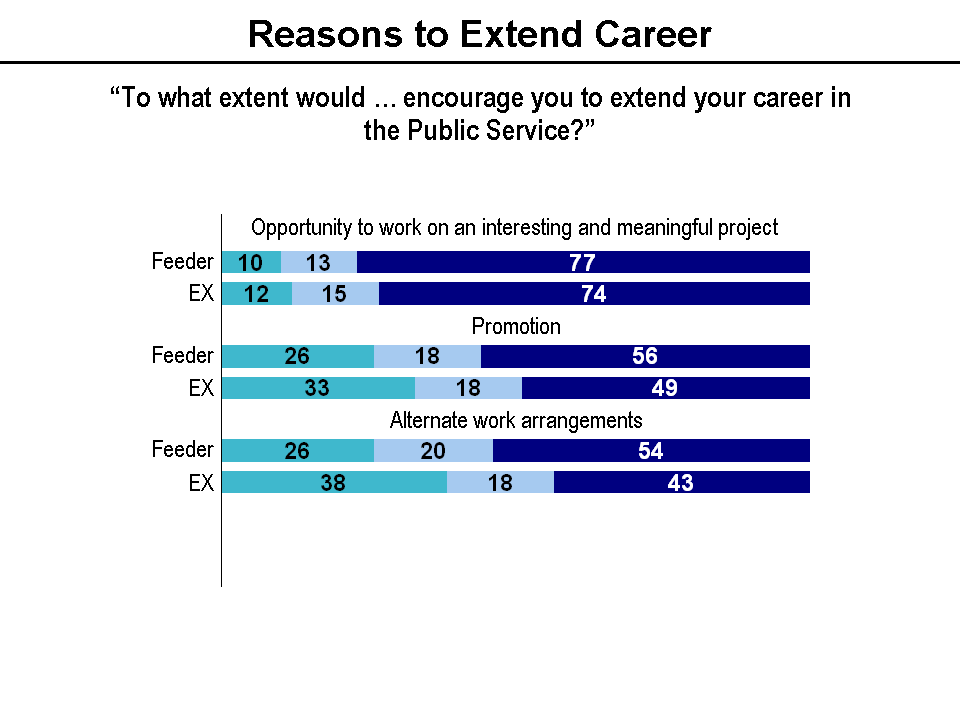
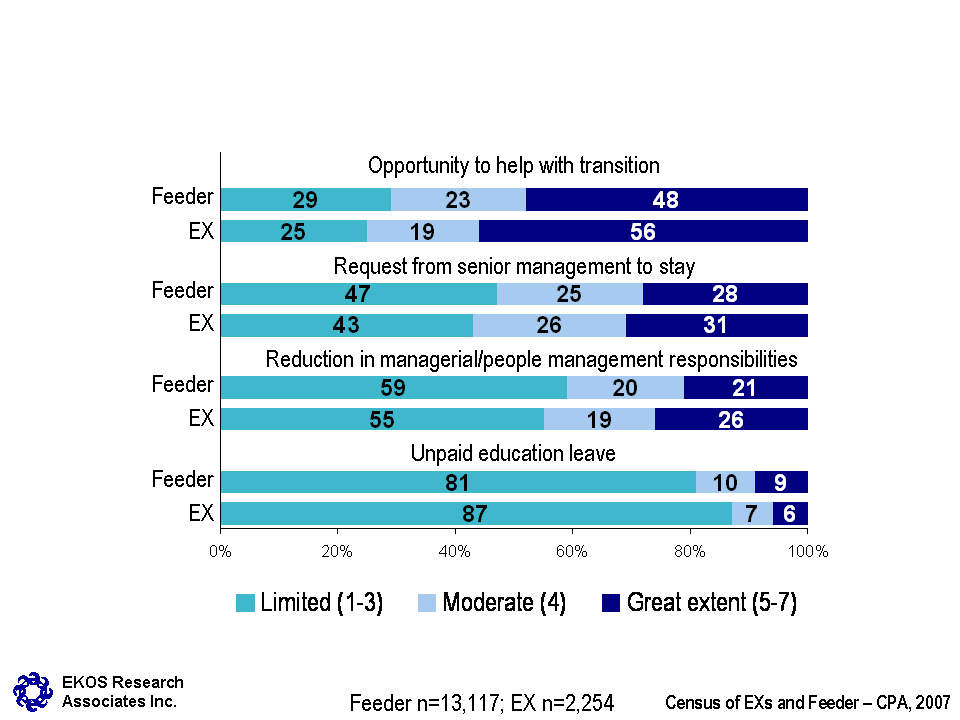
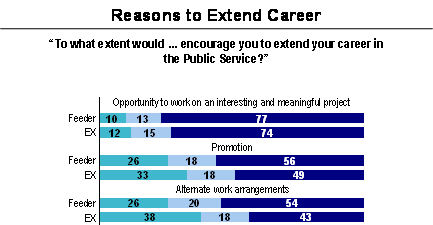
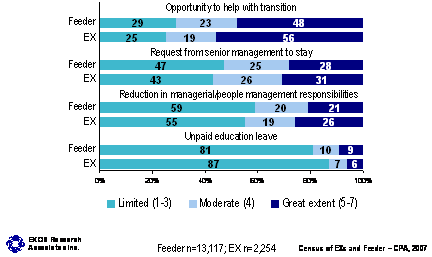
3.7 Extending career in public service
The census tested the potential effectiveness of a number of measures to encourage members of the feeder group and EXs to extend their career in the Public Service. For the feeder group, an opportunity to work on an interesting and meaningful project would encourage over three-quarters to consider extending their career in the Public Service. Over half would be encouraged by a promotion or through alternate work arrangements and just under half would be interested in an opportunity to help with transition. EX minus 2s are more likely to find alternate work arrangements encouraging, compared with others in the feeder group. Over one in four employees in the feeder group would be encouraged by a request from senior management to stay and one in five would find a reduction in managerial/people management responsibilities appealing. Only nine per cent would be motivated to extend their career in the Public Service as a result of unpaid education leave.
By far, the most effective inducement for executives to extend their career would be the opportunity to work on an interesting and meaningful project – three-quarters of executives say this would encourage them to extend their Public Service career to a great extent. A substantial proportion (56 per cent) would also be encouraged to stay in the Public Service if there was an opportunity to help with transition such as through mentoring, coaching and knowledge transfer (which is a greater incentive for EXs than it is for the feeder group). Just less than one-half would extend their stay in the Public Service if they were promoted (although this is less of an incentive than it is for the feeder group). Having an alternate work arrangement such as telework or income averaging would encourage to a great extent fewer EXs (43 per cent) than feeder group members (54 per cent) to extend their career in the Public Service.
Less effective incentives for EXs to defer retirement and extend their Public Service career would be a request from senior management to stay, followed by a reduction in managerial/people management responsibilities. Unpaid education leave is the least attractive incentive to stay in the Public Service.
Display full size graphic - part 1
Display full size graphic - part 2
a) Sub-group differences
Work on an interesting and meaningful project
- Among feeder group members, work experience is strongly associated with willingness to extend their career due to working on an interesting and meaningful project, with the most experienced being the least apt to be enticed by interesting and meaningful work. This is followed by level of education (which increases one's interest in meaningful and interesting work).
- For EXs, meaningful work is a particularly strong enticement to extend their career in the Public Service. Among EXs, age is strongly associated with citing meaningful work (with the youngest being the most keen), followed by years of service in the Public Service.
Promotion
- Among feeder group members, a promotion is more likely to encourage those individuals working in scientific or professional occupations, while it is less encouraging for those in the technical field. It is also more encouraging for less experienced public servants (with less than 10 years in the Public Service), while it is less encouraging for those with more experience (over 20 years experience). Once again, however, it is age that is highly associated with interest to be promoted. This is followed by years within the Public Service, as well as first language (with Anglophones expressing a greater interest).
- For feeder group members intending to work the minimum to qualify for a pension, promotion is less of an inducement to extend their career in the Public Service.
- A promotion is also more encouraging for EXs with fewer years of service.
Alternate work arrangements
- Women and younger public servants are encouraged to a greater extent by alternative work arrangements.
Request from senior management
- Older EXs (55 and over) are more apt to see a request from senior management to stay as an encouragement for them to extend their Public Service career.
Reduction in managerial/people management responsibilities
- For EXs who are intending to leave prior to earning their full pension, and/or work the minimum time to qualify for a pension, reductions in managerial/people management responsibilities is a more appealing than it is for other EXs.
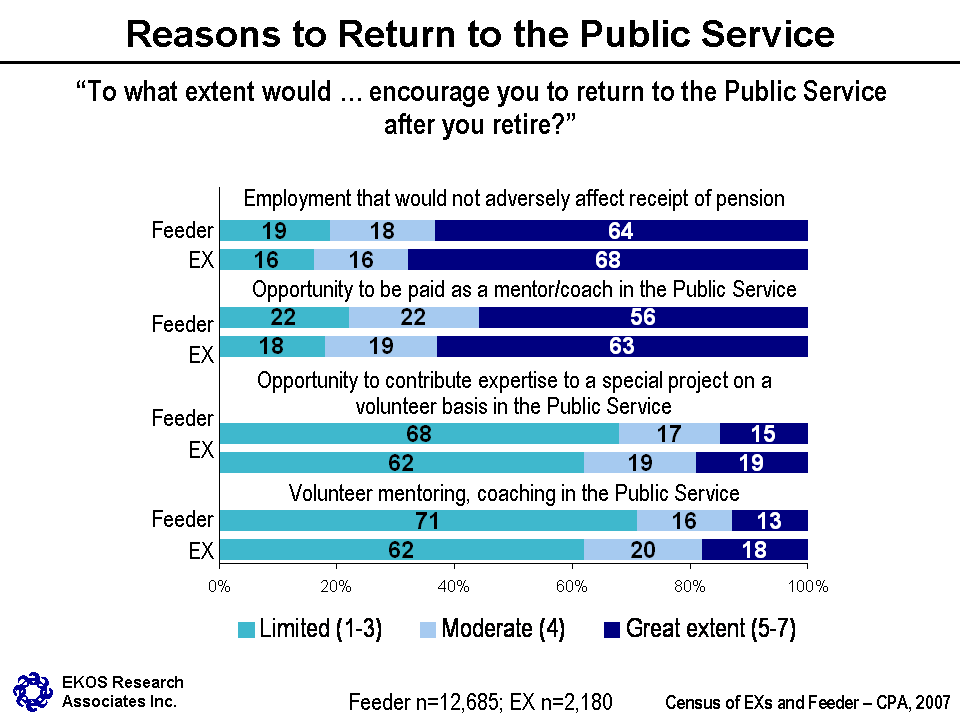
3.8 Returning to the public service
A series of proposed "initiatives" were tested with the feeder group and executives to determine they would be effective in encouraging them to return to the Public Service after they retire. Of the four measures tested, employment that would not adversely affect the receipt of their pension and an opportunity to be paid as a mentor/coach in the Public Service were most highly rated.
Far less effective was the opportunity to contribute expertise to a special project on a volunteer basis and volunteer mentoring or coaching.
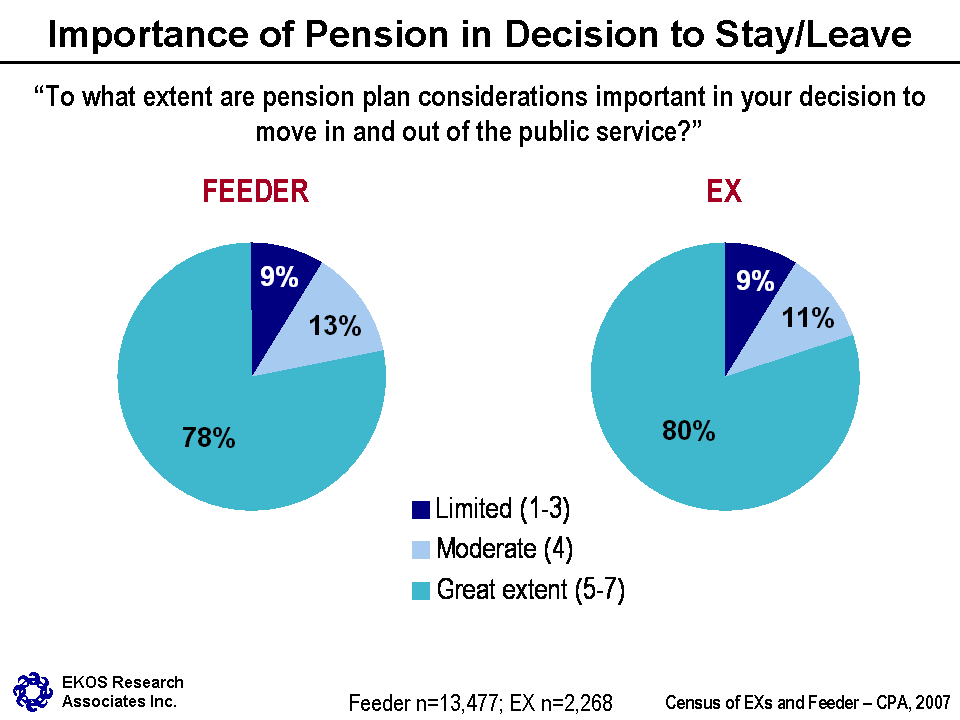
Members of the feeder group and EXs hold similar views in terms of the extent to which pension plan considerations are important in their decision to move in and out of the Public Service. Over three quarters (78 per cent) of the feeder group and eight in ten EXs consider their pension plan to a great extent when making retirement decisions. It should be noted, however, that 16 per cent of EXs and 22 per cent of feeder employees were unable to provide an answer to this question.
a) Sub-group differences
Feeder group:
- Pension plan considerations are more important for older employees (over 45) and those with more years in the Public Service.
4. Learning and development
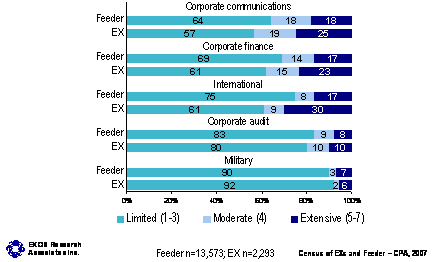
4.1 Experience in different areas
In order to explore the extent to which members of the feeder group and EXs in the core public administration are taking up learning and development opportunities, the census examined their current level of practical experience in a range of areas.
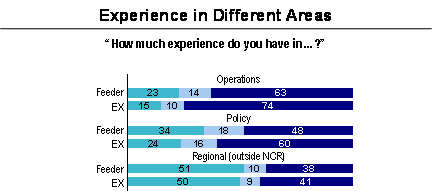
Both groups report the greatest practical experience in operations and policy. Close to two-thirds of feeder group members have extensive experience in operations, as do EXs. Within the feeder groups, EX equivalents report the least operations experience, with EX minus 1s reporting slightly more than EX minus 2s (69 and 64 per cent respectively, compared with 50 per cent of EX equivalents reporting extensive operations experience). Close to half of the feeder group and sixty per cent of EXs have extensive policy experience. EX minus 1s have more extensive experience in policy compared with EX minus 2s.
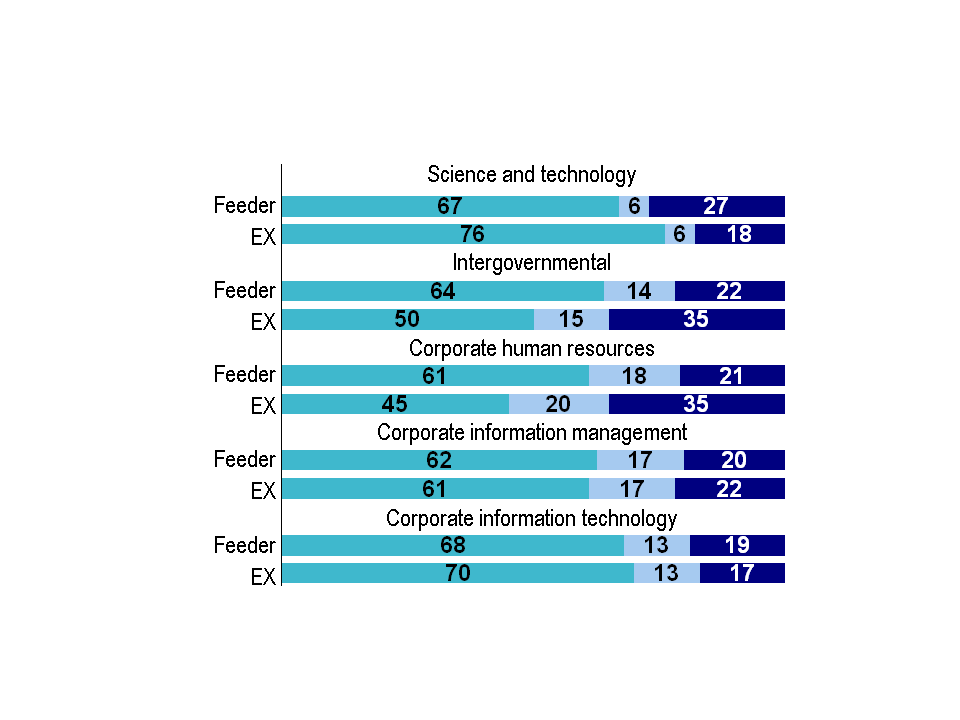
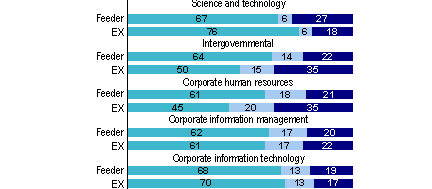
Close to four in ten feeder group members and EXs report extensive regional experience. Furthermore, just over one quarter of feeder group members have extensive experience in science and technology, although this is lower among EXs. Among feeder employees, EX equivalents are equipped with the most experience in science and technology.
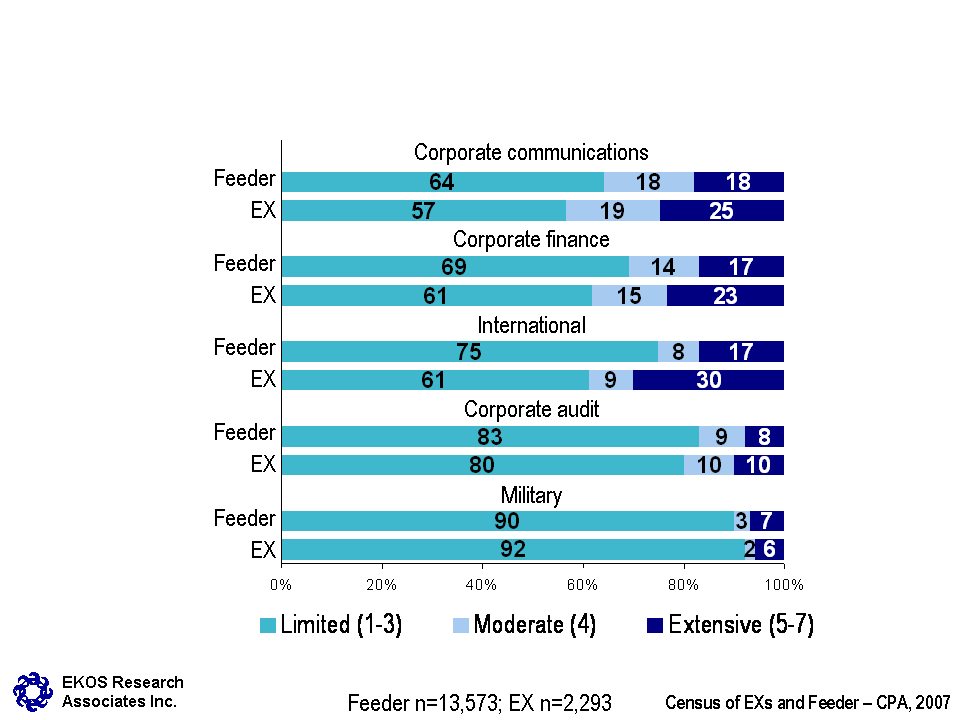
Over one third of EXs report extensive experience in intergovernmental affairs (35 per cent, compared to 22 per cent of feeder group members) and corporate human resources (35 per cent, compared to 21 per cent of the feeder group). Another three in ten EXs have extensive international experience (30 per cent, compared to 17 per cent of feeder group members).
Display full size graphic - part 1
Display full size graphic - part 2
Display full size graphic - part 3
a) Sub-group differences
- Members of the feeder group in the top ten feeder categories are more likely than others to report considerable experience in policy, intergovernmental affairs, and corporate human resources; but are less apt to have extensive experience in science and technology.
- Feeder group members in science and professional occupations are less apt to have extensive operations experience, but are more likely to have extensive experience in policy and intergovernmental affairs. Those in administrative or foreign service occupations are more apt to possess experience in corporate human resources, information management, information technology, corporate finance and corporate communications; but are less likely to have extensive experience in science and technology. Finally, those in technical or other occupations are more likely to have extensive operations and regional experience, but less likely to have extensive policy experience.
- Regional employees are more apt to hold extensive operations experience (71 per cent of feeder groups and 88 per cent of EXs do, versus 59 and 69 per cent respectively of those in the NCR), while those in the NCR are more apt to have extensive policy experience.
- Men are more apt than women to report extensive regional, science and technology, corporate information technology and military experience.
- Operations experience declines with educational attainment, while the reverse is true of policy experience. Experience in science and technology and intergovernmental affairs also increases with educational attainment; while corporate information management and human resources experience tend to decline with education.
- The extent to which EXs have experience in policy and intergovernmental affairs increases with their seniority.
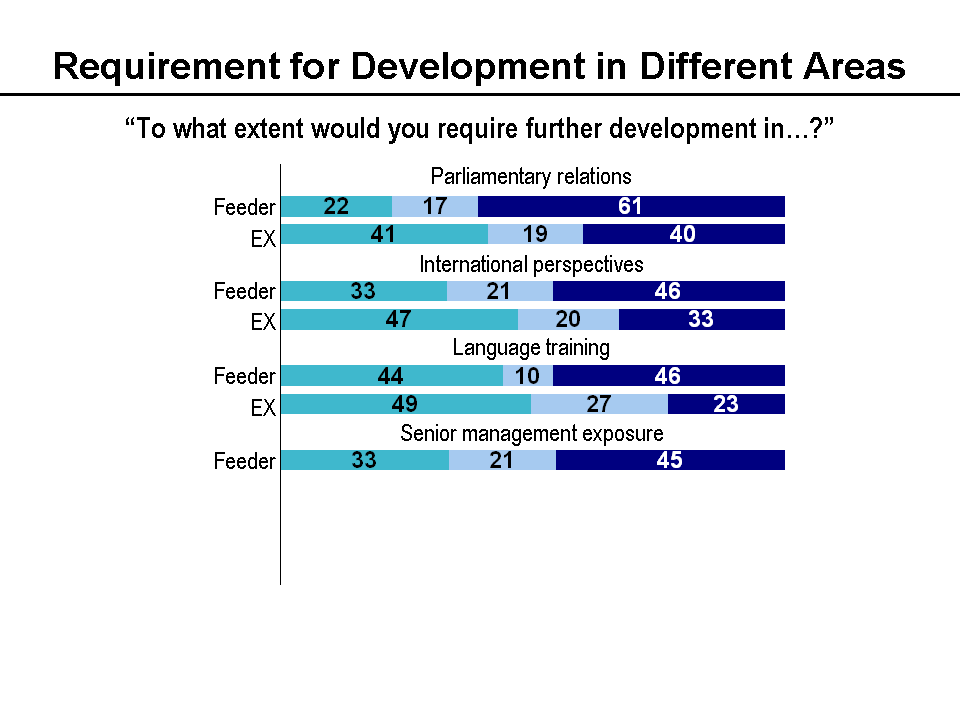
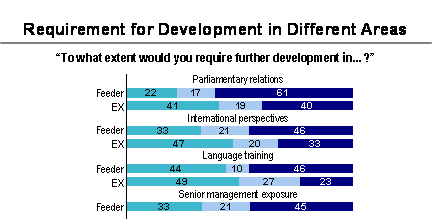
4.2 Development requirements
Feeder group members identify an extensive need for development in a number of different areas. By far the greatest development need identified is in the area of parliamentary relations; identified as a high priority by 61 per cent. EX minus 2s report the most development needs in this area and EX equivalents report the least. Furthermore, over four in ten feeder group members identified a great need for development in international perspectives (46 per cent), language training (46 per cent), and senior management exposure (45 per cent). EX minus 2s, once again, are more apt to say they require further development in these areas, compared to EX equivalents and EX minus 1s. In terms of language training needs, most of the feeder group identified either a great need (46 per cent) for training or limited need (44 per cent).
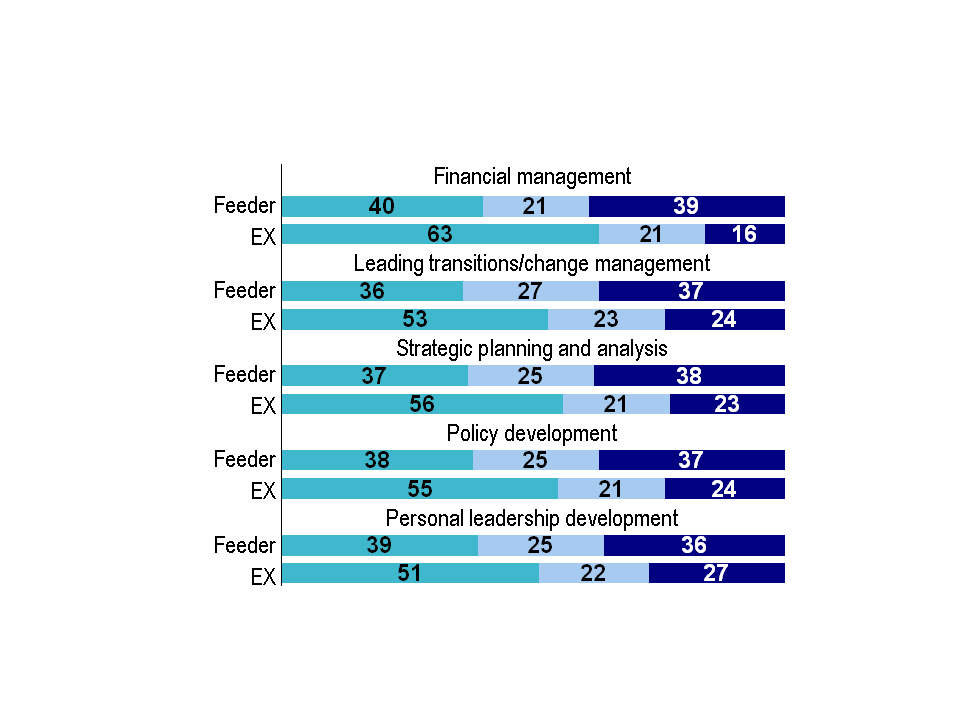
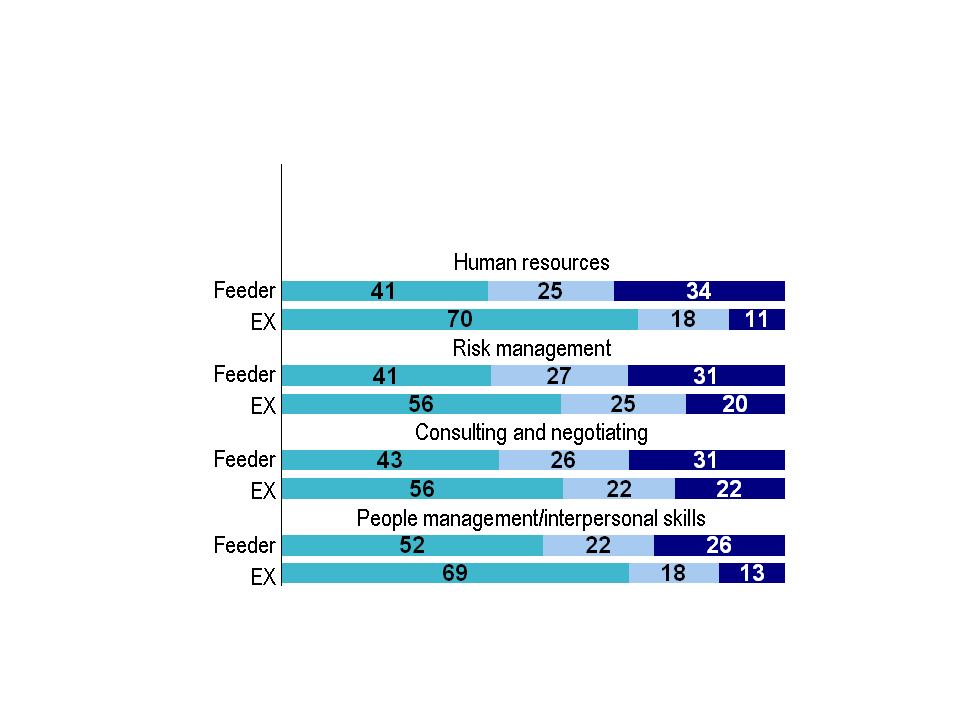
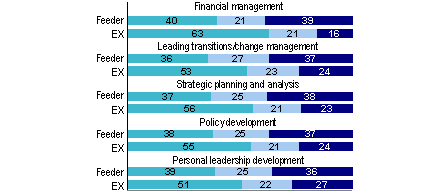
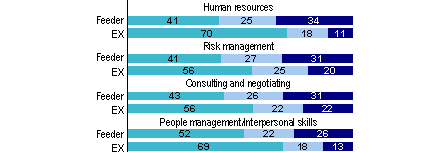
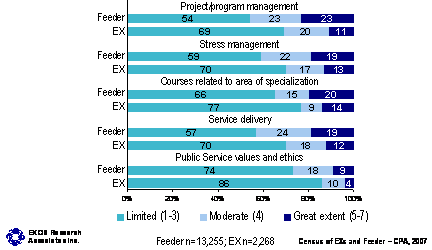
Over one third of feeder group members cited a need for development in a number of other areas, namely financial management, change management, strategic planning and analysis, policy development, personal leadership development, and in human resources. More than one quarter identified a need for development in risk management, consulting and negotiating, and people management or interpersonal skills. In all of these areas EX minus 2s were more apt to report that they require further development.
The reported development needs of feeder group members are much greater than those of executives. The top two development needs identified by executives are the same as cited by the feeder group: parliamentary relations (40 per cent), and international perspectives (33 per cent). Over two in ten executives also identify a strong need for development in a number of other areas, including personal leadership development (27 per cent), change management (24 per cent), policy development (24 per cent), senior management exposure (23 per cent), language training (23 per cent), strategic planning and analysis (23 per cent), and consulting and negotiating (22 per cent).
Results cannot be directly compared to findings from the 2002 survey of feeder groups. However, training needs identified in 2002 were somewhat similar, with political level work being identified most often as an important training need (by 54 per cent), followed by second language training (51 per cent), leadership skills (46 per cent), and policy development (46 per cent).
Display full size graphic - part 1
Display full size graphic - part 2
Display full size graphic - part 3
Display full size graphic - part 4
a) Sub-group differences
- The need for development is generally strongest among feeders not in the top ten categories.
- Feeder group members in scientific and professional positions are less apt than those in other positions to identify a significant need for development in parliamentary relations or international perspectives, and more apt to identify a need for development in financial management.
- Regional feeder and regional EX employees are more apt than others to identify a need for language training.
- The need for senior management exposure declines with the number of years in the Public Service for feeder group members. The same is true for a number of development areas, including financial management, change management, strategic planning, people management, service delivery and program management. Within the EX population, the need for development in all areas tested declines significantly with years of service.
- Women within the feeder population are more apt than men to identify a need for development in a number of areas including international perspectives, financial management and change management; while men are more apt to identify a need for language training. Women in the EX ranks are also more apt than men to identify a need for development in several areas including international perspectives and change management.
- Those with a graduate degree are less likely than others to report the need for development in a number of areas, including international perspectives, parliamentary relations, and policy development, but more often feel the need for more financial and people management.
- Anglophones are much more likely to list language training as a development need.
- Members of visible minority groups in the feeder group are also proportionately more likely to report a need for greater senior management exposure and language training, as well as development in financial management, change management, personal leadership and strategic planning. Aboriginal people in the feeder group are more apt than others to identify a need for language training and greater senior management exposure.
- Among EXs, members of visible minority groups were more inclined to list the following as needing further development: parliamentary relations, second language training, personal leadership development, change management, consulting and negotiating, people management and human resources. Aboriginal EXs indicated a need for second language training and development in international perspectives and service delivery.
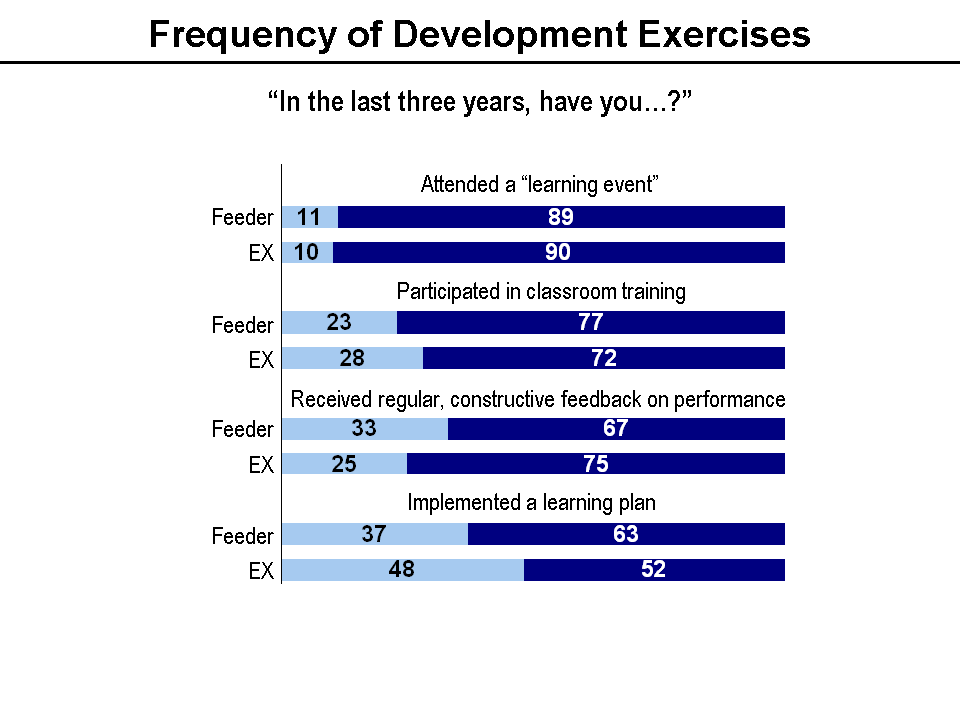
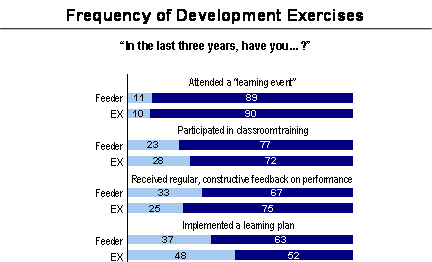
4.3 Frequency of Development Exercises
Most feeder group members have attended a "learning event" such as a presentation, conference or workshop in the last three years (89 per cent), and just over three quarters have participated in classroom training (77 per cent). EX equivalents are less likely to have participated in classroom training than EX minus 1s or 2s. Results for EXs are quite similar on these two points; 90 per cent of EXs have attended a "learning event" and 72 per cent have participated in classroom training.
Roughly two thirds of feeder group members indicate having received regular, constructive feedback on their performance (67 per cent), and 63 per cent have implemented a learning plan in this time-frame (three years). In comparison, EXs are more apt to have received feedback on performance (75 per cent have), but are less likely to have implemented a learning plan (52 per cent have).
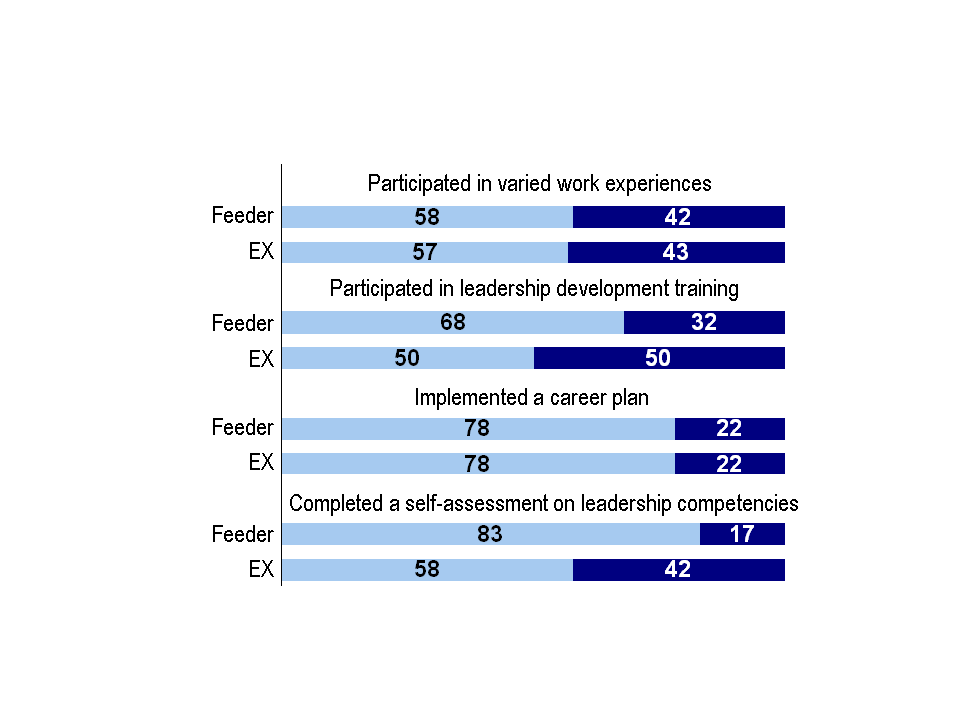
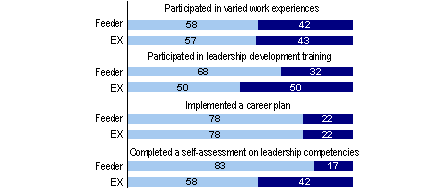
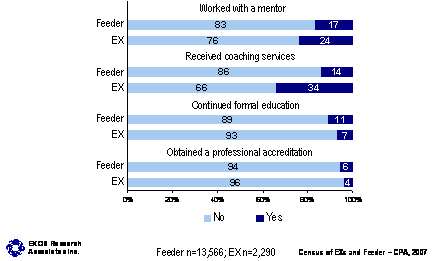
Less than half of both feeder group members and EXs have participated in varied work experiences such as rotational jobs, acting assignments or job shadowing in the past three years. EX equivalents are less likely to have participated in these varied work experiences than other feeder employees. Almost one third of feeder group members have participated in leadership development training (32 per cent) within the past three years, while fully 50 per cent of EXs have. A greater portion of EX minus 1s have participated in this kind of training more than other feeder groups. Just over two in ten employees have implemented a career plan (22 per cent for both feeder groups and EXs).
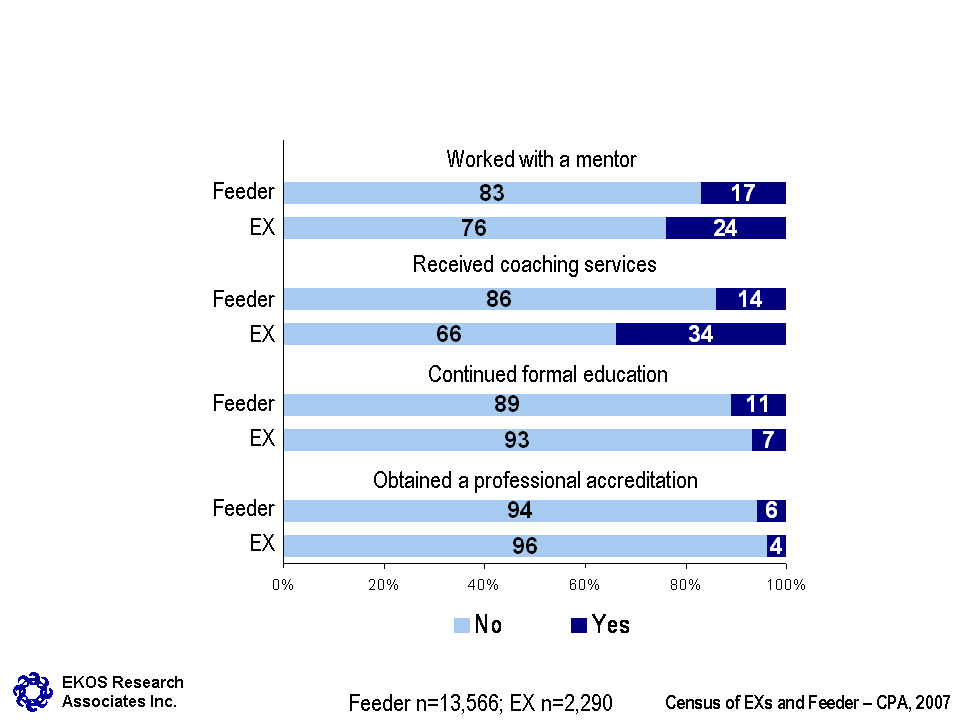
Feeder group members are less apt to have engaged in any other development activities listed, including completing a self-assessment on leadership competencies (17 per cent), working with a mentor (17 per cent), or receiving coaching (14 per cent), although more EX minus 1s had completed a self assessment on leadership competencies compared to EX equivalents and EX minus 2s. EXs are significantly more likely to have engaged in these activities, with 42 per cent having completed a self-assessment on leadership competencies, 34 per cent having received coaching services, and 24 per cent having worked with a mentor.
Relatively few respondents from either the feeder or EX community have continued formal education or obtained a professional accreditation within the past three years.
Display full size graphic - part 1
Display full size graphic - part 2
Display full size graphic - part 3
a) Sub-group differences
- Feeder group members in technical occupations are less apt than others to have implemented a learning plan.
- Regional members of the feeder group (38 per cent) are more likely than those working in the NCR (29 per cent) to have had the opportunity to participate in leadership development training.
- The proportion of feeder group members with a learning plan or career plan declines with increasing length of service and age. Similarly, participation in classroom training in the last three years is less likely among EXs with greater age and years of service. Younger EXs and feeders or those with less years of service are more inclined to have worked with a mentor than their older counterparts or those with greater lengths of service.
- Women are more apt to have implemented a learning plan than are men. Within the EX population, women are also more apt than men to have participated in classroom training, in varied work experiences, and to have obtained mentoring or coaching services.
- Aboriginal people in the feeder group are somewhat more likely than other feeders to have implemented a learning plan within the past three years (73 per cent compared to 63 per cent), or to have participated in leadership development training (39 per cent compared to 32 per cent).
Census respondents who have received coaching services within the preceding three years were asked to indicate the source of these coaching services. Feeder group members most commonly received coaching services from within their own department or agency. Over one quarter obtained the services of a private vendor and two in ten received coaching from the PSC. Just over one in ten feeder group members identify other sources.
In contrast, EXs more commonly obtained coaching services from the Public Service Commission (PSC) (39 per cent) or a private vendor (40 per cent), while only one third obtained coaching services from within their own department or agency. Furthermore, almost one quarter of EXs who obtained coaching services indicate that these were provided by a leadership development program, and seven per cent obtained coaching services from the Association of Professional Executives of the Public Service of Canada (APEX).
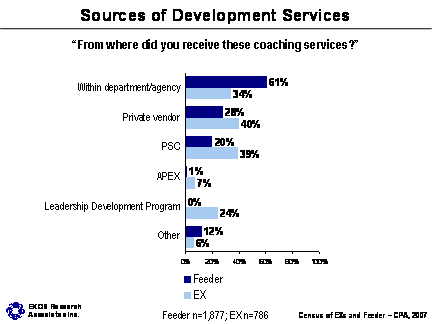
b) Sub-group differences
- Feeder group members located within regions are more apt than those in the NCR to have received coaching services from within their own department or agency.
4.4 Interest in leadership development programs
Level of interest in a variety of development programs was explored with both feeder group and EX respondents. Feeder group members demonstrate greatest interest in participating in organizational or departmental leadership development programs available to them (44 per cent are very interested in such programs) with EX minus 2s expressing the most interest. Four out of ten feeder employees express great interest in the Accelerated Executive Development Program (AEXDP). EX equivalents are less interested in participating in AEXDP than other feeder employees. Over three in ten feeders are also very interested in participating in Interchange Canada or in the Career Assignment Program (CAP). EX minus 2s are more interested in participating in CAP while EX equivalents are the least interested. Roughly one quarter of feeder group members demonstrate strong interest in the Recruitment of Policy Leaders Program or the Government of Canada Fellows Program, while fewer are interested in the CAP for functional communities (17 per cent). EX equivalents were more interested in the Government of Canada Fellows Program than others in the feeder group, however, they are far less interested in CAP for functional communities.
It is important to note, however, that a significant proportion of feeder group members (between 10 and 29 per cent) lacked knowledge or awareness of these leadership development programs, prompting them to answer "don't know". In particular, 29 per cent answered "don't know" for the Government of Canada Fellows Program, 17 per cent for Interchange Canada, 16 per cent for CAP for functional communities, and between 10 and 11 per cent answered "don't know" on other programs (departmental programs, AEXDP, the Recruitment of Policy Leaders Program and CAP).
EXs are most interested in participating the in Interchange Canada (37 per cent are very interested), followed by leadership development programs within their own departments (29 per cent are very interested). Roughly one quarter of EXs state a strong interest in participating in AEXDP or the Government of Canada Fellows Program. The only program for which a substantial proportion of EXs answered "don't know" on this question (suggesting a lack of knowledge of the program) is for the Government of Canada Fellows Program (for which 19 per cent answered don't know).
Display full size graphic - part 1
Display full size graphic - part 2
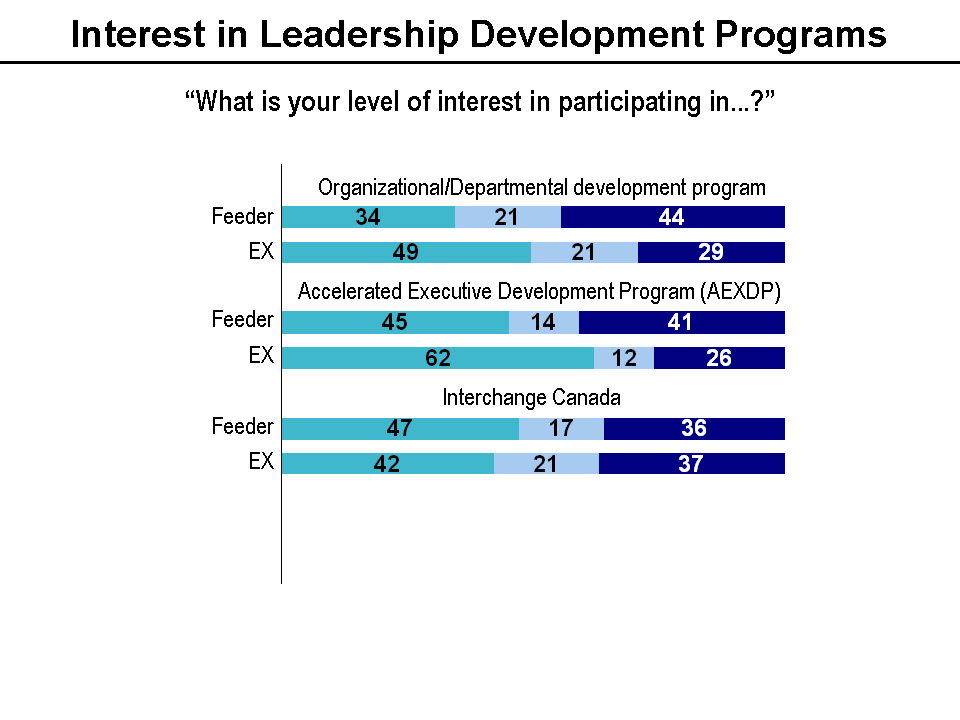
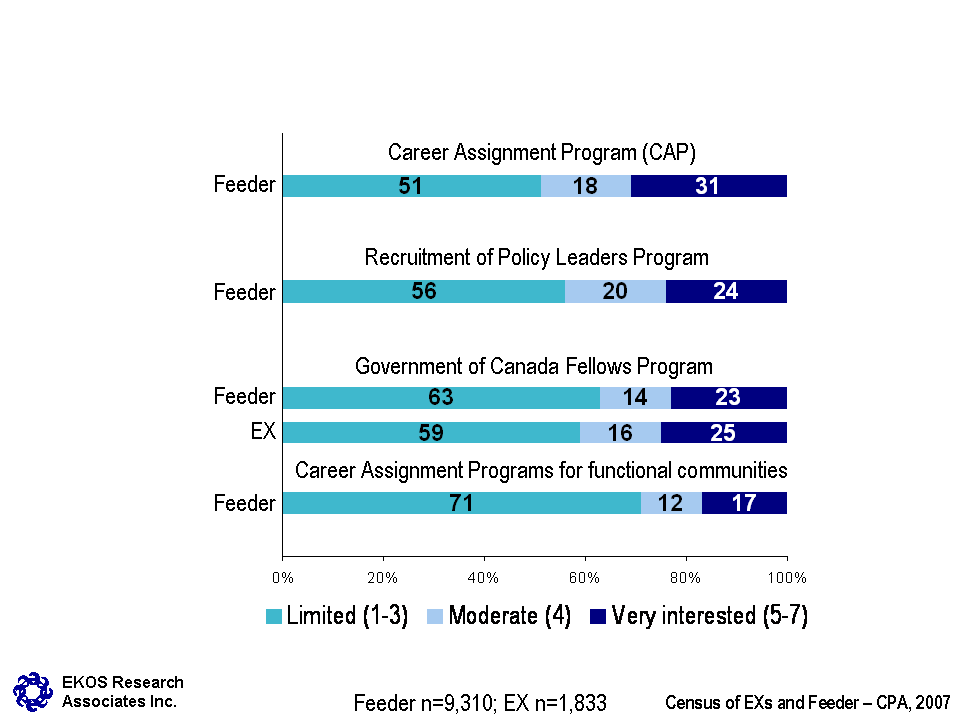
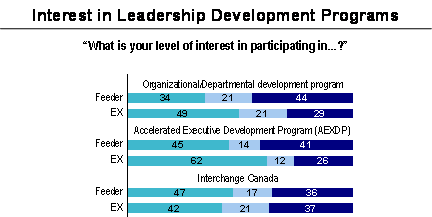
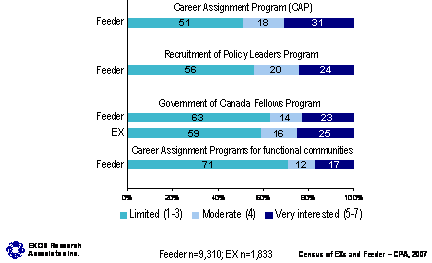
a) Sub-group differences
Overall patterns
- Interest in participating in leadership development programs declines rapidly with age and years of service for both feeder group and EX respondents.
- Feeder group members who are members of visible minority groups express much greater interest in all the leadership development programs tested (e.g., 63 per cent are very interested in AEXDP and 55 per cent in Interchange Canada), followed by Aboriginal people in the feeder group (e.g., 53 per cent are very interested in AEXDP and 44 per cent in CAP). Within the EX population, all equity groups (Aboriginal peoples, members of visible minorities and people with a disability) express relatively greater interest than others in most development programs listed.
Organizational/departmental development programs
- Within the feeder group, women express greater interest than men in these programs.
Accelerated executive development program (AEXDP)
- Interest declines with seniority among EXs (from 33 per cent of EX-01s to three per cent of EX-04/05s).
Interchange Canada
- Feeder group members in scientific or professional occupations express relatively greater interest in participating (42 per cent are very interested) than do those in the other occupational categories.
4.5 Barriers to participating in leadership development programs
The most common barrier to participation in leadership development programs is that feeder group members and EXs are too busy at work to be able to free time to participate, learn about and apply to programs. Fully six in ten feeder group members identify being "too busy at work" as a factor greatly limiting their participation in leadership development programs. EX equivalents were more likely than other employees to cite this as a limitation. In addition to being too busy, participation in leadership development programs is limited by lack of knowledge or familiarity with the programs available and their eligibility criteria. Over four in ten feeder group members indicate that their participation is greatly limited by a lack of awareness of programs (45 per cent) or of their eligibility criteria (41 per cent), and a further 35 per cent are limited by not knowing where to obtain information on programs. EX minus 1s were more likely to rate the extent of their limitation as very low (in terms of these three factors) than EX equivalents or EX minus 2s. One third cites a lack of support from management as a factor severely limiting their participation and the same number indicate that limited enrolment in these programs has restricted access. EX minus 2s were more likely to cite these two factors as limitations.
Roughly one quarter of feeder group members were disinterested in participating as they said they did not believe these programs would provide enhanced opportunities for advancement (26 per cent), and a similar number said they were prevented from participating by an inability to meet eligibility criteria (24 per cent). While EX equivalents view lack of provision toward advancement as a limitation in their participation in leadership development programs, EX minus 2s were more likely to view inability to meet eligibility criteria as their main set back. Fewer than two in ten feeder group members cite lack of interest in programs.
As with feeder group members, EXs most often state that their participation is limited by the fact that they are too busy at work (58 per cent). One quarter of EXs express a lack of interest in participating based on the view that these programs will not provide greater opportunity for advancement, while two in ten are hampered by limited enrolment in these development programs. Lack of awareness or knowledge of programs plays a far smaller role in limiting participation of EXs in development programs, as fewer than two in ten cite a lack of awareness of programs (17 per cent), lack of awareness of eligibility criteria (15 per cent), or lack of awareness of where to obtain information (12 per cent). A total of 18 per cent of EXs cite insufficient support from management as a factor strongly limiting their participation in development programs, and a similar number (17 per cent) point to a lack of interest. Only 12 per cent indicate that they are limited from participating by eligibility criteria.
Again, the lack of familiarity of some respondents with leadership development programs is reflected in the number responding "don't know" to several of these statements, particularly among feeder group members. In particular, one third of feeder group members (and 16 per cent of EXs) responded "don't know" to whether an inability to meet eligibility criteria has been a barrier; 26 per cent (and 10 per cent of EXs) answered "don't know" in terms of whether limited enrolment has acted as a barrier to participation; and 20 per cent (and seven per cent of EXs) as to whether these programs will not provide additional advancement opportunities.
Results from the 2002 survey of feeder group members indicate that many of these barriers have remained unchanged. In 2002, feeder group members most frequently identified lack of time (49 per cent) and lack of awareness of eligibility criteria (43 per cent) as barriers to participation. Relocation requirements, lack of awareness of information sources, insufficient support from management and poor likelihood of this leading to advancement were also identified as barriers.
Display full size graphic - part 1
Display full size graphic - part 2
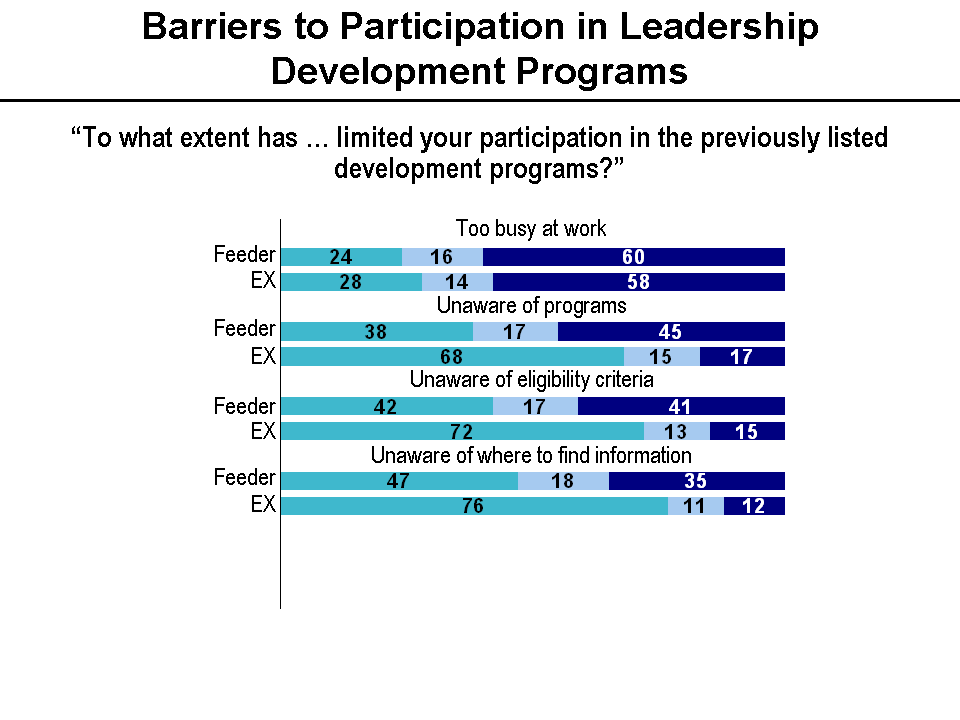
a) Sub-group differences
Insufficient support from management
- Insufficient support from management was reported to be more of a barrier to feeder group members with a disability or who are visible minorities (44 per cent) than for all feeders (33 per cent).
- The extent to which lack of support from management presents as a barrier to EXs declines as EX level gets higher: this was cited as a problem by 21 per cent of EX-01s and 15 per cent of EX-02s, compared to eight per cent of EX-04/05s.
Limited number of participants
- Visible minority (53 per cent) and Aboriginal (43 per cent) feeder group members reported limited number of participants as a barrier to participation more than all feeders did (33 per cent).
- EXs with a disability (34 per cent) and Aboriginal EXs (33 per cent) reported limited number of participants as a barrier to participation more than all EXs did (20 per cent).
Unaware of programs, unaware of eligibility criteria, unaware of where to find information
- The extent to which lack of knowledge presents a barrier to participation declines with years of service for feeder groups and EXs.
- Within EX ranks, women are less likely than men to identify lack of knowledge as a barrier.
4.6 Language training as a barrier to progression
Lack of access to language training is a significant concern for a minority; it is, however, a major barrier to career progress for relatively more feeders than EXs. Over one quarter of feeder group members believe that lack of access to language training has adversely affected their career progress in the Public Service, compared to only 12 per cent of EXs. Lack of access to language training has had a moderate adverse effect on only nine per cent of feeder group members and six per cent of EXs; while 62 per cent of feeder group members and 81 per cent of EXs identify it as having a limited effect on their career progression.

a) Sub-group differences
- Among both feeder groups and EXs, lack of access to language training is a much greater concern for Anglophones, and for those who have not had their language proficiency tested or who have not met the CBC profile.
- Access to language training is a great concern for larger proportions of employment equity group members for both feeder groups and EXs. Among feeder groups, this was cited as a 'great' problem by 42 per cent of persons with a disability, 40 per cent of visible minorities and 33 per cent of Aboriginal respondents, compared to 28 per cent of others. Within the EX ranks, 26 per cent of Aboriginal respondents, 25 per cent of visible minorities and 19 per cent of persons with a disability responded similarly, compared to 12 per cent of other EXs.
4.7 Barriers to learning objectives
As with barriers to participation in development programs, being too busy at work is cited most often by both feeder group members and EXs as a barrier to reaching the objectives in their learning plan (by 66 per cent of feeder group members and 69 per cent of EXs). Other barriers to completing a learning plan are cited less often by EXs than by feeder group members. Lack of funds and insufficient support from management are cited by over three in ten feeder group members, and close to two in ten EXs, which is followed closely by lack of availability of adequate learning activities (identified by 29 per cent of feeder group members and 17 per cent of EXs). EX minus 1s are less likely (than other feeder employees) to feel that lack of funds or unavailability of adequate learning activities have prevented them from reaching the objectives in their learning plan. Fewer identify a lack of information as a barrier (which was more apt to be seen as a barrier to participating in leadership development programs), while lack of interest is identified as a barrier by only a small minority of feeder group members or EXs.
Display full size graphic - part 1
Display full size graphic - part 2
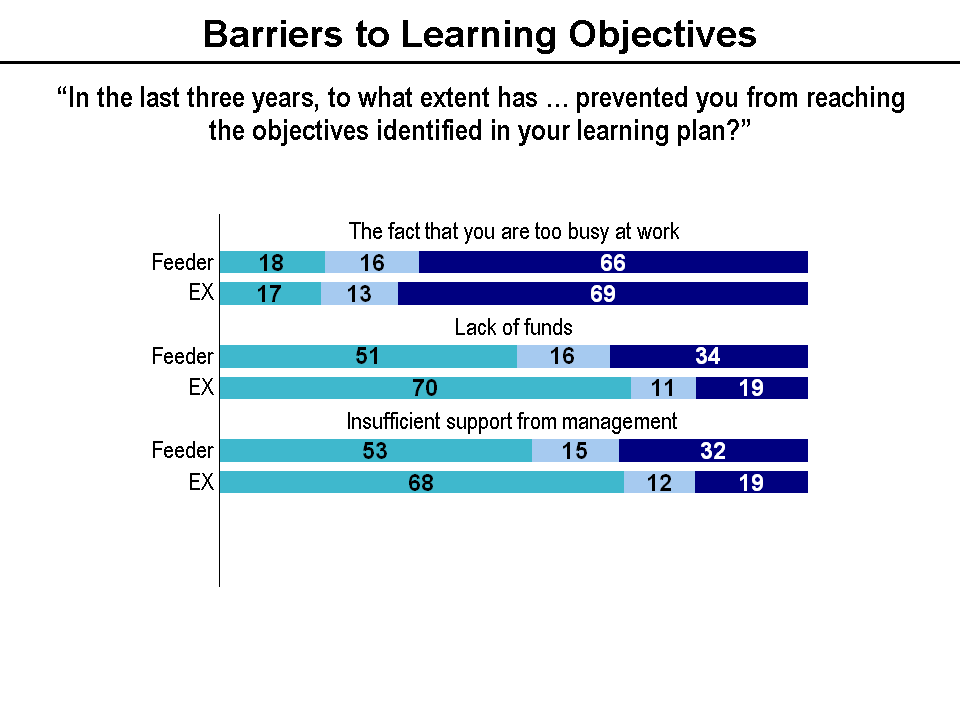
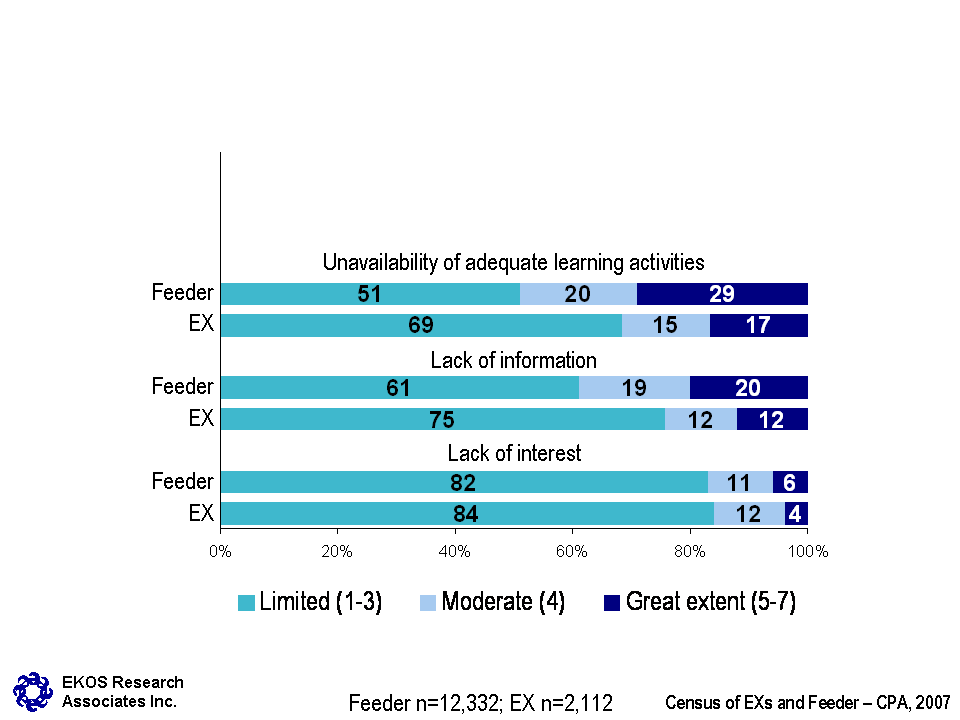
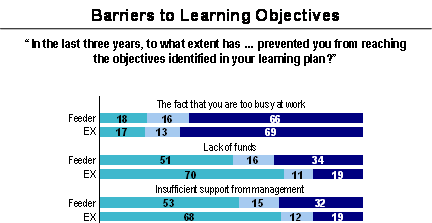
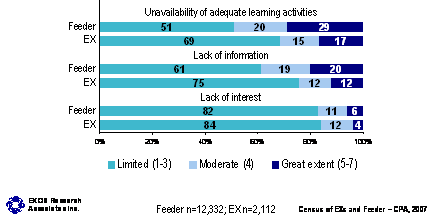
a) Sub-group differences
Too busy at work
- Those with 30 years in the Public Service or more (feeder groups or EXs) are less apt to identify being too busy at work as a barrier. Similarly, the propensity to identify this as a barrier declines with age.
Lack of funds
- EXs located in regions are more apt to identify lack of funds as a barrier than are those in the NCR (27 per cent do, compared to 18 per cent in the NCR).
- Feeder group members who are Aboriginal peoples, disabled or members of a visible minority group are more apt to identify lack of funds as a barrier. The same is true for members of employment equity groups in the EX category.
Insufficient support from management
- Within the feeder group, employment equity group members are more likely to identify insufficient support from management as a barrier than other feeder group members. While 32 per cent of other feeder group respondents cited this as a barrier to reaching the objectives in their learning plans, 42 per cent of those with a disability, 41 per cent of members of a visible minority group and 39 per cent of Aboriginal respondents indicated the same.
Unavailability of adequate learning activities
- Feeder group members not in the top ten occupations leading to an EX position are more apt to identify unavailability of adequate learning activities as a barrier.
- EXs located in regions are more apt to identify unavailability of adequate learning activities as a barrier compared to those in the NCR.
- The proportion identifying unavailability of adequate learning activities as a barrier declines with years of service (for both feeder groups and EXs), and with age (for feeder groups).
- EXs with a disability are more apt to identify unavailability of adequate learning activities as a barrier than are other EXs.
4.8 Participation in leadership development programs
Very few feeder group members or EXs have participated in any of the leadership development programs tested in the census. Roughly three-quarters (74 per cent) of feeder group members and 58 per cent of EXs have not participated in any of the programs listed. Respondents have most commonly participated in organizational or departmental programs offered (12 per cent of feeder groups and 17 per cent of EXs). EXs are more likely to have participated in most programs identified than are feeder groups.
Display full size graphic - part 1
Display full size graphic - part 2
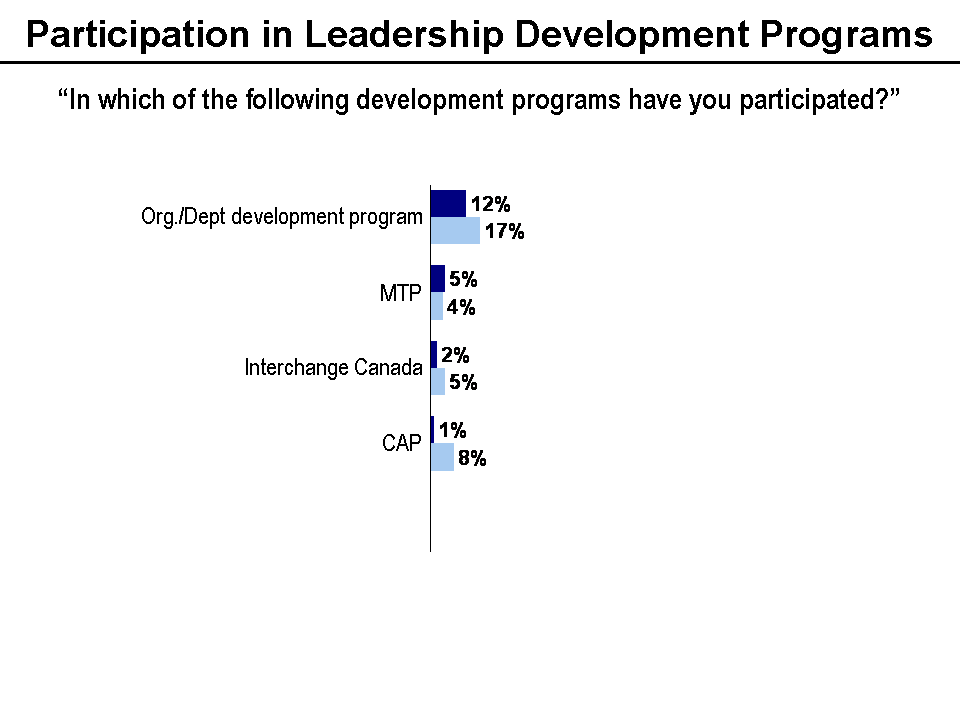
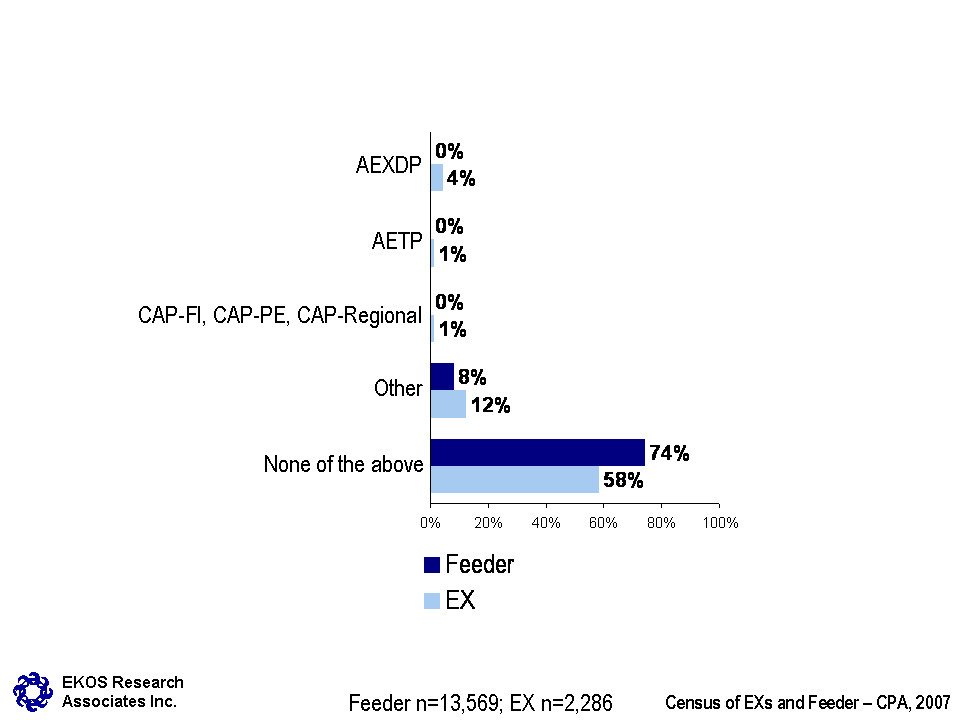
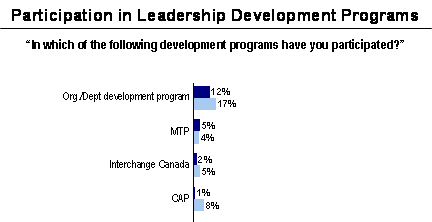
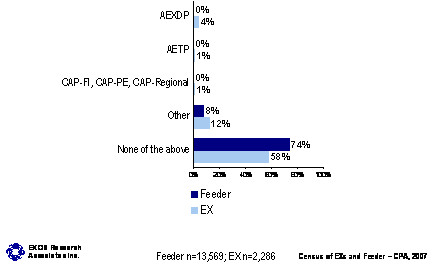
a) Sub-group differences
- Feeder group members who are not in the top ten occupations are less apt to have participated in any of these programs.
- The proportion that has not participated in any program declines with educational attainment for EXs.
- The proportion of EXs who have participated in departmental development programs increases with years of service, while those with less than 10 years of service are more apt to have participated in Interchange Canada. Furthermore, EXs under the age of 45 are more apt to have participated in MTP compared to other EXs.
- Among EXs, visible minorities are more likely to have participated in CAP (20 per cent compared to nine per cent of others), while Aboriginal respondents were less likely to have participated in departmental development programs.
5. Profile of census respondents
A general profile of the respondents to the census is useful in understanding who responded and how closely they resemble the broader population of EXs and feeder group employees. It also provides a useful picture of where these populations are moving over time. Lastly, it builds a useful foundation upon which to understand sub-group differences in responses to the census insofar as it paints a picture of the interlinking characteristics of different groups within the population (e.g., Francophones who are more concentrated in some regions, or women who are, on average, younger) and allows for a better understanding of how some variables are interrelated.
5.1 Gender and age
Slightly under half of respondents are women. The proportion is higher in the feeder group (45 per cent) compared with EXs (41 per cent). The average age of the feeder groups is 47. EXs are, on average, older than the feeder group, with an average age of 51. Women are typically younger than men in both the feeder and EX groups.
Although men outnumber women within feeder groups in the current census, their proportion is much lower than in the 2002 survey of feeder groups, when 64 per cent of respondents were men. The average age of individuals in feeder groups remains unchanged from 2002.
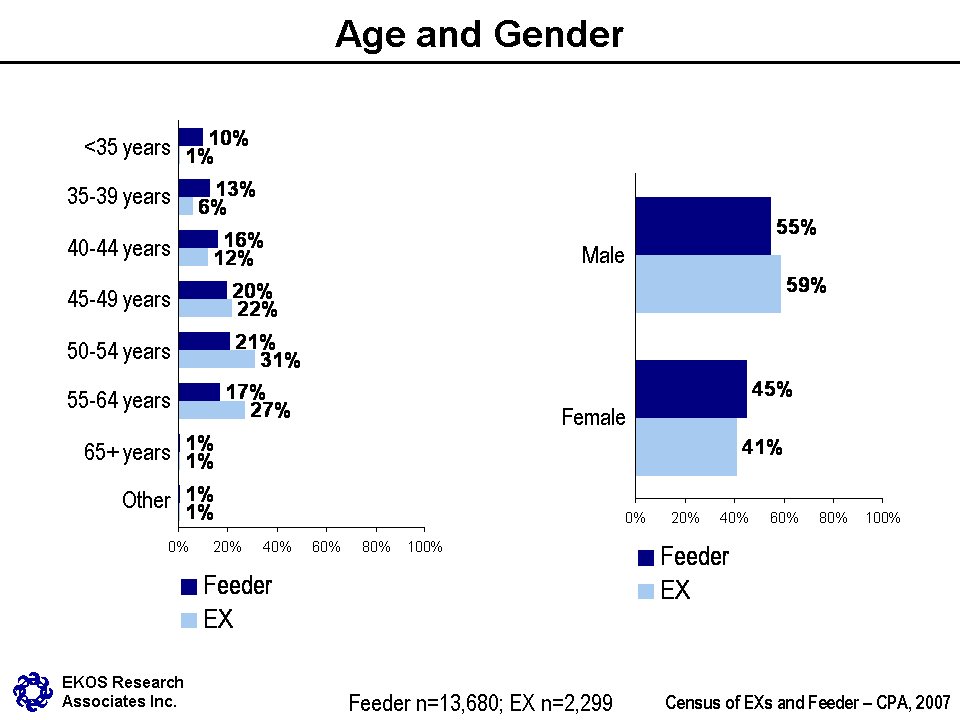
5.2 Employment equity
The sample is representative of the wider Canadian public, given that three per cent of both EXs and the feeder group are Aboriginal, and four per cent of EXs and five per cent of the feeder group report a disability. The representation from the visible minority group is somewhat lower at six per cent of EXs and nine per cent of the feeder group. The Aboriginal portion of the sample appear to be younger and concentrated in the western regions, with fewer years in the Public Service. Visible minority group members are also younger with less years of experience in Public Service. People with a disability, on the other hand, are typically older, with considerably more years in the Public Service.
These results are similar to those obtained in the 2002 survey of feeder groups, when 6.5 per cent of respondents reported being members of a visible minority, 2.4 per cent were Aboriginal, and 3.7 per cent were persons with a disability.
5.3 Region of work
The concentration of respondents was in the NCR, although to a slightly lesser extent in the feeder group (at 64 per cent, compared with 70 per cent of EXs). Feeder group and EXs located in the NCR are typically younger and newer to the Public Service than regional employees. The representation of women is also higher in the NCR. EXs located in the NCR also typically report a higher level of education. The concentration of Francophones is higher in the NCR than in the regions in the feeder group, but the proportion of Francophones in the EX sample is the same in the NCR and across the regions.
The concentration of feeder group members in the NCR is identical to that reported in the 2002 survey of feeder groups.
Table 5.1: Region of work
| Province/region | FEEDER % (n=13,680) |
EX % (n=2,299) |
|---|---|---|
| British Columbia | 5 | 3 |
| Alberta | 3 | 2 |
| Saskatchewan | 2 | 1 |
| Manitoba | 2 | 2 |
| Ontario (excluding NCR) | 7 | 5 |
| National Capital Region | 64 | 70 |
| Quebec (excluding NCR) | 6 | 4 |
| New Brunswick | 2 | 2 |
| Nova Scotia | 3 | 2 |
| Prince Edward Island | 1 | 1 |
| Newfoundland and Labrador | 1 | 1 |
| Yukon | 0 | 0 |
| Northwest Territories | 1 | 0 |
| Nunavut | 0 | 0 |
| Outside Canada | 1 | 5 |
| No answer | 1 | 2 |
The incidence of relocation to the NCR to join or take another position in the Public Service is quite high across the sample. Thirty-one per cent of the feeder sample and 39 per cent of EXs have relocated to the NCR at some point in their career. Relocation is more prevalent among senior EXs (and therefore among older EXs) in the sample. This is also the case more often among men. These age and gender patterns are also found in the feeder sample.
5.4 Education
Roughly eight in ten respondents report a bachelor's degree or higher. Education is typically higher for EXs than reported by the feeder group, with over half of EXs (52 per cent) reporting a graduate degree. Eleven per cent of feeders and five per cent of EXs have a professional designation of some type. Younger and newer public servants often report more education than their older and more experienced counterparts.
The educational attainment of feeder group members is very similar to that reported by respondents to the 2002 feeder group survey.
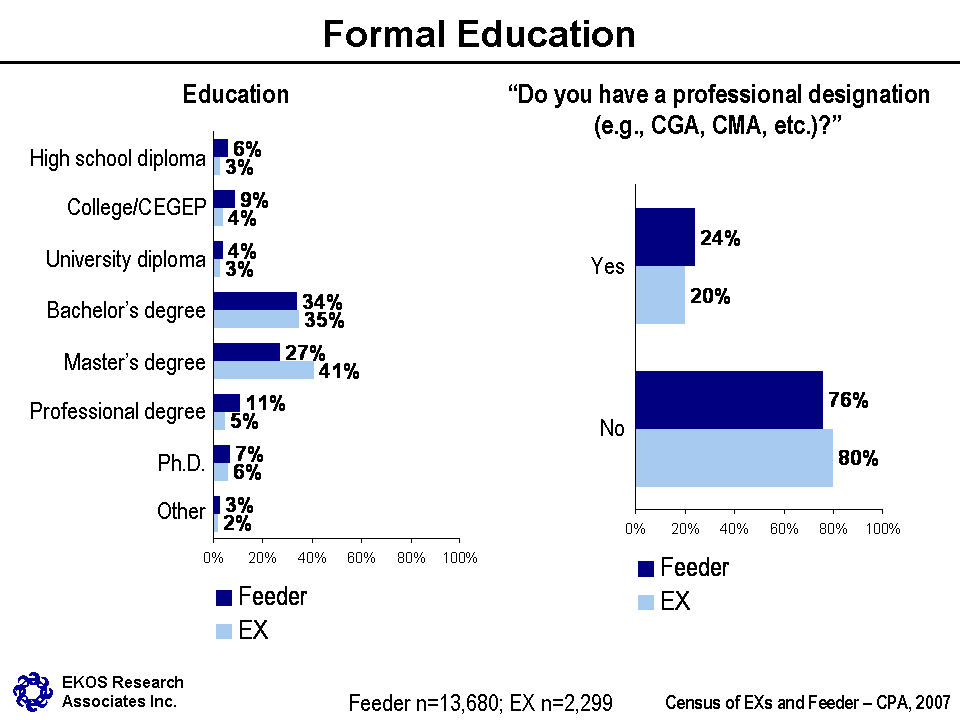
5.5 Language
Across the board, two in three respondents are Anglophones, reporting English as their mother tongue. Just over one in four (28 per cent in both the EX and feeder groups) are Francophones, and the remaining three per cent of EXs and four per cent of feeder groups report other languages as a first language. By comparison, Francophones are typically younger and newer to the Public Service.
A slightly smaller proportion of feeder group members report English as their first language in comparison to results from the 2002 survey (where 75 per cent reported English as their first language); while the number reporting French as their first language has increased only slightly (from 25 per cent); with the balance of respondents reporting a first language other than English or French.
Eighty six per cent of EXs have their CBC language proficiency. Six per cent have less than CBC and six per cent have not been tested. In the feeder group, 43 per cent have their CBC language profile. Another 25 per cent are below CBC and 27 per cent have not been tested. Those with a CBC language proficiency are typically younger (in the feeder group) and the concentration is higher among women (among both feeders and EXs). It is also more prevalent in the science and professional categories.
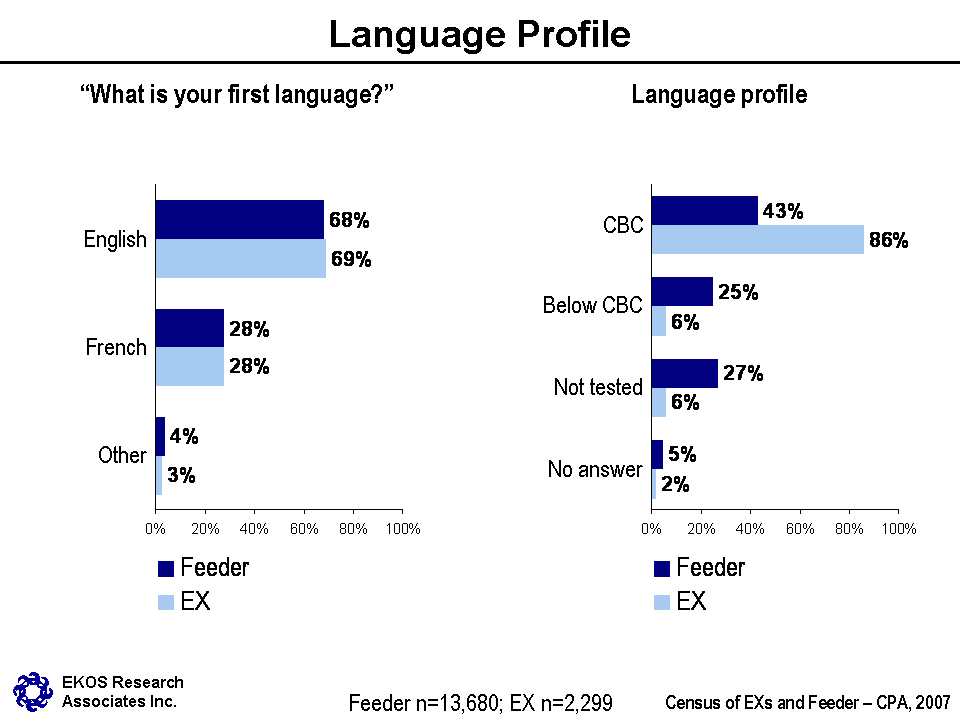
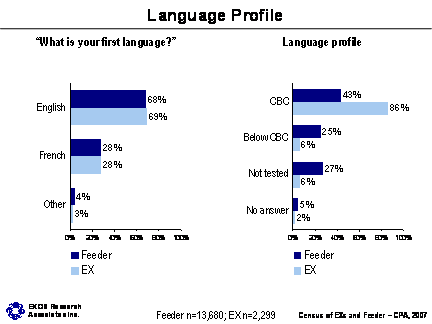
5.6 Work history
Upon entry to the Public Service (whether first term or indeterminate position, excluding student employment), over one in ten EXs were classified as either CRs (13 per cent) or ESs (12 per cent). Other classifications include AS and FS (both with six per cent) while some started in the EX classification (five per cent). Similarly, over one in ten (14 per cent) of the feeder group were initially CRs and another eight per cent were ESs when they first entered the Public Service. Fewer in the feeder group were ASs or CSs (five and six per cent, respectively) or ENENGs or LAs (also both at five per cent).
EXs have been with more departments or agencies in their careers. Among EXs only 22 per cent have been in only one department, while 24 per cent have been in two. Over half of EXs (54 per cent) have been in three or more departments. Almost half of the feeder group (42 per cent) have only been with one organization, while 26 per cent have been in two, and the remainder (32 per cent) have been in three or more. Women typically report working in more departments than men, and employees in the NCR also report working in more organizations than regional employees.
The 2002 survey of feeder groups also found that most feeder group members had limited exposure to different departments, with most having worked in only one or two throughout their career. However, the proportion reporting having worked in only one department is lower than in 2002, where 48 per cent reported experience in only one department compared to 42 per cent in the current census.
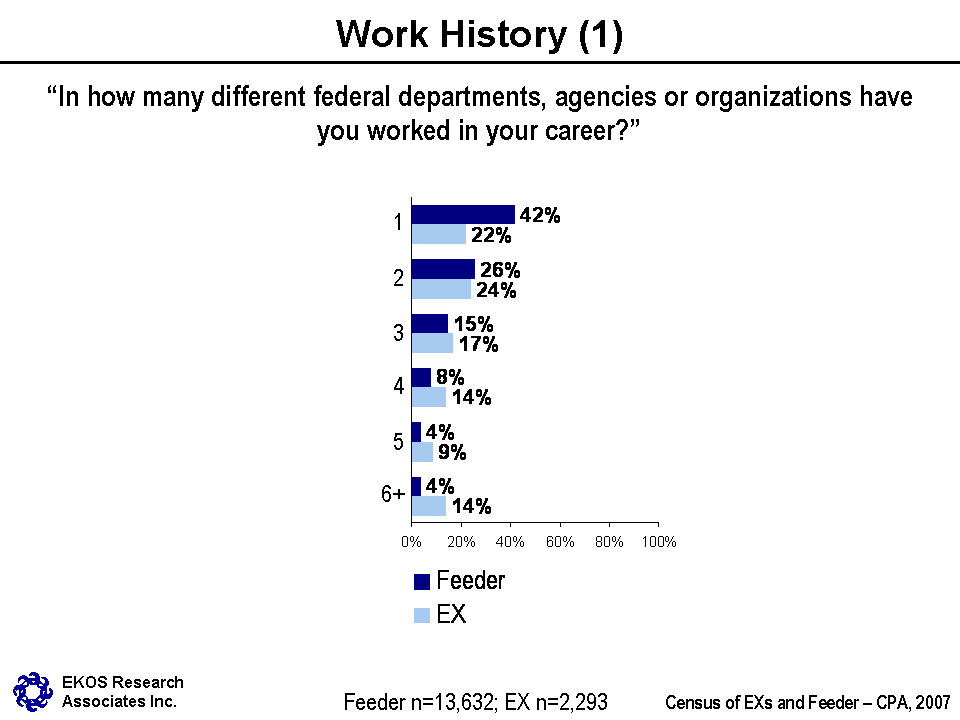
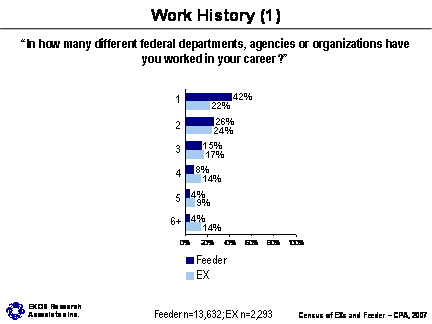
Prior to becoming an executive, nearly three quarters (73 per cent) worked in the core public administration. Relatively few worked in other federal organizations (7 per cent), for a separate agency (six per cent), or in the private sector or a non-profit organization (seven per cent) prior to becoming an executive.
Nearly one quarter (23 per cent) of EXs were classified as an ES in terms of substantive classification immediately before they became an executive. More than one in ten were either an AS (12 per cent) or a PM (11 per cent), and just under one in ten (nine per cent) were an FS prior to becoming an EX. An additional six per cent (each) were classified as CO or FI prior to advancing to an EX position.
Thirty nine per cent of EXs and 30 per cent of feeders reported been in their current substantive group and level for two years or less, while 39 per cent of EXs and 44 per cent of feeders have been in the same position between four and nine years.
A large number of EXs (40 per cent) have been in the Public Service between 20 and 29 years. Roughly one quarter (26%) have been in the Public Service between 10 and 19 years and another quarter (25%) more than 30 years. Just over a third of feeders (34 percent) have been in the Public Service for less than 10 years. Twenty-seven percent have been in the Public Service between 10 and 19 years and between 20 and 29 years respectively.
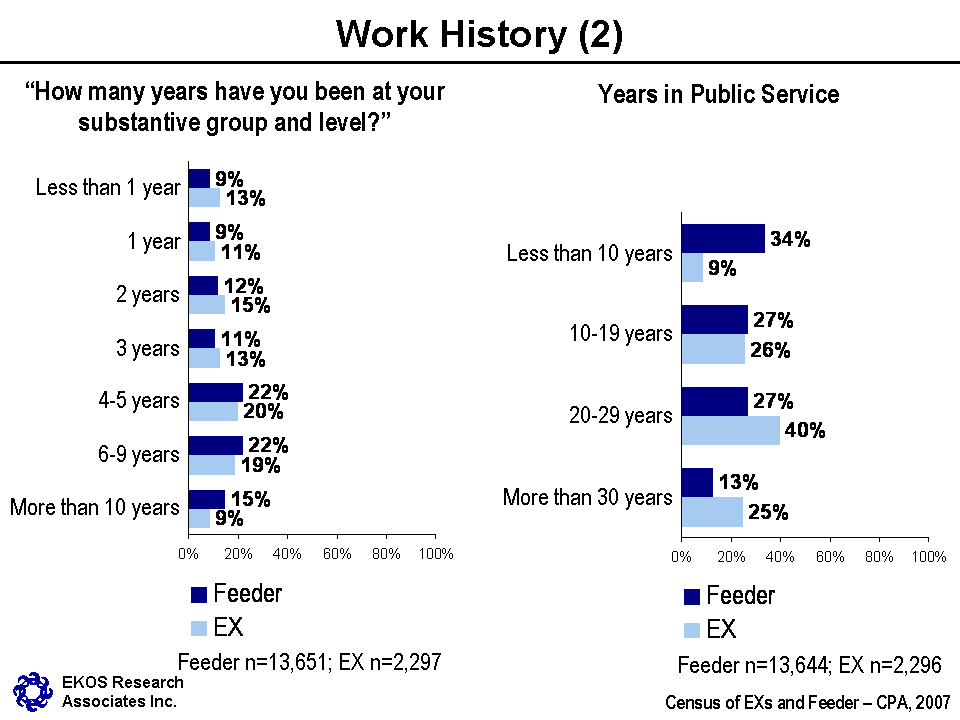
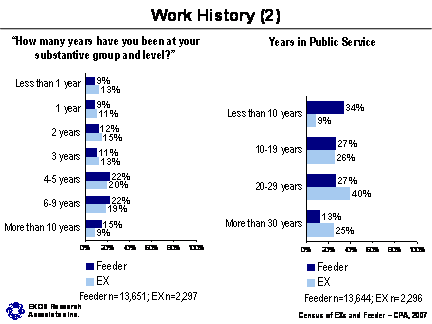
5.7 Incidence and history of acting assignments
Acting assignments are slightly more common for feeder members (16 per cent were in an acting position at the time of the census, compared with 12 per cent of EXs). Over half of sample respondents in an acting position have been acting for less than one year. Another 16 per cent of feeders and 17 per cent of EXs have been acting in a position for one year and 15 per cent of feeders and 18 per cent of EXs have been acting for two years. Thirteen per cent of feeders and nine per cent of EXs have been in an acting role for more than two years.
The proportion of feeder group members in an acting position is higher than in the 2002 survey, where only 14 per cent reported that they were acting in their current position.
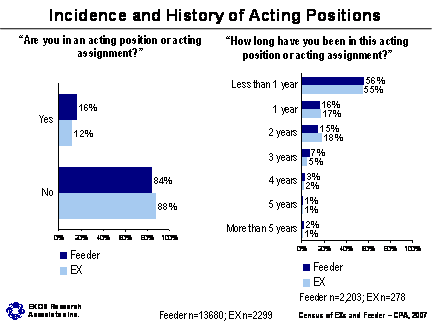
Nearly half (49 per cent) of feeder employees say they have sub-delegated authority in finance, while just over one quarter (27 per cent) of EXs do. Over one third of the feeder group (39 per cent) compared to just over one quarter (27 per cent) of EXs say they have sub-delegation authority in human resources.
Appendix A
Detailed methodology
Methodological details
Administration
The survey instrument was designed by CPSA See footnote 10. Questions were designed to be addressed to either EXs or feeders (EX equivalents, EX minus 1s and EX minus 2s) in two separate streams. The census was also designed to be self-administered over the Internet, based on an e-mail invitation to participate in the census.
Once designed, the two questionnaires were tested in both official languages with a series of stakeholders including APEX, PSC, and CSPS as well as via focus groups with EXs and feeder groups yielding various comments on the content and wording of questions. Some changes were made to the survey instruments as a result of this feedback and the changes were then translated and the instruments programmed online. CPSA was responsible for the translation of the survey instrument, as well as any advance communications, and the e-mail invitation. Other communication materials were provided to departments for their use in communicating with their employees about the census.
The sample frame was constructed by CPSA, using payroll information databases (updated as of April 1st, 2007), to include all EXs and employees currently classified in positions defined as EX equivalents or EX minus 1s and EX minus 2s. See footnote 11 Following this, work was done to obtain e-mail addresses (and telephone numbers) for all employees found in the system. The first step was to use an electronic match to the Government Electronic Directory System (GEDS). The second step was to ask departments for the contact information of any employees not found on GEDS. Duplicates found on GEDS were resolved manually. The last step was to manually look up missing cases on GEDS to see if more contact information could be recovered.
In order to test the survey instrument and sample frame, an invitation was sent to 100 randomly selected participants in the sample, on 25 May 2007. Feedback obtained in the test was used to further refine the survey instrument and programming, as well as translation.
Advance communication was sent to most employees (departments were highly encouraged to do this) to inform them of the census, its purpose and the importance of maximum participation in order to ensure representativeness of results. CPSA also provided communication material to the National Managers' Community, APEX and for a Deputy Ministers Breakfast. In total, 15,990 employees responded to the survey, for a response rate of 46 per cent. This provides for a margin of error of +/-0.6 per cent. The survey was conducted from June through July of 2007.
The survey instrument was administered using a bilingual email invitation and a bilingual questionnaire, installed on a secure website. All employees received an e-mail invitation, introducing them to the census and providing some background information, providing the Web address, as well as a unique PIN for each employee to use to access the census and input their responses to ensure confidentiality.
A total of 34,867 invitations were sent out to potential respondents over the course of the survey period. The following are salient dates and details of the attempts to collect responses:
- The first invitation was sent by EKOS to all respondents on June 13-14. 978 invitations were sent on June 13 and 31, 783 on June 14.
- On June 20-21 8,811 respondents had completed the census. Reminders were sent to 26,056 employees who had yet to complete the census.
- On June 26 11,007 respondents had completed the census. A second reminder was sent to 23,598 employees who had yet to complete the census.
- On July 9 14,183 respondents had completed the census. A third reminder was sent to 20,684 employees who had still not competed the census.
- Over the collection period roughly 2, 000 invitations were sent to employees who met the target criteria (group and level) but were missing from the original list. Invitations were sent only after verification of respondents' group and level.
Over the course of the last 2 weeks of the collection period some reminder calls were also made, although this effort was relatively minimal (i.e., fewer than 200 employees were contacted) as the response rate was already considered to be high and reminder calls did not seem to have a significant effect in terms of getting non-respondents to complete the census.
Analysis
Once collected, census results were cleaned, coded and weighted to restore the data to population representativeness. Throughout the report, results are presented for EXs and feeder groups (EX minus 1s and EX minus 2s and EX equivalents) separately. Appendix B presents classifications included in our census population. In order to present the results, separate weights were developed for the correct departmental distribution for each group. For feeders the responses were also weighted for EX minus 1s and 2s versus EX equivalents.
Considering the size of the dataset, only large and statistically significant differences were reported. For questions with many answer categories or a large number of survey items, only differences for the top five categories are presented in the report. In most cases, results are presented for valid responses; that is, responses not including the "don't know" or "not applicable" categories. Exceptions are noted in the body of the report. Detailed results were also explored in terms of sub-group patterns of results within the EX pool, as well as (separately) within the feeder group. Sub-groups included region of work, type of classification, age, gender, employment equity, language and other key dimensions.
Three separate weights were used. One weight was used when analyzing the relationship between the overall sample and the respondent type (i.e., EX versus feeders). This weight was applied for all top-line results. This corrects for all types of respondents and six of the departments where responses were significantly over or underrepresented (i.e., by more than two per cent) and included the department of National Defence, Industry Canada, Justice Canada, Statistics Canada, Public Works and Government Service Canada and Treasury Board Secretariat.
A second weight was created to analyze the relationship between EX subgroups (EX level, years in Public Service, etc.). The EX weight corrects for all EX levels (EX-01 through EX-05) and also for the same six departments.
A third weight was used when analyzing the relationship between subgroups of the feeder group. This weight corrects for EX equivalents, EX minus 1s and EX minus 2s) and the same six departments.
Appendix B
List of classification included in census population
List of classifications
EX equivalents, EX minus 1 and EX minus 2 levels
| EX equivalents | EX minus 1 | EX minus 2 |
|---|---|---|
| ac-03 | ac-02 | |
| ag-05 | ag-04 | |
| ai-nop-06, 07,08 | ainop-04, 05; aiopr-04,05 | ainop-02, 03; aiopr-03 |
| aoetp-01, 02 | aocai-05, aohps-03 | aocai-04, aohps-02 |
| ar-07 | ar-06 | ar-05 |
| as-08 | as-07 | as-06 |
| au-06 | au-05 | au-04 |
| bi-05 | bi-04 | |
| ca-02 | ca-01 | |
| ch-05 | ch-04 | |
| co-04 | co-03 | co-02 |
| cs-05 | cs-04 | cs-03 |
| de-03,04 | de-02 | |
| ds-05,06,07,08dsaaa07, dsbbb07 | ds-04 | |
| ededs-06 | ededs-05 | ededs-04, edlat-03 |
| eg-08 | eg-07 | |
| el-09 | el-08 | |
| eneng-06, ensur-06 | eneng-05, ensur-05 | eneng-04, ensur-04 |
| es-07, es-08 | es-06 | es-05 |
| fi-04 | fi-03 | |
| fo-04 | fo-03 | |
| fs-02 | ||
| gt-08 | gt-07 | |
| hr-05 | hr-04 | |
| is-06 | is-05 | |
| laaaa02, 03; labbb02, 03, laccc03; lai 02, laii 02 | la-01 | |
| ls-06 | ls-05 | |
| ma-06,07 | ma-05 | ma-04 |
| mdmof-02, 03, 04, 05; mdmsp-01, 02, 03 | mdmof-01 | |
| mt-08 | mt-07 | mt-06 |
| ndadv03, ndhme05 | ||
| nucon-01; nuhos-08; nuchn-08 | nuchn-07, nuhos07 | |
| om-06 | om-05 | |
| op-04 | op-03 | |
| pc-05 | pc-04 | pc-03 |
| pe-06 | pe-05 | |
| pg-06 | pg-05 | |
| ph-04 | ph-03 | |
| picgc-08 | ||
| pm-07 | pm-06; | pm-05 |
| pr-05 | pr-04 | |
| ps-05 | ps-04 | |
| ro-07 | ro-06 | |
| serem01, 02, 03; seres03, 04, 05 | seres-02 | |
| sgpat-07; sgpat-08; sgsre-08 | sgpat-06; sgsre-07 | |
| si-07, 08 | si-06 | |
| somao13 | soins-02; somao-12 | soins-01; somao-11 |
| swscw-05 | ||
| ti-09 | ti-08 | ti-07 |
| tr-05 | tr-04 | |
| ut-04 | ut-03 | |
| vm-05 | vm-04 | vm-03 |
| wp-07 | wp-06 | wp-05 |
Return to footnote reference 1 Feeder group is defined as including EX equivalents, EX minus 1s, and EX minus 2s.
Return to footnote reference 2 Organizations included in the Financial Administration Act, Schedule I and IV.
Return to footnote reference 3 Feeder group is defined as including EX equivalents, EX minus 1s and EX minus 2s.
Return to footnote reference 4 Organizations included in the Financial Administration Act, Schedule I and IV. A separate agency census (Schedule V) is forthcoming.
Return to footnote reference 5 This provides for a margin of error of +/-0.6 per cent. (+/- 0.6 per cent for the feeder group and +/- 1.5 per cent for EXs).
Return to footnote reference 6 A 2002 Public Service Commission of Canada report entitled "Executive Succession Reconsidered: Planning for Public Service Renewal," that reported results of a survey of 2,650 EX equivalents and EX minus 1s and EX minus 2s.
Return to footnote reference 7 The top 10 executive feeder groups (listed in order of volume of executive appointments in 2001) are PM-06, AS-07, ES-07, ES-06, CO-03, FS-02, FI-04, PE-06, IS-06 and AS-08.
Return to footnote reference 8 Technical staff also cite language requirements as a barrier more often than administrative staff does, but there are too few technical respondents in the survey to make the difference significant.
Return to footnote reference 9 Although EX equivalents were less likely than other groups to say this by a spread of 10 percentage points, the result is not statistically significant because of the relatively small number of cases in the survey declaring an intention to leave the Public Service.
Return to footnote reference 10 Leadership and Talent Management and Strategic Policy, Planning and Research sectors.
Return to footnote reference 11 The original list was created by the PSC in partnership with CPSA. The only modification made for the purpose of the census was to consider a CS-03 an EX minus 2 and CS-04 an EX minus 1. The modified list can be found in Appendix B.
- Date modified: