Common menu bar links
Breadcrumb Trail
ARCHIVED - Statistics Canada - Report
 This page has been archived.
Archived Content
Information identified as archived on the Web is for reference, research or recordkeeping purposes. It has not been altered or updated after the date of archiving. Web pages that are archived on the Web are not subject to the Government of Canada Web Standards. As per the Communications Policy of the Government of Canada, you can request alternate formats on the "Contact Us" page.
Section III: Supplementary Information
Financial Highlights
| % change | 2010-11 | 2009-10 | |
|---|---|---|---|
| Total assets | 13.7 | 235,072 | 206,706 |
| Total liabilities | 15.1 | 183,720 | 159,559 |
| Equity of Canada | 8.9 | 51,352 | 47,147 |
| Total | 13.7 | 235,072 | 206,706 |
| % change | 2010-11 | 2009-10 | |
|---|---|---|---|
| Total expenses | 12.9 | 742,513 | 657,497 |
| Total revenues | (4.3) | 97,794 | 102,193 |
| Net cost of operations | 16.1 | 644,719 | 555,304 |
Financial Highlights Charts
Figure 3 Assets by Type
Total assets were $235.1 million at the end of 2010-11, up $28.4 million, or 13.7%, from $206.7 million the previous year. Tangible capital assets, composed mainly of informatics software ($71.1 million), software under development ($45.2 million) and informatics hardware ($26.0 million), made up the largest portion of assets at $155.9 million, or 66.3% of the total. The remaining 33.7% comprised amounts from the Consolidated Revenue Fund (25.4%), accounts receivable and advances (4.3%), prepaid expenses (2.6%) and inventory (1.4%).
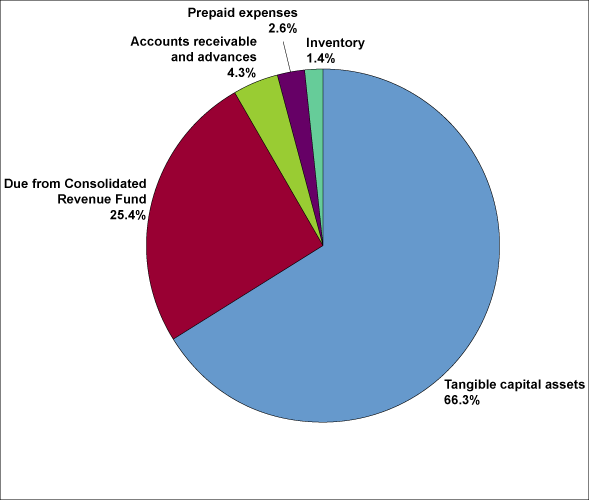
Figure 4 Liabilities by Type
Total liabilities were $183.7 million at the end of 2010-11, up $24.1 million, or 15.1%, from $159.6 million the previous year. Employee future benefits made up the largest portion of the liabilities at $90.7 million, or 49.4% of the total. Accounts payable and accrued liabilities were the next largest portion at $64.0 million or 34.8% of the total, composed of accounts payable external parties ($47.7 million), accrued salaries and wages ($8.8 million) and accounts payable to other federal government departments and agencies ($7.5 million). Vacation pay and compensatory leave make up $24.3 million, or 13.2% of the total.
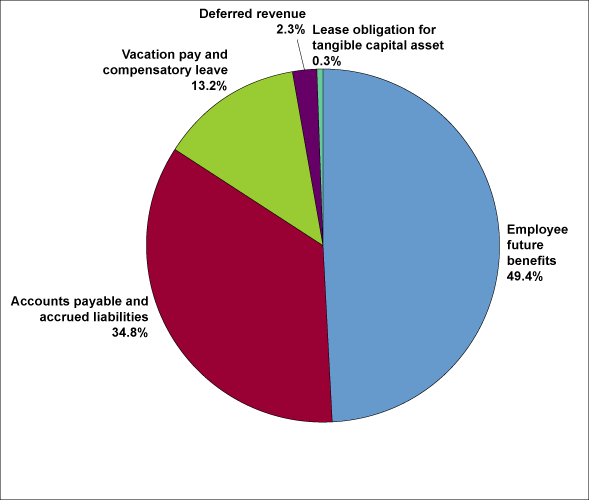
Figure 5 Revenues—Where Funds Come From
The agency's total revenues amounted to $97.8 million for 2010-11, down $4.4 million, or 4.3%, from $102.2 million the previous year; this decrease is mostly due to the cyclical nature of some surveys. The Social Statistics program generated $52.3 million (53.4%); the Economic Statistics program, $23.1 million (23.6%); the Census, Demography and Aboriginal Statistics program, $19.6 million (20.1%); and Internal Services, $2.8 million (2.9%).
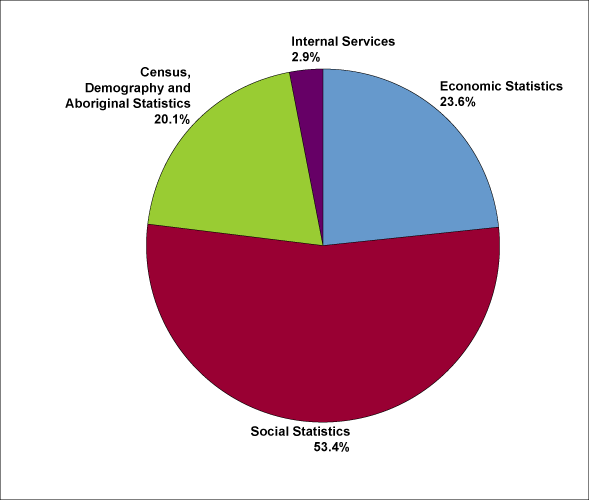
Figure 6 Expenses—Where Funds Go
Total expenses, including respendable revenue and services provided without charge by other government departments, were $742.5 million in 2010-11, up $85.0 million, or 12.9%, from $657.5 million the previous year. This increase is mostly due to the 2011 Census of Population and NHS and the 2011 Census of Agriculture; new work on initiatives such as the Canadian Environmental Sustainability Indicators, the Consumer Price Index and the Harmonized Sales Tax also accounts for some of the spending increase. This is typical for the agency because of the cyclical nature of the census programs: in 2010-11, census activities ramp up in preparation for the peak year of the cycle, 2011-12. The Economic Statistics program accounted for $227.6 million (30.7%); the Census, Demography and Aboriginal Statistics program, $207.2 million (27.9%); the Social Statistics program, $202.2 million (27.2%); and Internal Services, $105.5 million (14.2%).
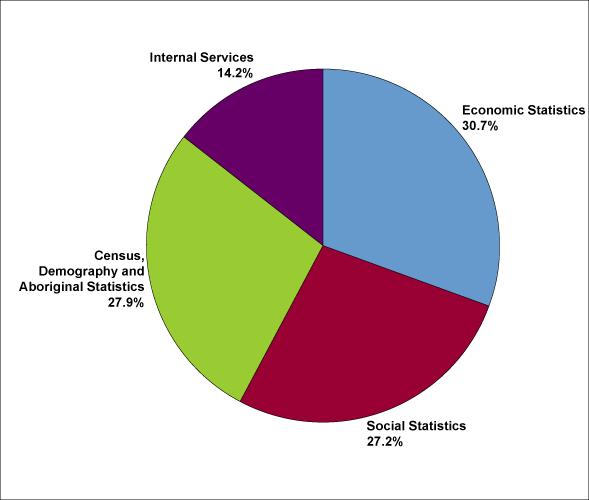
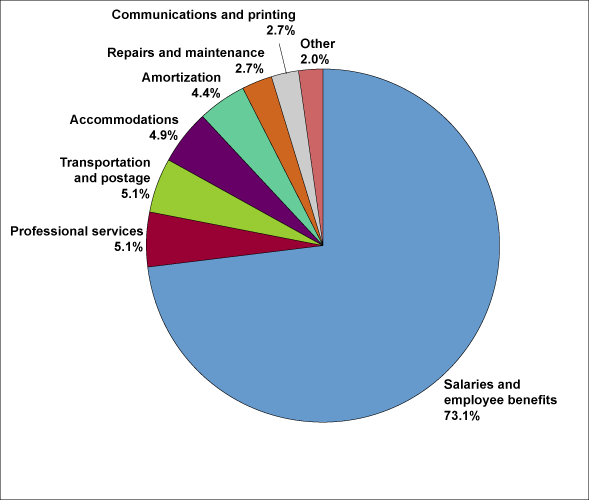
Figure 7 Expenses by Type
Statistics Canada spent $742.5 million in 2010-11. The expenses are as follows: salaries and employee benefits, $542.6 million; professional services, $37.9 million; transportation and postage, $37.5 million; accommodations, $36.7 million; amortization, $32.7 million; repairs and maintenance, $19.9 million; communication and printing, $19.7 million; and other expenses, $15.5 million.
Financial Statements
Financial statements can be found at http://www.statcan.gc.ca/dpr-rmr/2010-2011/financ-eng.htm.
List of Supplementary Information Tables
All electronic supplementary information tables found in the 2010–11 Departmental Performance Report can be found on the Treasury Board of Canada Secretariat's website:
- Sources of Respendable and Non-Respendable Revenue
- User Fees Reporting
- Green Procurement
- Response to Parliamentary Committees and External Audits
- Internal Audits and Evaluations
Section IV: Other Items of Interest
Organizational Contact Information
Email
infostats@statcan.gc.ca
Telephone
1-800-263-1136 or 613-951-8116
Fax
1-877-287-4369 or 613-951-0581
TTY
1-800-363-7629
Mail
Statistics Canada
150 Tunney's Pasture Driveway
Ottawa, Ontario
K1A 0T6
Website: http://www.statcan.gc.ca
Indicator Definitions
Number of page views of electronic publications: The number of web pages viewed during visitor sessions on the Statistics Canada website.
Success in finding information on the Statistics Canada website: Users are asked to indicate whether they successfully located the information they were seeking in their current visit to the Statistics Canada website. This feedback is collected in the Web Evaluation Survey, conducted annually by Statistics Canada. An invitation to participate in the survey appears as users view the site's pages.
Ease of finding information on the Statistics Canada website: Users are asked to rate, on a five-point scale ranging from very easy to very difficult, how easily they found the information they were seeking in their current visit to the Statistics Canada website. This feedback is collected in the Web Evaluation Survey, conducted annually by Statistics Canada. An invitation to participate in the survey appears as users view the site's pages.
Number of print publications sold: The number of print copies for which a price was charged. Statistics Canada has moved to free dissemination of electronic versions of publications to encourage broader access.
Client satisfaction: These data are derived from the client satisfaction surveys. The surveys use measures that are consistent with the common measurement tool in use across the federal government.
Data series downloaded from the online database: Data series downloaded by external users from CANSIM, Statistics Canada's online database.
Major statistical outputs released as planned: Each year Statistics Canada publishes the planned release dates for major statistical outputs for the coming year on its website. These outputs and their release dates can be accessed at http://www.statcan.gc.ca/release-diffusion/index-eng.htm.
Major statistical outputs whose sampling accuracy is within set objectives: Most surveys are based on statistical sampling. Sampling is an important means of achieving timely and cost-effective results. At the same time, estimates based on sampling can be expected to vary from sample to sample, and to differ from those that would result from a complete census. Sampling accuracy objectives are set on a survey-by-survey basis.
Percentage of major statistical outputs corrected after release: The proportion of data releases that need correction after being published.
International comparability: Comparison of periodicity and timeliness of national accounts data and unemployment data among G7 countries, based on IMF standards. Periodicity is measured as frequency of data compilation. Timeliness is the lag between the end of the reference period and the dissemination of data. International comparability also refers to average GDP revision compared with other G7 countries. Average GDP revision is measured as the average of the absolute revisions to real GDP growth rate over the period.
Use of administrative data: Statistics Canada uses data from the Canada Revenue Agency and other administrative sources as an alternative to obtaining data directly from respondents. Sometimes called 'survey data replacement', this practice reduces the number of questionnaires going to respondents and the associated response burden.
Response burden hours: This estimate is calculated annually using the frequency of each survey, the average time to complete the questionnaire and the number of surveyed respondents. Dividing by the estimated number of Canadian businesses gives average burden per establishment. The average is indexed, to a base year of 1991. The calculation excludes the quinquennial Census of Agriculture.
Net census undercoverage: The number of people missed less the number of people counted more than once. Following each census since the 1961 Census, the reverse record check (RRC) has been carried out to measure census population undercoverage. The RRC estimates the number of people missed in the census. This estimate is combined with the estimate from the census overcoverage study of the number of people enumerated more than once to calculate net undercoverage. In the Census of Agriculture, net census undercoverage—number of farms is the number of farms missed by the census less the number of farms counted more than once. As well, net census undercoverage—total farm area is the total farm area missed by the census less the total farm area counted more than once.
Response rates: The accuracy of the data disseminated by Statistics Canada is directly related to the accuracy of the data provided by respondents to its surveys or censuses. It follows that an important indication of accuracy is the percentage of respondents asked to provide data who actually do so. Generally, the higher the response rate, the greater the accuracy of census results.
Cost per dwelling: The total cost divided by the total number of dwellings.
1. A more detailed description of this program activity and planned release dates are available at http://www.statcan.gc.ca/about-apercu/structure/paa-aap-eng.htm and http://www.statcan.gc.ca/release-diffusion/index-eng.htm.
