
Common menu bar links
Breadcrumb Trail
ARCHIVED - Royal Canadian Mounted Police - Report
 This page has been archived.
Archived Content
Information identified as archived on the Web is for reference, research or recordkeeping purposes. It has not been altered or updated after the date of archiving. Web pages that are archived on the Web are not subject to the Government of Canada Web Standards. As per the Communications Policy of the Government of Canada, you can request alternate formats on the "Contact Us" page.
Section III: Supplementary Information
Financial Highlights
| % Change | 2010-11 | 2009-10 Restated |
|
|---|---|---|---|
| Total Assets | 1.5% | 15,117.4 | 14,899.7 |
| Total Liabilities | 1.4% | 14,253.2 | 14,051.6 |
| Equity of Canada | 1.9% | 864.2 | 848.1 |
| Total Liabilities and Equity | 1.5% | 15,117.4 | 14,899.7 |
| % Change | 2010-11 | 2009-10 | |
|---|---|---|---|
| Total Expenses | -1.8% | 4,976.5 | 5,070.0 |
| Total Revenues | 1.4% | 1,747.9 | 1,724.3 |
| Net Cost of Operations | -3.5% | 3,228.6 | 3,345.7 |
Condensed Statement of Financial Position
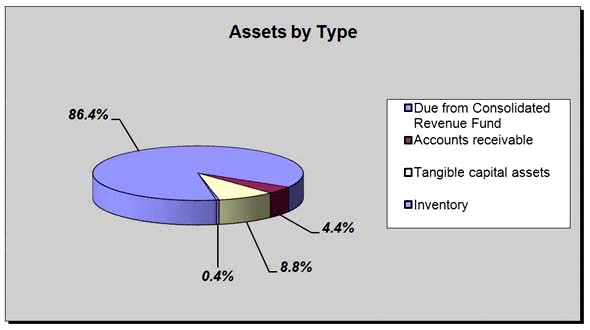
Comparative figures for Total assets and Equity of Canada have been restated for 2009-10, in accordance with new Treasury Board Accounting Standards (TBAS) requirements. Adopting the new TBAS rules required the addition of the Due from the Consolidated Revenue Fund (CRF) asset, which represents amounts that the RCMP can withdraw from the CRF to discharge liabilities without generating any additional charges against its authorities in the year of withdrawal.
The new Due from CRF asset represents $13,056.3 million (86.4%) of total assets, and accounts for $153.6 million of the overall $217.7 million (4.2%) increase in total assets. The remainder of the increase in assets can be attributed to increases in accounts receivable ($37.7 million), tangible capital assets ($23.9 million), and inventory ($2.5 million).
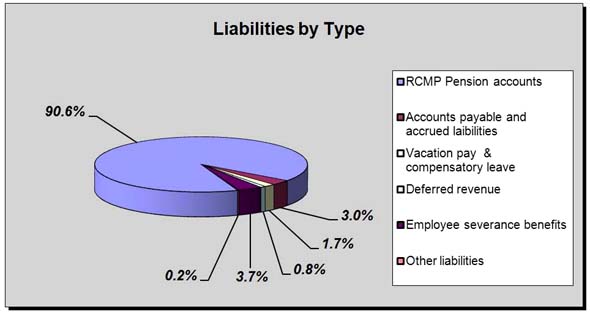
The year-over-year increase in total liabilities of $201.6 million (1.4%) is mainly attributable to the increase in RCMP Pension Accounts ($250.3 million), and a reduction in accounts payable ($76.3 million).
Condensed Statement of Operations
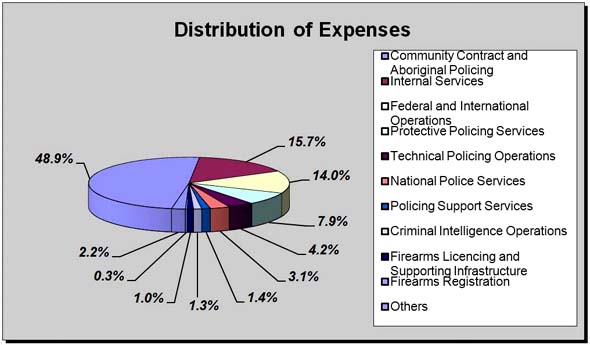
Total expenses decreased in 2010-11 by $93.5 million (1.8%). Expenses in 2009-10 were higher primarily due to the Olympic and Paralympic Games held in Vancouver in February 2010.
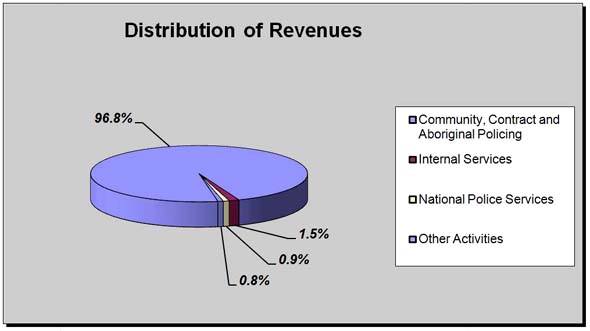
The increase in revenue of $23.6 million (1.4%) in fiscal year 2010-11 is mainly due to natural growth in the Community, Contract and Aboriginal Policing program.
Financial Highlights Charts/Graphs
The following charts illustrate the distribution of each of the items in the Statement of Financial Position and the Statement of Operations.
Assets
More than 86% of its total assets are comprised of amounts Due from Consolidated Revenue Fund, the vast majority of which represents funds available to discharge Pension and severance-related liabilities.
The balance of assets is comprised of tangible capital assets (8.8%), accounts receivable (4.4%) and inventory (0.4%).
Liabilities
The RCMP’s liabilities consist mainly of RCMP Pension Accounts (90.6%), accounts payable and accrued liabilities (3.0%), and employee severance benefits (3.7%).
Revenues
The majority of the RCMP’s revenues of $1.69 billion (96.8%) were generated from the Community, Contract and Aboriginal Policing program, which contributes to safe home and safe communities by providing police services.
This revenue represents the contracting partners’ share of these costs.
Expenses
The majority of the expenses ($2.435 billion or 48.9%) were related to the costs of the Community, Contract and Aboriginal Policing program, which contributes to safe home and safe communities by providing police services.
Approximately $780.5 million (15.7%) was related to Internal Services, which supports the needs of programs and corporate obligations of the RCMP.
Another $697.8 million (14.0%) was related to activities that contribute to Federal and International Operations while $393.6 million (7.9%) was spent on activities under Protective Policing Services. The other activities combined represent $669.5 million (13.5%) of total expenses.
Financial Statements
Financial statements are available on the RCMP’s website.
List of Supplementary Information Tables
All electronic supplementary information tables found in the 2010–11 Departmental Performance Report can be found on the Treasury Board of Canada Secretariat’s website.
- Details on Transfer Payment Programs:
- Firearms
- Injuries
- Pensions
- Green Procurement
- Horizontal Initiatives:
- 2010 Olympics Security
- Investments to Combat the Criminal Use of Firearms
- G8 and G20 Leaders Summits
- Internal Audits and Evaluations
- User Fees Reporting
- Sources of Respendable Revenue and Non-Respendable Revenue
- Status Report on Major Crown/Transformational Projects:
- Real Time Identification
- Status Report on Projects Operating with Specific Treasury Board Approval
Section IV: Other Items of Interest
Organizational Contact Information
For inquiries about the RCMP Departmental Performance Report, please contact:
RPP_DPR-RPP_RMR@rcmp-grc.gc.ca
Additional Information
All other items of interest in the 2010-11 Departmental Performance Report can be found on the RCMP’s website.
- Performance Indicators for Management Priorities
- Four-year performance trend for Strategic Outcomes and Strategic Priorities
- RCMP Corporate Risk Profile
- Annex to the Statement of Management Responsibility including Internal Control over Financial Reporting
- Performance Indicators for Forensic Science and Identification Services (in response to the Office of the Auditor General)
- Financial Statements (Unaudited) of the Royal Canadian Mounted Police for the year ended March 31, 2010
Footnotes
- 1 Performance trend information on the RCMP Strategic Priorities and Strategic Outcomes over the past four years is available in the supplementary tables on the RCMP website.
- 2 Type is defined as follows: Previously committed to – committed to in the first or second fiscal year before the subject year of the report; Ongoing – committed to at least three fiscal years before the subject year of the report; and New – newly committed to in the reporting year of the DPR.
- 3 Target represents an increase of 14% over the previous year’s results of 58%.
- 4 The survey of stakeholders was not administered in FY 2010-11. These results were obtained from a survey conducted in 2010.
- 5 The percentage of chargeable youth not charged has decreased from 67.0% in 2008-09 to 66.9% in 2009-10 and 65.9% in 2010-11.
- 6 Developed by the non-government organization Transparency International, the Corruption Perceptions Index measures the perceived level of public sector corruption in 180 countries and territories around the world.
- 7 The survey of stakeholders was not administered in FY 2010-11. These results were obtained from a survey conducted in 2010.
- 8 This measure is different from that which was reported in the RCMP’s last Report on Plans and Priorities. In fiscal year 2010-11 the RCMP redefined National Enforcement Priorities thereby making it an inaccurate measure of the effort and success achieved against serious and organized crime for this year. As a result of this change, and in order to increase consistency with reporting on national security activities, the RCMP has changed this measure.
- 9 Due to the redefinition of the performance measure, the performance target number is not applicable.
- 10 The survey of policing partners was not administered in FY 2010-11. These results were obtained from a survey conducted in 2010.
- 11 This indicator is an index of the Strategic Priorities that fall under the responsibility of RCMP Federal Policing. The target was set using the three Strategic Priorities that were in place in fiscal year 2009-10: organized crime, economic integrity and terrorism. This index indicator will remain constant, though the priorities which make up the index may change.
- 12 In a survey of Canadians, 83% agreed that the RCMP is reducing the threat and impact of organized crime, 77% agreed that the RCMP is reducing the impact of economic crime, and 87% agreed that the RCMP plays a valuable role in reducing the threat of terrorist criminal activity in Canada.
- 13 This is a new performance indicator that was adopted during 2010-11 for the Federal Policing Strategic Outcome.
- 14 For more information on the Crime Severity Index, visit their website.
- 15 Actual Spending was less than Total Authorities, primarily due to lower than projected costs for the G8/G20 Leaders Summits in June 2010 and frozen allotments not available for use during the fiscal year by the RCMP.
- 16 Due to several factors, Total Authorities were higher than Planned Spending including funding received during the year through Supplementary Estimates for First Nation Community Policing Services, funding carried forward from 2009-10 through the Operating Budget Carry Forward and funds transferred during the year from Treasury Board Secretariat Central Votes.
- 17 The survey of police partners was not administered in FY 2010-11. These results were obtained from a survey conducted in 2010.
- 18 Actual Spending exceeded Total Authorities in 2010-11, partly due to requirement to cash manage certain items not brought in through Supplementary Estimates (C) as a result of the dissolution of Parliament. This included funding related to the long-term vision and plan of major capital projects and security measures at West Block and the Library of Parliament. The balance of the difference is related to capital purchases (moveable assets/radios) where the proportion of spending can vary annually across program activities.
- 19 Note: Spending indicated here for Program Activity 3.3 Protective Policing Services is in reality dispersed between Program Activity 2.1 Community Contract and Aboriginal Policing Services and the Internal Services Program Activity (Human Resources and Public Affairs). This discrepancy has been corrected in the RCMP’s new Program Activity Architecture which was approved by the President of Treasury Board for implementation in 2011-12.
- 20 As noted in the Report of the Auditor General of Canada, which is referenced in the Performance Summary and Analysis of National Police Services, historically its programs have not been adequately funded. This is therefore reflected in the 2010-11 Expenditures versus Total Authorities.
- 21 The RCMP’s new Program Activity Architecture, approved by the Treasury Board for implementation in 2011-12, makes reference to the Canadian Firearms Program (previously referred to as the Canadian Firearms Centre).
- 22 The number of queries increased from 4,361,983 in 2009-10 to 5,345,193 in 2010-11.
- 23 Firearms safety course participants do not include totals from Qu�bec.
- 24 Commencing in the 2009-10 Estimates cycle, the resources for Program Activity: Internal Service is displayed separately from other program activities; they are no longer distributed among the remaining program activities, as was the case in previous Main Estimates. This has affected the comparability of spending and FTE information by Program Activity between fiscal years.
- 25 It is important to note that the information includes all funding sources within the Federal and International Operations Activity, which means that all Horizontal Initiatives being reported on separately by other Departments are included in this total. These initiatives include, but are not limited to: Federal Integrity; Integrated Proceeds of Crime; Public Security Portfolio; International Police Peacekeeping; and Terrorist Financing/Money Laundering.
- 26 This measure is different from that which was reported in the RCMP’s last Report on Plans and Priorities. In fiscal year 2010-11 the RCMP redefined National Enforcement Priorities thereby making it an inaccurate measure of the effort and success achieved against serious and organized crime for this year. As a result of this change, and in order to increase consistency with reporting on national security activities, the RCMP has changed this measure.
- 27 Due to the redefinition of the performance measure, the performance target number is not applicable.
- 28 The wording of the survey question was modified slightly; the original question was “percent of Canadians who agree that the RCMP plays a valuable role in reducing the threat and the impact of organized crime”, the new wording is “percent of Canadians who agree that the RCMP fulfils its strategic priority of reducing the threat and the impact of organized crime”.
- 29 The survey of policing partners was not administered in FY 2010-11. These results were obtained from a survey conducted in 2010.
- 30 The RCMP National Security Criminal Investigations uses the Disruption Attributes Tool to capture these figures. The RCMP defines a disruption in national security matters as the interruption, suspension or elimination, through law enforcement actions, of the ability of a group(s) and/or individual(s) to carry out terrorist criminal activity or other criminal activity that may pose a threat to national security, in Canada or abroad. These disruptions consist of criminal charges, for example the arrests of two Ottawa men and one London man for allegedly conspiring to facilitate terrorist activity and possessing/making explosives for a terrorist group. Another example is a case that involved an Afghan national, accused of plotting to attack CFB Petawawa with stolen materials. The majority of the disruptions (18) are reported without charges or prosecutions and consist of people whose names have been placed on the Specified Persons List because they pose threats to aviation security.
- 31 The RCMP uses the Canadian Security Intelligence Service (CSIS) definition of Political Violence and Terrorism: threats or acts of serious violence may constitute attempts at compelling the Canadian government to respond in a certain way. Acts of serious violence cause grave bodily harm or death to persons, or serious damage to or the destruction of public or private property, and are contrary to Canadian law or would be if committed in Canada. Hostage-taking, bomb threats and assassination attempts are examples of acts of serious violence that endanger the lives of Canadians.
- 32 For more on Project OSAGE, please visit their website.
- 33 The RCMP measures and tracks the effectiveness of its enforcement action against organized crime by using a Disruption Attributes Tool. The Disruption Attributes Tool allows the RCMP to accurately gauge the degree of impact on organized crime groups disrupted, taking into consideration the scope and complexity of the group’s membership and criminal activity.
- 34 For more information, please visit the Tobacco Info website.
- 35 Integrated Risk Management is an organization-wide process used to understand, manage and communicate risks.
- 36 This target represents an increase of 11% over the previous year’s result of 59%.
- 37 This target represents an increase of 8% over the previous year’s result of 62%.
- 38 The survey of policing partners was not administered in FY 2010-11. These results were obtained from a survey conducted in 2010.
- 39 The survey of stakeholders was not administered in FY 2010-11. These results were obtained from a survey conducted in 2010.
- 40 The wording of the survey question was modified slightly; the original question was “percentage of Canadians who agree that the RCMP plays a valuable role in reducing the threat and the impact of organized crime”; the new wording is “percentage of Canadians who agree that the RCMP fulfills its strategic priority of reducing the threat and the impact of organized crime”.
- 41 The survey of policing partners was not administered in FY 2010-11. These results were obtained from a survey conducted in 2010.
- 42 The survey of policing partners was not administered in FY 2010-11. These results were obtained from a survey conducted in 2010.
- 43 CISC’s results are outlined under the National Police Services Program Activity.
- 44 Actual Spending exceeded Total Authorities in 2010-11, partly due to the requirement to cash manage certain items not brought in through Supplementary Estimates (C) as a result of the dissolution of Parliament. This included funding related to the long-term vision and plan of major capital projects and security measures at West Block and the Library of Parliament. The balance of the difference is related to capital purchases (moveable assets/radios) where the proportion of spending can vary annually across program activities.
- 45 The survey of policing partners was not administered in FY 2010-11. These results were obtained from a survey conducted in 2010.
- 46 The survey of policing partners was not administered in FY 2010-11. These results were obtained from a survey conducted in 2010.
- 47 2009-10 baseline: 6,853
- 48 112 in 2009-10
- 49 As noted in the Report of the Auditor General of Canada, which is referenced in the Performance Summary and Analysis of National Police Services, historically its programs have not been adequately funded. This is therefore reflected in the 2010-11 Expenditures versus Total Authorities.
- 50 The survey of policing partners was not administered in FY 2010-11. These results were obtained from a survey conducted in 2010.
- 51 Detailed breakdown of performance indicators and statistics for the forensic laboratory system are available under “Other Items of Interest” on the RCMP’s website.
- 52 As of March 31, 2011, there were approximately 380,000 files in the criminal record backlog (the equivalent of 1.4 million pages; each criminal record may contain multiple pages).
- 53 The survey of policing partners was not administered in FY 2010-11. These results were obtained from a survey conducted in 2010.
- 54 The survey of policing partners was not administered in FY 2010-11. These results were obtained from a survey conducted in 2010.
- 55 From 4,361,983 in 2009-10 to 5,345,193 in 2010-11.
- 56 Firearms safety course participants do not include totals from Quebec.