ARCHIVED - Canada Revenue Agency - Report
 This page has been archived.
Archived Content
Information identified as archived on the Web is for reference, research or recordkeeping purposes. It has not been altered or updated after the date of archiving. Web pages that are archived on the Web are not subject to the Government of Canada Web Standards. As per the Communications Policy of the Government of Canada, you can request alternate formats on the "Contact Us" page.
2010-11
Departmental Performance Report
Canada Revenue Agency
The original version was signed by
The Honourable Gail Shea, P.C., MP
Minister of National Revenue
Table of Contents
Message from the Commissioner and Chief Executive Officer
- Our raison d’�tre
- Responsibilities
- Strategic outcome(s) and program activity architecture (PAA)
- Organizational priorities
- Risk analysis
Section II: Analysis of program activities by strategic outcome
- Taxpayer and business assistance (PA1)
- Assessment of returns and payment processing (PA2)
- Accounts receivable and returns compliance (PA3)
- Reporting compliance (PA4)
- Appeals (PA5)
- Benefit programs (PA6)
- Internal services (PA7)
- Canada’s Economic Action Plan Initiatives
Section III: Supplementary Information
Section IV: Other Items of Interest
Message from the Minister

Most Canadians give little thought to tax collection, other than at tax time each spring, yet every day the work of the Canada Revenue Agency (CRA) has a direct impact on our lives and livelihoods. Governments across Canada depend on the CRA to collect revenue needed to pay for a vast range of social and economic programs and benefits that sustain our high standard of living and quality of life.
Through its unparalleled service to Canadians, the CRA helps us understand and meet our tax responsibilities. Along with firm enforcement measures that discourage non-compliance, such as those aimed at individuals and businesses participating in the underground economy or attempting to avoid taxes through aggressive tax planning, the CRA works to ensure that everyone pays their fair share. Protecting Canada’s revenue base is particularly important in these economically challenging times, when governments must exercise fiscal restraint while continuing to meet the needs and expectations of Canadians.
The Government of Canada is committed to helping hard-working Canadians save money wherever they can. We have introduced important new tax relief measures under the next phase of our Economic Action Plan. These measures, aimed at individuals, families and businesses, include the Children's Arts Tax Credit, the Working Income Tax Benefit, the Canada Employment Credit, the First Time Home Buyers Tax Credit, and the Volunteer Firefighter Tax Credit. Thanks to these and ongoing tax relief programs, the average family of four now receives $3,000 in extra tax savings. In fact, the federal tax burden is at an all-time low in Canada, the lowest level in more than a half a century. I encourage people to visit the CRA Web site to learn more about these tax savings so they can take full advantage of them.
The CRA Departmental Performance Report 2010‑2011 highlights the many ways the organization is constantly improving, evolving and expanding its core business to secure the ongoing economic and social well-being of Canadians. Since being named Minister of National Revenue, I have had the pleasure to witness this progress for myself. The CRA consistently demonstrates that it is a world-class tax and benefit administrator that provides value to its government clients, and a fair and accessible revenue collector in whom Canadian taxpayers can confidently put their trust.
As Minister of National Revenue, I am pleased to present the Departmental Performance Report 2010‑2011 for tabling.
Message from the Commissioner and Chief Executive Officer

The Canada Revenue Agency (CRA) makes a major contribution to Canada’s economy and the social well-being of Canadians. We administer taxes for federal, provincial, territorial, and First Nations governments, and also help to advance governments’ social goals through our administration of benefit programs that increase the standard of living of many Canadians. Our reputation as a world-class tax and benefits administration is well-earned and we are proud of our accomplishments over the past year.
During 2010-2011, the CRA continued to focus on ensuring the integrity of Canada’s tax and benefits systems through initiatives designed to promote compliance with tax legislation, to strengthen services for individuals and business to make compliance easier, and to put in place ways that make non-compliance more difficult. Our work to expand outreach to selected groups of Canadians through electronic means is an important step toward improved voluntary compliance while increased opportunities for taxpayers to interact with the CRA through electronic means is a way that we are strengthening our services. To ensure that individuals were aware of, and could apply or register for, their entitlements to benefits and credits, we ensured that taxpayers had access to information they needed.
To make non-compliance more difficult, we undertook actions to counter aggressive tax planning schemes and underground economic activity. Among our most notable achievements this past year was our timely and efficient implementation of the Harmonized Sales Tax (HST) for the provinces of Ontario and British Columbia. The CRA will continue to administer the HST in BC until the transition back to GST in that province. Another noteworthy undertaking during 2010-2011 was our participation in an international tax benchmarking exercise, which saw selected CRA results compared with nine other Western tax administrations. This study revealed that the CRA has in place many of the leading practices in tax administration, and is often in the top ranking for cost effectiveness. I was particularly pleased to see that the CRA’s debt collection function achieved top results. We will carefully review opportunities revealed to further enhance our effectiveness.
As we move forward, we are cognizant of the evolving economic environment; in particular, the government’s priority to restore budgetary balance, in part by asking all federal government departments and agencies to contain costs. We have set in motion a plan to respond quickly and responsibly to this directive in order to maintain our core business while making prudent investments to sustain our operations over the longer term.
I would like to extend my sincere thanks for the dedication, knowledge, and professionalism of the staff of the CRA, qualities that will enable us to continue to deliver quality results that matter to Canadians.
Section I: Agency overview
Our raison d’�tre
Canada’s tax system is based on voluntary compliance and self-assessment. A well-functioning tax system is critical to the ability of federal, provincial, territorial, and First Nation governments to deliver programs and services that are important to Canadians and Canadian businesses.
The Canada Revenue Agency (CRA) has the mandate to administer tax, benefit, and other programs on behalf of the Government of Canada and provincial, territorial, and First Nations governments.
Parliament created the CRA so we could meet the mandate by:
- providing better service to Canadians;
- offering more efficient and more effective delivery of government programs; and
- fostering closer relationships with provinces and other levels of government for which the CRA delivers programs, and providing better accountability.
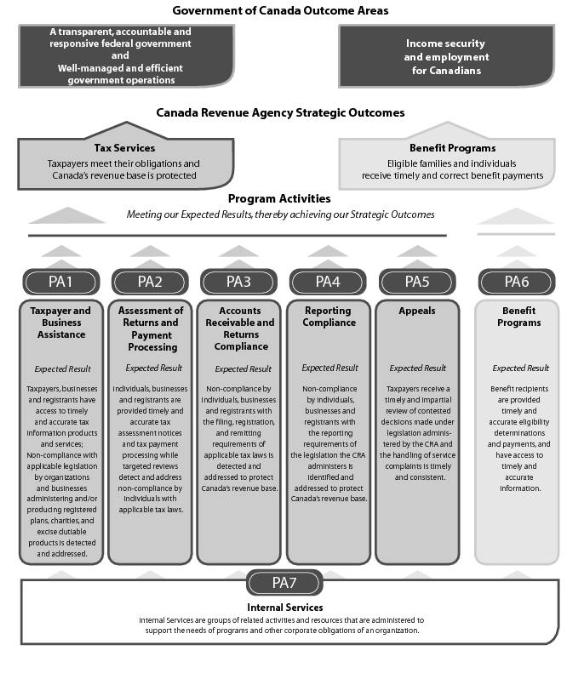
The CRA’s mandate reflects the broad role that the CRA plays in the lives of Canadians. The CRA contributes to three of the Government of Canada’s outcome areas:
- A transparent, accountable and responsive federal government;
- Well-managed and efficient government operations; and
- Income security and employment for Canadians.
Responsibilities
The CRA exercises its mandate within a framework of complex laws enacted by Parliament, as well as by provincial and territorial legislatures.
No other public organization touches the lives of more Canadians on a daily basis. Each year, we collect billions of dollars in tax revenue and deliver income-based benefits, credits, and other services that help families and children, low- and moderate-income households, and persons with disabilities. These programs contribute directly to the economic and social well-being of Canadians.
The following two strategic outcomes summarize our contribution to Canadian society.
- Taxpayers meet their obligations and Canada’s revenue base is protected; and
- Eligible families and individuals receive timely and correct benefit payments.
In July 2010, the CRA implemented the harmonized sales tax (HST) in Ontario and British Columbia Footnote 1.
The CRA also verifies taxpayer income levels in support of a wide variety of federal, provincial, and territorial programs, ranging from student loans to health care initiatives. In addition, we provide other services, such as the Refund Set-Off Program, through which we aid other federal agencies and departments, as well as provincial and territorial governments, in the collection of debts that might otherwise become uncollectible.
Strategic outcome(s) and program activity architecture (PAA)
Organizational priorities
The CRA is responsible for administering, assessing, and collecting billions of dollars in taxes annually. We deliver tax services and benefit programs that support the economic and social well-being of Canadians, including families and children, low- and moderate income households, and persons with disabilities.
The CRA’s mandate sets out two strategic outcomes that summarize its contribution to Canadian society. The achievement of these outcomes demonstrates that we are fulfilling our mandate from Parliament.
We are continually evolving our strategic direction and refining our vision to meet challenges within our changing environment. We have increased our emphasis on mitigating risk factors which may impact our capacity to deliver services to Canadians.
We have introduced five overarching strategic elements to guide our work over the planning period. Our tax and benefit operational and management focus will be on building trust to promote compliance, strengthening service to make compliance easier, making non-compliance more difficult, making it easier to receive the right social benefits, and maintaining business sustainability.
The tables below links our priorities to the achievement of our strategic outcomes.
|
Type
Table note 1 |
||
|---|---|---|
|
We continually seek to build on the trust and confidence of our stakeholders in the CRA. Our objective is to make sure that Canadians have access to the information they need to voluntarily comply with Canada’s tax laws as well as impartial and timely review of contested decisions. We work to build and
maintain the trust and confidence of Canadians and our stakeholders through a range of activities and by treating their personal information confidentially. Our tax system works best when individuals and businesses believe that the CRA can be trusted to be fair, efficient, and impartial.
|
||
|
Type Table note 1
|
||
|---|---|---|
|
Type
Table note 1 |
||
|---|---|---|
|
Although instances of non-compliance are not frequent, they have a significant fiscal impact and erode the integrity of the tax and benefit system. We must continue to apply innovative strategies to remove the remaining opportunities for non-compliance.
Non-compliance is the failure, for whatever reason, to register as required under the law, file returns on time, report complete and accurate information to determine tax liability, and pay all amounts when due. It takes many forms, from errors and omissions to deliberate tax evasion. We are constantly assessing non-compliance risks and taking steps to focus
our resources on areas of highest risk in order to make non-compliance more difficult. Ensuring compliance with Canada’s tax and benefit legislation is essential to protecting Canada’s tax revenue.
|
||
|
||
|
Type
Table note 1 |
||
|---|---|---|
|
The CRA supports the efforts of federal, provincial, and territorial governments by administering benefits to families, low- and moderate-income households, and persons with disabilities. Our objective in administering benefits is to make sure that Canadians have access to the benefits and credits to which they
are entitled, and that related payments are timely and correct.
|
||
|
Type Table note 1
|
||
|---|---|---|
|
We must ensure that we have in place the modern and innovative management practices and sound infrastructure necessary to maintain the sustainability of the high-quality tax, benefit, and related services we deliver on behalf of governments across Canada.
We invest resources each year to make sure that we can comply with the accountability requirements of financial and administrative legislation, regulations, and government policies and directives, and to sustain and advance our core information technology (IT) functions, which are critical to the delivery of
all our programs. In addition, we use effective human resources practices that keep us competitive in the labour market.
|
||
|
||
- Table note 1
- Type is defined as follows: Previously committed to—committed to in the first or second fiscal year before the subject year of the report; Ongoing—committed to at least three fiscal years before the subject year of the report; and New—newly committed to in the reporting year of the DPR.
Risk analysis
The Enterprise Risk Management program is designed to effectively manage risks through a systematic and comprehensive approach that is methodically integrated into CRA’s decision-making, planning, and reporting processes.
An update to Our Corporate Risk Inventory 2009 was completed in 2010. The 2010 edition of the Inventory was developed by conducting interviews that provided a broad perspective on shifts in the internal and external environments that drove changes to the risks presented in the 2009 Inventory. The conclusion drawn from these interviews was that no significant changes to the enterprise risks have been identified that warrant additional action. Consequently, we are continuing to implement strategies for already identified risks requiring mitigation.
During 2010-2011, we consulted with national and international organizations from the public and private sectors as well as communities of expertise on leading practices. Based on our research findings, we adopted an improved enterprise risk management cycle. This multi-year approach will eliminate cycle overlap and process fatigue, provide a more horizontal outlook, and reduce inefficiencies while increasing the availability of more timely and relevant risk information.
Through an updated methodology and approach, we began the development of our Corporate Risk Profile 2011. We are using environmental scans, risk interviews and risk analysis to support risk responses and action plans. We have increased the level of risk management training throughout the organization, while improving the efficiency and content of our training programs. Additional work continues to develop a more agile and robust enterprise risk management regime.
Summary of performance
2010-2011 Financial resources (thousands of dollars)
|
Taxpayer and business assistance (PA1) Table note 2
|
||||||
|
Assessment of returns and payment processing (PA2) Table note 3
|
||||||
|
Benefit programs (PA6) Table note 4
|
||||||
|
Internal services (PA7) Table note 5
|
||||||
|
|
||||||
|
|
||||||
- Table note 2
- Includes the Softwood Lumber statutory disbursements ($205.5 million in 2009-2010 and $220.7 million in 2010-2011). Return to Table note 2 source text
- Table note 3
- Includes payments to the Minist�re du Revenu du Qu�bec for the administration of the Goods and Services Tax in that province ($148.4 million in 2009-2010 and $142.2 million in 2010-2011). Return to Table note 3 source text
- Table note 4
- Includes a) Relief for Heating Expenses (program announced in 2000) ($500.0 thousand in 2009-2010 and $4.0 thousand in 2010-2011); b) Energy Costs Assistance Measures expenses (program announced in the Fall of 2005) ($21.2 thousand in 2009-2010 and $4.7 thousand in 2010-2011); and c) Statutory Children’s Special Allowance payments ($215.3 million in 2009-2010 and $222.4 million in 2010-2011). Return to Table note 4 source text
- Table note 5
- For planning purposes, the budget for real property accommodations is shown in Internal Services, however, at year-end the actuals are attributed to all other program activities. Return to Footnote 5 source text
Expenditure profile
Canada’s Economic Action Plan
In 2010-2011, the CRA was provided with $9.6 million in action plan funding to administer the Home Renovation Tax Credit and First-Time Home Buyers Tax Credit. Additional monies were also provided for late filing and incorrect format penalties and for the simplification of GST/HST for the direct selling industry. These supplementary funds enabled the CRA to augment its capacity to deal satisfactorily with the increased information requirements presented by these initiatives.
Figure 1 Spending Trends
For the period 2006-2007 to 2010-2011, total spending amounts include all Parliamentary appropriations and revenue sources: Main Estimates, Supplementary Estimates, funding associated with the increased personnel costs of collective agreements, maternity allowances and severance payments, as well as funding to implement Federal Budget initiatives and the Agency’s carryforward adjustments from the prior year. It also includes spending of revenues received through the conduct of CRA’s operations pursuant to Section 60 of the Canada Revenue Agency Act, Children’s Special Allowance payments, payments to private collection agencies pursuant to Section 17.1 of the Financial Administration Act and disbursements to the provinces under the Softwood Lumber Products Export Charge Act, 2006.
Since 2006-2007 the Canada Revenue Agency’s reference levels have changed primarily as a result of: collective agreements/contract awards; policy and operational initiatives arising from various Federal Budgets and Economic Statements; transfers from the Department of Public Works and Government Services Canada for accommodations and real property services; the Softwood Lumber Agreement; and the commencement of responsibilities related to the administration of corporate tax in Ontario and the harmonization of sales tax in Ontario and British Columbia. Over the same period, there have also been a number of decreases as a result of various government-wide budget reduction exercises.
Expenditures pursuant to the Agency’s Statutory Authorities have fluctuated over the course of the 2006-2007 to 2010-2011 period as a result of: adjustments to the Children’s Special Allowance payments for eligible children in the care of specialized institutions; adjustments to the rates for the contributions to employee benefit plans; increases to the spending of revenues received through the conduct of operations pursuant to Section 60 of the Canada Revenue Agency Act; the introduction from 2007-2008 to 2009-2010 of payments to private collection agencies pursuant to Section 17.1 of the Financial Administration Act; and finally, the introduction in 2006, and annual adjustments to, disbursements to the provinces under the Softwood Lumber Products Export Charge Act, 2006.
In 2010-2011, of the $4,596.7 million total authority, CRA’s actual spending totalled $4,418.5 million resulting in $178.2 million remaining unexpended at year-end. After deducting unused resources to be returned to the Treasury Board related to advertising campaigns, the remaining $178.0 million is available for use by the Agency in 2011-2012. This amount represents 3.9% of the total authority.
Authorities approved After Main Estimates
The following table details the additional authorities approved for the Agency after the tabling in Parliament of Main Estimates and reconciles with the Total Authorities shown here.
- Table note 6
- Numbers may not add due to rounding. Return to Table note 6 source text
Estimates by vote
For information on our organizational votes and/or statutory expenditures, please see the 2010-11 Public Accounts of Canada (Volume II) publication. An electronic version of the Public Accounts is available at
http://www.tpsgc-pwgsc.gc.ca/recgen/txt/72-eng.html.
Section II: Analysis of program activities by strategic outcome
Taxpayer and business assistance (PA1)
Strategic outcome
Taxpayers meet their obligations and Canada’s revenue base is protected.
Program activity description
Assisting taxpayers and businesses in meeting their obligations under the self‑assessment system through the provision of accurate and timely responses to their enquiries; information products through various media such as, Website, pamphlets and brochures; targeted outreach activities and services; income and commodity tax rulings and interpretations; Canada Pension Plan and Employment Insurance Act eligibility determinations; services relating to the registration of pension and other deferred income plans; and services relating to the registration of charities.
Performance summary and analysis of program activity
Building trust to promote compliance
Strengthen outreach
Our outreach programs and communications activities promote compliance by providing information and tools to reach our diverse audiences through a variety of formats and venues. During 2010-2011, our continued use of technology allowed us to connect with wider audiences efficiently and cost effectively, including those who live in remote locations. For example, we provided 6 distinct outreach groups with 48 video conferencing sessions. We delivered outreach sessions to a total of 28 distinct target groups such as small and medium enterprises, individual taxpayers, youth, newcomers to Canada, seniors, volunteers, people with disabilities, and Aboriginal communities.
In 2010-2011, work continued on furthering our outreach strategy. We developed an inventory of existing outreach products, gap analysis and recommendations. Based on these recommendations, work will continue to strengthen outreach. We also developed integrated outreach plans for taxpayer segments and responsible citizenship messaging.
A prime focus during 2010-2011 was the advent of the harmonized tax regimes in Ontario and British Columbia, which required targeted communications strategies and products to create awareness. A proactive multi-media approach was used to educate businesses. Interactive on-line seminars (webinars) were conducted. In addition, a series of short videos were produced and made available on the CRA Web site which provided information on various HST topics. Our communication and outreach activities are most often used to inform and assist individuals and businesses with ongoing programs and issues.
Optimize service delivery channels
Individuals and businesses often require information and services specific to their situations. Providing information alone is not sufficient to support the needs of Canadians. We strive to ensure that taxpayers can rely on our agent-assisted services including specialized 1-800 telephone numbers, technological interactive services such as Smartlinks, and in-person appointments to meet their information needs. Comprehensive automated telephone response systems provide service 24 hours a day, seven days a week. During regular business hours, we route calls among call centres as demand increases or decreases. This makes the most effective use of our resources, reduces costs, and provides extended hours of service for Canadians.
In 2010-2011, we met our caller accessibility targets of 90% for general and business enquires, despite a more than 7% increase in call demand on the business lines. This increase was largely due to enquiries related to the implementation of the Harmonized Sales Tax in Ontario and British Columbia as well as changes in mandatory electronic filing for GST/HST registrants. We also exceeded the 90% caller accessibility target for answering tier 1 charities enquiries.
We also work hard to ensure that the information we provide to taxpayers through our enquiries services is accurate. We make sure that agents have access to up-to-date training and online reference materials, including a newly developed service excellence training product, and use quality assurance techniques that provide ongoing, prompt feedback to our individual and business enquiries agents. This helps our agents to provide technically accurate responses to taxpayers’ questions.
We provide an array of user-friendly electronic services that help individuals and businesses to pay their taxes. Over the past year we made improvements to My Account based on our analysis of client needs. While electronic services can generate efficiencies for the CRA, they may also create a need to provide support and assistance to those who wish to take advantage of them. For instance, calls to the e-Services Helpdesk increased almost 15% over the previous year. Many of the calls were enquiries about the introduction of mandatory electronic filing for GST/HST registrants that came into effect on July 1, 2010. The introduction of the Credential Management System, which replaced the Government of Canada epass process for CRA services also contributed to the increase.
Enhance the Charities program
In 2010-2011, we continued to provide timely telephone and written responses to the charitable sector through our registration application processes, our call centers, and our written enquiries process. We offered 75 Charities Information Sessions to registered charities across Canada, with 96% of participants indicating they were satisfied or very satisfied with the sessions. We also delivered 17 webinars (a limited interactive environment in which dialogue can occur between participants and CRA representatives) to 2,164 individuals. When surveyed, 91% of participants indicated that they were satisfied or very satisfied.
We also enhanced the functionality of the Charities and Giving Web site by updating search tips, download instructions, links to definitions, and providing the latest available web and e-mail addresses of registered charities. There were over 1,700,000 visits to the Charities and Giving Web site, an increase of 14% over 2009-2010.
Making non-compliance more difficult
Implement an enhanced tobacco stamping regime
In 2010, Parliament passed legislative changes to implement a new tobacco stamping regime in Canada. The CRA responded immediately by developing the necessary framework of policies and procedures to manage the new tobacco stamping program. To ensure successful implementation, the CRA consulted regularly with stakeholders, including industry members. A detailed communication strategy was also developed that included industry outreach.
All implementation deadlines were met. We consider the successful execution of this initiative to be a very significant achievement.
Improve the detection and deterrence of non-compliance in our Charities program
Registered charities in Canada are tax-exempt and can issue charitable donation receipts to donors. To maintain these privileges, registered charities must operate within the parameters of the Income Tax Act. In cases of serious non-compliance, contraventions can result in the revocation of the registered charitable status of the organizations involved. The overall level of compliance by registered charities with the requirements of the Income Tax Act is determined based on an analysis of the results of random audits conducted annually. For the past three years, audit results show that the overall level of compliance has been stable and confirm that the vast majority of registered charities are complying with legal requirements. While some charities required education on mostly minor compliance issues, very few serious issues of non-compliance were noted. For the third consecutive year, less than 4% of random audits resulted in a revocation action against a charity. In 2009 (last year of complete data), 99% of registered charities filed an annual information return. 61% of registered charities filed within the required six months of fiscal year end, with the remaining 38% having been filed late. Based on returns filed to date, we anticipate a similar filing rate for 2010.
Continue implementing a risk-based approach to registered plans
In 2010-2011, we delivered outreach sessions on registered plans in Toronto, Montreal and Vancouver. We also published several bulletins and a guide to assist our clients in the administration of deferred income plans.
We continued our work on our registered plans compliance strategy. Once implemented, this strategy will enhance the risk-based approach to registered plans by providing accurate data for risk assessment. The strategy itself is currently in development. In the meantime, we continued to use a risk-based approach in registering pension plans, resulting in the inventory dropping below 10,000, representing an improvement on recent years.
Enhance the Tax-Free Savings Account program
The response to the TFSA has been overwhelmingly positive. At the end of 2009, there were approximately 4.8 million TFSA holders. That number rose to 6.7 million by the end of 2010. Given the program’s popularity, we anticipate continued and considerable growth in the number of holders in future years. To accommodate the increase, and to ensure timely updating of TFSA records, we are exploring ways to streamline our processing routines.
As part of the administration of the program, the CRA reviews information received from financial institutions and TFSA issuers to identify individuals who may have over-contributed. The results of these reviews showed that a small minority of Canadians, around 1.5% of all TFSA holders, did not fully understand the rules. We responded to this by:
- conducting public opinion research;
- improving the information on the CRA Web site; and,
- conducting Outreach with the financial industry.
In the second year of the program we saw a slight decrease, to 1.4%, in the proportion of TFSA holders who made excess TFSA contributions.
We continue to work to increase awareness of TFSA guidelines among Canadians and financial institutions. We will do so by continuing to update TFSA web pages, issue relevant Tax Tips, write community newspaper articles, and deliver webinars to financial institutions.
Lessons learned
What worked well: We improved the quality of our services to taxpayers by making them more timely, accessible, and easier to use. We maintained our high caller accessibility levels on all of our enquiries lines. Following the passage of legislation in the Parliament, we successfully implemented an enhanced tobacco stamping regime to aid in the detection of counterfeit products. We enhanced the functionality of the Charities and Giving Web site.
What could be improved: We must further pursue opportunities to enhance our service offerings to meet the evolving information needs to taxpayers, make sure that individuals and businesses are better able to navigate and understand an often-complex tax system, and be responsive and adaptive to emerging business practices and economic developments.
Performance report card
|
87% Table note 7
|
46.5% Table note 8
|
||||||
|
Percentage of general callers who reach our telephone service Table note 9
|
|||||||
|
Percentage of business callers who reach our telephone service Table note 9
|
|||||||
- Table note 7
- This became a service standard in 2006-2007. Prior year results reflect performance against an internal target. Return to Table note 7 source text
- Table note 8
- For more information on this result, please visit: http://www.cra-arc.gc.ca/gncy/nnnl/menu-eng.html Return to Table note 8 source text
- Table note 9
- The caller accessibility targets for general and business callers were raised from 80% in 2008-2009. Return to Table note 9 source text
Assessment of returns and payment processing (PA2)
Strategic outcome
Taxpayers meet their obligations and Canada’s revenue base is protected.
Program activity description
Processing and validating taxpayer returns for both individuals and businesses through initial assessment, validation, accounting, and adjustments; registering businesses for the Business Number, establishing, and maintaining accounts; and receiving payments.
Performance summary and analysis of program activity
Strengthening service to make compliance easier
Enhance our electronic services
We added features to My Business Account this past year to encourage businesses to perform certain transactions. One of the key new features has made it easier to transfer payments within a program account and between program accounts of the same nine digit business number, to make adjustments to GST/HST returns, and to make online requests for certain financial transactions. We also added an instalment payment calculator to our Web site in 2010‑2011 to make it easier for businesses to calculate their instalments for corporation and GST/HST accounts. Enhancements have been made to our Payroll Deductions Online Calculator, as well, to calculate payroll deductions more easily. The improvements include enhancements to screen displays, organization of tools, and information access. For GST/HST NETFILE, features were added so that registrants can now also file their Public Service Bodies’ Rebate at the same time as they electronically file their GST/HST Return.
A new option added to our Web site in 2010-2011 helps employers ensure that enough Canada Pension Plan contributions and Employment Insurance premiums have been withheld for full year employees. The growing number of log-ins to this Web page provides evidence that businesses see the benefits of using this online service.
We witnessed a 2.5% increase in self-service transactions by individual and business taxpayers, benefit recipients and/or their representatives from a year ago. This places us firmly on track to attain our objective of a 5% increase by 2012. The public appetite for online services has been increasing with electronic filing rates for individuals and businesses continuing to trend upwards. Our Quick Access online option continues to be a popular choice for taxpayers, as it provides information on their taxes and benefits, such as tax return status, RRSP deduction limit, TFSA contribution room, and the status of benefit payments. We have added even more services for TFSA administrators, their agents, or representatives, by including TFSA payment and a related search facility. We also increased the capacity for taxpayers requiring assistance to connect directly with enquiries agents from the My Business Account profile through the addition of Smartlinks.
In 2010-2011, we introduced important new measures to increase security. As one example, we implemented our own credential management service. These measures have lowered the overall cost, allowing the CRA to offer a broader suite of secure electronic services.
Promote the take-up of electronic filing and electronic payments
The timely and accurate processing of returns is another way to encourage voluntary compliance. We met our external service standards this past year for processing T1 individual returns in both paper and electronic formats, confirming that we provided timely service to Canadians. In addition, we met our internal processing target by processing 100% of the individual returns that were filed on time by mid-June 2010.
Despite the recent introduction of HST in Ontario and British Columbia, which significantly impacted the complexity of the GST/HST return and review process, we were able to process 90.3% of GST/HST returns within 30 days. Although we did not meet our 95% target, we are working to introduce additional efficiencies that will accelerate our processing times.
Our My Payment service lets individuals and businesses make payments electronically through a secure link with participating Canadian financial institutions that offer the Interac� Online payment service. We promoted the use of My Payment during 2010-2011 through outreach and promotional activities including news releases and other CRA announcements, mail-outs and conferences.
Our T1 Quality Evaluation Program reviews initial assessments of individual tax and benefit returns. It is our primary tool to determine the accuracy of individual returns assessed. Our results for 2010-2011 show that processing errors with an impact on a taxpayer’s refund or balance due was 1.17%. This compares with 0.96% the previous year. From 2000 through 2010, the amounts per error averaged $252.06.
Effectively manage business partnerships
We expanded the use of the Business Number (BN) this past year as a common client identifier for businesses to securely and efficiently interact with various levels of government. In December, 2010, the CRA and the Province of Saskatchewan signed a letter of intent to adopt the BN for their Corporate Registry in April, 2012. The wider use of the BN will reduce the administrative burden for both businesses and the CRA.
In July 2010, the CRA implemented the harmonized sales tax (HST) in Ontario and British Columbia Footnote 2. Harmonization involved a significant number of system enhancements and changes to CRA programs and activities.
A multi-media campaign to educate businesses and create public awareness was rolled out. It included interactive online seminars, short video presentations, in-person information sessions, and the distribution of over 1.1 million HST information sheets. Videos providing information on topics such as HST transitional rules, electronic filing, housing rebates, and forms for both businesses and consumers were posted on the CRA Web site and YouTube. Filing information was provided in several formats including inserts sent with GST/HST returns and webcasts on filing electronically using GST/HST NETFILE and how to identify the changes to GST/HST Rebates.
Making non-compliance more difficult
Optimize program efficiency and the accurate assessment of tax owed
The CRA strives to be fair in all aspects of its activities as this is crucial to sustaining taxpayers’ trust. When we find errors on tax returns, we correct them, if possible. While some errors result in additional tax owing, others mean taxpayers pay more tax than required. As part of our processing review, we compare an individual’s return to third-party information to identify areas where the taxpayer may have under-claimed credits. We adjust these returns to allow amounts the taxpayer is entitled to and, if applicable, issue a refund. In 2010-2011, we identified and corrected over 341,000 individual returns, resulting in an average beneficial adjustment of $284 per return.
Enhance our ability to detect and address non-compliance
Individuals
In 2010-2011, we estimated that 17.6% of claims or deductions made by individuals on key tax credits and deductions not subject to third-party reporting were non-compliant, meaning they were disallowed following a review. The increase may be attributed, among other factors, to the change in deductions and credits that were reviewed in each program year.
One of our pre-assessment review programs is the Confidence Validity Program. Through this program, various deductions and credits on returns are reviewed and corrected before a notice of assessment is issued. During 2010‑2011, we identified an average of $472 of additional tax assessed per review, for a total of almost $162 million in additional taxes assessed. This represents a decrease of 5% over the previous year.
Our Processing Review Program selects files for review after the assessment notice (and any refunds) have been issued. The program promotes compliance and help to maintain confidence in the fairness of our programs through increased education, effective risk-scoring systems, and a balanced approach to our file selection process. In 2010‑2011, this program identified and assessed almost $232 million in additional taxes, an increase of 15% over the previous year.
Our T1 Matching Program compares information on an individual’s tax return with information provided by third‑party sources, such as employers or financial institutions. In 2010-2011, this program identified and addressed additional tax assessments of almost $600 million.
The objective of the three programs is not simply to assess dollar values but also to educate taxpayers by identifying common areas of misunderstanding. We also gauge the effectiveness of our targeted reviews, through looking at the value of additional tax dollars assessed by targeted reviews compared with random reviews. Over the 2007-2008 to 2010-2011 period, for the Processing Review Program, our targeted reviews were approximately three times as effective as random reviews. Because the volume of each deduction and credit examined change according to our annual review strategies, in addition to new claims being added or dropped, the average dollars recovered, and the ratio of targeted to random, vary each year.
In 2009-2010, we launched our Corporate Assessing Review Program (CARP). The main objective of the program is to validate the accuracy of our assessments by ensuring that corporations file accurate and complete information on their T2 Tax Returns and that reported amounts are consistent with applicable tax legislation. In 2010-2011, CARP reviewed more than 48,000 corporation returns generating assessments totalling more than $45 million dollars in additional federal and provincial tax. During this past year, we embarked on a number of reviews to ensure that tax reserves, pool balances, and tax credits were accurately represented based on businesses’ past and present reporting. Through this work, we detected and reduced overstated pool balances by $43 million. These are amounts that would have been available to corporations to reduce future tax payable.
Lessons learned
What worked well: We expanded our electronic service options to make it easier for taxpayers to interact with us. We introduced new online security measures to protect taxpayer information, allowing us to offer a broader suite of secure services. We processed individual and business tax and information returns and payments accurately and on time. We carried out pre-assessment and post-assessment activities to detect and address instances of non-compliance.
What could be improved: Our programs are directly impacted by evolving government priorities, budget announcements and economic updates. We must make sure that we are well positioned to maintain effective delivery of our programs under all circumstances. We must also work to sustain this capacity in the longer-term.
Performance Report Card
|
Service Standards Table note 10
|
|||||||
|
Processing T1 individual income tax returns (electronic): within an average of 2 weeks Table note 11
|
|||||||
|
97.3% Table note 12
|
not available Table note 13
|
||||||
- Table note 10
- See www.cra.gc.ca/annualreport for breakdown of indicators, targets, and overall results against external service standards. Return to Table note 10 source text
- Table note 11
- Represents the average number of weeks. Return to Table note 11 source text
- Table note 12
- The service standard was changed from 21 to 30 days to align with a legislative change. Return to Table note 12 source text
- Table note 13
- Substantiated results are not available for 2009-2010. Revised data capture method began in June 2010. Return to Table note 13 source text
For supplementary information on this program activity, please visit:
www.cra.gc.ca/annualreport
Accounts receivable and returns compliance (PA3)
Strategic outcome
Taxpayers meet their obligations and Canada’s revenue base is protected.
Program activity description
Identifying and addressing non-compliance with the registration, filing, and remittance requirements of the Acts administered by the Canada Revenue Agency and managing the level of debt. These are achieved through the collection of accounts receivable and the development, implementation, and maintenance of national systems, policies, and guidelines. This framework facilitates and enforces compliance with the requirements for the filing, reporting, withholding, and payment of individual and corporate tax returns, employer source deductions, Goods and Services Tax/Harmonized Sales Tax, and other levies, as well as delinquent non-tax account receivables administered on behalf of other government departments and agencies.
Performance summary and analysis of program activity
Making non-compliance more difficult
Enhance strategies to manage payment non-compliance
Once an assessment is completed through self-assessment, or re-assessed through our subsequent verification actions, taxpayers must remit any amounts due. We use various means to collect the amounts that are owed to the Government of Canada in order to protect Canada’s revenue base.
Almost all reported taxes are paid on time by individuals and businesses. In cases where monies owed are not paid when they become due, we pursue taxpayers using a range of collection and enforcement actions. To do so, we use a risk-based approach to identify the right compliance response for debtors, ranging from helping individuals further understand their obligations, to undertaking swifter and firmer responses with those whose history demonstrates a need for such action. The CRA manages the federal government’s largest debt collection service, collecting debt arising from taxes, related interest, and penalties owed to the Government of Canada. A recent international benchmarking study showed the CRA has the second lowest cost to collect a dollar of debt among the ten participating tax jurisdictions for the period studied.
In 2010-2011, almost $388 billion in taxes and duties were processed by the Agency. Of this amount, more than 97% was received within the current fiscal year. This situation has been stable over the past four years and is indicative of our receivables being well managed. The international benchmarking study referenced earlier noted that the CRA ranked first among the ten participating tax jurisdictions, for the period studied, in the collection of debt as a percentage of its revenue.
In 2010-2011, our collections area continued to identify efficiencies and strategies related to current workloads as well as new business. As one example, our Debt Management Call Centre started handling another revenue line, deductions from employee salaries remitted by employers. This allows collectors at our Tax Services Offices to focus on more complex cases for these types of accounts. In preparation for the amalgamation of our national and regional pools into one national inventory, we centralized certain accounts, creating Centres of Expertise for these particular workloads. This past year, collections work related to the Harmonized Sales Tax (HST) on behalf of British Columbia and Ontario was initiated. This work has led us to examine our current practices for collecting GST and has resulted in an enhanced focus on improved workload management practices and increased the use of risk management, since it is anticipated that the introduction of HST will have an impact on the level of tax debt in this revenue line.
Managing tax debt poses a significant challenge since levels of indebtedness are strongly influenced by our external environment. According to the OECD’s 2010 Comparative Information Series report, tax debt is a growing problem for the majority of OECD countries. We have implemented strategies to address this issue, including our Payment Compliance Action Plan, which addresses the underlying cause of payment non-compliance at the behavioural level. Nonetheless, we anticipate that the level of tax debt will continue to grow over the short to medium term.
At the end of the 2010-2011 fiscal year, our total tax debt inventory rose to about $27.4 billion, an increase of $2.4 billion over the prior period. This debt includes accounts for which a pending resolution has been reached (for example, the taxpayer has agreed to pay the debt over a specified time) but the debt has not yet been paid in full.
Early determination of our ability to collect debt facilitates both timely and efficient debt collection, since the longer the debt exists, the harder and more expensive it is likely to be to collect. For this reason, during 2010-2011, we continued to rely on our Debt Management Call Centre (DMCC), which addresses high volume routine, low-risk, tax debt at minimal cost within a specified period of time. The DMCC allows our Tax Services Office (TSO) agents to focus on addressing more complex, higher-risk accounts that involve the use of escalating collection measures, including legal and enforcement actions, to deal with non-compliant taxpayers.
Our automated strategies, including our Debt Management Call Centres and our Tax Services Offices addressed a total of $34.1 billion of tax during 2010-2011. When compared to results from the previous year, this total represents an increase of 15.2%. Included in this result are amounts totalling $2 billion that were deemed to be uncollectible and have consequently been written-off. A recent international benchmarking study discussed the prevailing practices of other tax jurisdictions. The study noted that the CRA maintained, for the period studied, the lowest percentage of write-off to total tax revenue among the ten participants. In addition, it is important to note that this is an essential administrative function that is key to maintaining a healthy accounts receivable portfolio. The process is governed by both the Financial and Administration Act and the Bankruptcy and Insolvency Act, whereby accounts must meet prescribed criteria before being subject to write-off.
Timely resolution of debt facilitates our collection efforts. To assess our performance in addressing tax debt on a timely basis, we expect to resolve at least 60% of the TSO intake of new debt in the year of intake. In 2010-2011, we achieved 64.4%, exceeding our target.
The $17.7 billion tax debt we resolved in our TSOs represents 93.1% of the dollar value of the intake of new debt in the past year. This exceeded our target of 90%, indicating that we are successfully managing the higher risk inventory addressed by our TSOs.
The proportion of the age segments of our debt inventory has remained relatively stable over the last five years. This trend confirms that we are managing all segments of the tax debt portfolio in a consistent manner. The international benchmarking study referred to earlier also ranked the CRA second out of the ten participating tax jurisdictions with respect to debt aged less than one year for the period studied.
At the end of 2010-2011, debt over five years old represented 16.9% of the inventory. In absolute terms, the dollar value of inventory greater than five years old at the end of 2010-2011 was $3.4 billion, which represents an increase of approximately $500 million from the previous year, but remains within our targeted threshold of $3.5 billion.
strengthening service to make compliance easier
Enhancements have been made to our Payroll Deductions Online Calculator, as well, to calculate payroll deductions more easily. The improvements include enhancements to screen displays, organization of tools, and information access.
Reporting non-compliance
Our employer withholding and GST/HST examination activities enforce employers’ and taxpayers’ obligations to withhold, report, and remit source deductions, taxable benefits, and GST/HST. To increase and encourage compliance, we use a balanced approach to identify and address non‑compliance through the use of education, assisted compliance activities, and, where warranted, more rigorous actions, such as prosecutions. In 2010‑2011, 2.2 million non‑compliant cases were addressed. Although this represents a shortfall from our initial target of 2.6 million, it is explained by a realignment in workload which resulted in 500,000 cases being transferred to another area within the CRA. We also completed 556,227 reviews and exams and 15,056 GST/HST examinations which generated a total value of identified non-compliance of $1.6 billion.
Maintain and enhance non-filer/non-registrant programs, including underground economy identification projects
The goal of the filing and registering compliance area is to ensure that taxpayers file a return and/or register for the GST/HST if they are required to do so. Our compliance actions range from a simple request to file to more punitive measures such as penalties and prosecution. We make efficient use of available resources by focusing on early intervention. Accounts are identified and strategies are applied to non-compliant behaviour according to recognized risk factors.
Accounts that do not respond to early intervention measures are considered high-risk. We identify these accounts through various means including third-party data and risk models. These accounts require human intervention and are referred for escalating enforcement action. The CRA also undertakes underground economy projects aimed at identifying and addressing filing and registration non-compliance in cases where there are no records on the CRA databases as well as where new or additional information is obtained.
This past year, an evaluation of the Non-Filer/Non-Registrant program was completed. This evaluation will contribute to the renewal of the national program delivery model. The overall intent is to create program improvements that will, over time, contribute to increased short and longer term compliance with filing and registration requirements, thereby furthering the CRA’s goal of making non-compliance more difficult.
Our activities extend to GST/HST registration requirements of businesses. Over the past year, 8,464 businesses were identified as required to register for GST/HST. Our estimates of the rate of registration compliance have remained consistently above our target over the past several years. By comparing our data with information from Statistics Canada, we estimate that 93% of businesses were registered to collect GST/HST during 2010-2011. This met our 90% target.
In 2010-2011, our work to identify non-filers, including underground economy, generated 722,487 returns from individuals and corporate taxpayers that had not met their filing requirements. To gauge the compliance of individual taxpayers with their obligation to file a timely return, we compare our data for individual filers 18 years of age and older with Statistics Canada’s Census of Population data for this segment. For 2010-2011, 92.6% of this population filed their tax return on time, exceeding our 90% target. These estimates have consistently remained above the 92.5% level for every year since the 2001-2002 reporting year, providing a reliable trend for this high degree of voluntary filing compliance that we observe.
Our compliance rate estimates apply to those corporations which are taxable and have filed a T2 Corporation Income Tax Return showing that tax is payable. The incidence of timely filing among such corporations in 2010-2011 was 85.1%, a result which is comparable with past years.
Another important measure of our success in addressing identified filing non-compliance is the increase in the observable long-term filing rate by both individuals and corporations. Our research on filing behaviour shows that, of the taxpayers who did not file their return on time, a majority file these returns within five years after the year the return was due. For example, 93% of individuals and 86.4% of corporations filed their returns on time for the 2005 tax year and, over the subsequent five years 97.4% of individuals and over 99% of corporations had filed their 2005 returns. In addition to the long-term filing rates witnessed, our actions identified $2.8 billion in non-compliance in 2010-2011.
Lessons Learned
What worked well: We identified efficiencies related to current collection workloads and implemented appropriate solutions. One good example is having our Debt Management Call Centre handle an additional revenue line, deductions from employee salaries remitted by employers, which permits our TSO collectors to focus on more complex cases resulting for these types of accounts. We met our targets for timeliness on resolving tax debt and government programs’ (non-tax) debt and our Tax debt and government programs’ (non-tax) debt were within targeted levels.
What could be improved: We acknowledge the need to improve our performance measures to better assess our contribution to our business outcomes. To this end, we will continue to identify the best methods available to gauge the effectiveness of our activities in both identifying and addressing overall non-compliance.
Performance report card
|
Dollar value of TSO tax accounts receivable older than five years ($ billions) Table note 14
|
|||||||
|
$2.8 Table note 15
|
|||||||
|
Upward trend Table note 16
|
- Table note 14
- This is a revised indicator and target Return to Table note 14 source text
- Table note 15
- The target of $2.4 billion includes both T1/T2 and T3 non-filer and GST/HST non-registrant sources. The resulting fiscal value of non‑compliance was identified as $2.64 billion from the T1/T2 and T3 non-filer source, and $118 million from the GST/HST non-registrant source. Return to Table note 15 source text
- Table note 16
- Target does not include GST/HST delinquent filer program. Production and fiscal impact results were unavailable in 2009-2010 and 2010‑2011. Return to Table note 16 source text
For supplementary information on this program activity, please visit:
www.cra.gc.ca/annualreport
Reporting compliance (PA4)
Strategic outcome
Taxpayers meet their obligations and Canada’s revenue base is protected.
Program activity description
Verifying the complete and accurate disclosure by taxpayers of all required information to establish tax liabilities and protect the tax base through audit, enforcement, and incentive administrative activities. Activities for enhancing compliance include; increasing taxpayers’ understanding of their tax obligations through outreach activities, client service, and education; identifying and addressing non-compliance through risk assessment, audit and investigation; and establishing strategic partnerships with stakeholders to leverage compliance efforts.
Performance summary and analysis of program activity
Building trust to promote compliance
Enhance the administration of the Voluntary Disclosures Program
The Voluntary Disclosures Program (VDP) allows taxpayers to come forward and correct inaccurate or incomplete information or disclose information they have not previously reported to the CRA. Taxpayers using the program have to pay the taxes owing, plus interest, but may avoid penalties and prosecution relating to the amounts disclosed.
During 2010-2011, we promoted the program through speaking engagements and other outreach initiatives as well as increased references to VDP in our correspondence with taxpayers and in tax alerts. In addition, clarification of VDP policies was provided through presentations to various associations and responses to media enquiries.
The program saw growth in intake and an increase in the number of disclosures processed during the past year totalling $600 million in additional tax revenue. Voluntary disclosures led to the identification of $773 million in unreported income compared to $1.8 billion identified during 2009-2010. The latter was significantly larger than historical norms because it included two large disclosures with income totalling more than $900 million. Despite the growth in intake, the average number of days to process a file was 180 compared to 196 in 2009-2010 and our VDP inventory is the lowest it has been in years. This program is driven by taxpayers coming forward and therefore it is not possible to control either the number of taxpayers disclosing, or the associated unreported income.
Strengthening service to make compliance easier
Enhance the administration of the SR&ED program
The CRA oversees the integrity of various tax incentives that promote economic growth in Canada, such as the Scientific Research and Experimental Development (SR&ED) program. The SR&ED program is the largest single source of federal government support for industrial research and development. The CRA strives to deliver the tax incentives in a timely, consistent, and predictable manner, while ensuring businesses prepare their claims in compliance with tax laws, policies and procedures.
During 2010-2011, the SR&ED program provided about $3.5 billion in tax assistance to over 21,000 claimants. In addition, as a result of our risk assessment process, in 2010-2011, we identified and addressed $473 million of non‑compliance, an increase of 5.6% from the previous period.
Making non-compliance more difficult
Identify aggressive tax planning schemes more effectively
Aggressive tax planning (ATP) schemes are arrangements purposely undertaken to minimize tax liability. These transactions, often arranged by tax planners and promoters for individuals, trusts, and corporations, are intended to reduce, avoid, or evade Canadian taxes and they may not be consistent with the spirit and intent of the law.
These schemes sometimes involve international transactions or the use of tax havens. Left unchecked, aggressive tax planning presents a risk to the integrity and fairness of Canada’s tax system. Recognizing the problems inherent in relying on traditional audits alone, the CRA has a multi-faceted strategy to combat ATP.
The first component of the strategy is to strengthen legislation to reduce participation in ATP schemes. Over the reporting period, Finance Canada, with the support of the CRA, introduced proposed legislation that would require the mandatory reporting of tax avoidance transactions. This would provide an early warning system which would enable us to gather information on tax avoidance schemes at an early stage and address them before they become a larger problem.
A second component is to use tax information exchange agreements, negotiated by Finance Canada, to reduce the ability of taxpayers to hide income and assets in overseas banks. Of note, Canada signed a Protocol amending the Tax Convention with Switzerland in October 2010.
Thirdly, we work with international organizations such as the Seven Country Working Group, the Joint International Tax Shelter Information Centre and the Organization for Economic Co-Operation and Development (OECD) to share intelligence and best practices to combat ATP.
In 2010-2011 we secured information from our partner countries which identified Canadian taxpayers participating in a significant ATP scheme. There was a large amount of media interest in this information and the resulting CRA action. Taxpayers are realizing these types of schemes are highly risky. Our Voluntary Disclosures Program (VDP) continues to receive disclosures from taxpayers hoping to avoid penalties and prosecutions, by putting their tax affairs in order.
A final element of the multi-faceted strategy is to influence taxpayers by communicating our success in identifying ATP schemes, and outlining the consequences of tax avoidance and tax evasion. An example of the success we have had through communications is the reduction in the number of gifting tax shelter arrangements from 48,000 in 2006 to 10,000 in 2011. We achieved this by identifying arrangements that appeared problematic, following up with audits of 100% of these tax shelter claims, targeting tax shelter alerts to participants, and following this up with a letter campaign.
Identify non-compliance in the underground economy more effectively
The underground economy (UE) remains a priority for the CRA. Underground economic activity is any legal business activity that is unreported or under-reported for tax purposes. The UE undermines the competitiveness of Canadian businesses because it offers an unfair advantage to those who fail to comply with Canada’s tax laws. UE activity is concentrated in sectors where cash transactions are prevalent between businesses and consumers, books and records are weak or non-existent, taxes are not deducted at source, third party reporting is absent, business-to-consumer transactions are generally widespread and services are commonly offered at a discount, and where there is greater acceptance of tax evasion by either individuals or by businesses.
A recent study by Statistics Canada on the size of the underground economy relative to the Gross Domestic Product showed a reduction of half a percentage since 1992. We will continue our efforts to combat this area of non‑compliance.
Our UE strategy is to use a mix of outreach, education, communication, and compliance actions. This is supported by research and intelligence gathering and the systematic allocation of workloads to industry sectors with the highest risk. In 2010-2011, 78% of UE cases selected resulted in a tax assessment. These audits identified $595 million of unreported income with associated fiscal impact of $374 million. This amount represents an increase of 32% over the previous year.
In addition to our ongoing efforts in this area, a number of specific initiatives were conducted in the year to improve our intelligence and focus our efforts. For example, the Federal-Provincial-Territorial Underground Economy Working Group completed the Trade School Initiative. This initiative combined focus group research and a quasi-experimental study to develop a prevention-through-education strategy by aiming appropriate messaging at an early stage in a typical career path, ideally before bad behaviours become entrenched. Construction trade school students were selected as the initial target audience and the initiative will be ready for a full scale launch in 2011-2012. As part our strategy to address the UE, we share best practices with other tax administrations. The CRA has taken the lead for OECD countries to write a paper on the cash economy and we are supporting the Netherlands who are the lead on writing the paper, “Right from the Start.” This approach uses outreach and communications to target new businesses to ensure that “Right from the Start” compliance is encouraged.
We also initiate regional and local projects to identify and study emerging issues, conduct research and gather intelligence, gain industry knowledge by working with associations and other levels of government, and determine the complexity and the range of compliance risk treatments required to resolve the problems uncovered.
Use better risk assessment to detect and correct reporting non-compliance
Once a return is filed, we conduct various reviews and verification and risk assessment activities to identify areas where reporting by individuals, trusts, registered plans, and businesses is not consistent with taxpayers’ obligations to report complete and accurate information. Once identified we proceed to address the highest-risk accounts.
Businesses
In 2009-2010, our Core Audit Program selected self-employed individuals for examination. By examining small businesses that were subjected to its random sample audit, we estimated the percentage of all businesses in this segment that are likely non-compliant to a significant degree, defined as businesses underreporting $5,000 or more in federal taxes.
In 2010-2011, a non-compliance rate estimate was established for self-employed individual filers based on audits conducted during the 2009-2010 program year. The estimated rate of non-compliance was found to be 12.2%. This segment of the SME population has been reviewed twice previously: once in 2001-2002, when the non-compliance rate estimate for self-employed individuals was 8.6%, and again in 2006-2007, when the non-compliance rate estimate was 12.7%. We will focus our efforts on developing a strategy targeting this area of non-compliance.
In 2010-2011, we implemented the Research Audit Program (RAP) to replace the Core Audit Program. It conducts random audits that establish statistically valid levels of non-compliance for sectors of the Canadian economy. The RAP augments existing programs that gather risk intelligence at local, regional, and national levels and channels it into mechanisms used for workload selection. We will begin gathering results from the RAP assessments of the T1 Small and Medium Enterprises population in 2012.
Identifying non-compliant businesses involves a combination of risk assessments, reviews, and audits. Small business audits include owner-operated businesses, small corporations, and partnerships that have revenues of less than one million dollars. Medium-sized business audits typically include individuals with annual revenues over one million dollars and corporations with annual revenues between $1 million and $20 million for Income Tax.
One of the ways we evaluate our success in identifying non-compliance is by tracking how frequently a case selected for audit results in an adjustment. For the past year, the percentage of cases resulting in a change for SMEs was 80.3%, which was a slight decrease from 2009-2010. Research work conducted through our Core Audit Program indicates that our targeted audits are 3.8 times more likely to identify significant non-compliance than randomly selected audits. A recent international benchmarking study showed the CRA change rates for full SME audits fell within the mid-range of the rates identified by the other countries involved in the study.
We are also enhancing our approach to ensuring compliance within the large business population. We assess risk levels using sector intelligence, CRA-based expertise, and information from our tax treaty partners. We further combine these resources with information related to the nature of the business in question and their current and past behaviour, including aggressive tax planning (ATP), that indicates the potential risk of non-compliant behaviour. This further evolution of our approach should enable us to focus our resources on those large businesses most at‑risk of non-compliance. This will enhance change rates and encourage a level playing field for compliant businesses. For the past year, the percentage of cases resulting in a change for international and large business programs was 94%.
Through a combination of our employer actions and our SME and large business audits and reviews, we identified $8.3 billion of non-compliance for the 2010-2011 period. New this year is the introduction of a new performance measure aimed at measuring the effectiveness of our actions in obtaining fiscal impact per employee. This new measure highlights the value of our auditing function. For instance each audit Full Time Equivalent (FTE) is responsible in addressing an average of $2.9 million for the large business population and $400,000 for the small and medium enterprise and other populations. The inclusion of this measure permits the CRA to demonstrate the efficiency gains over time within the context of its available resources.
Use enhance risk assessment to identify non-compliance by employers and GST/HST registrants
The HST regime was extended to Ontario and British Columbia on July 1, 2010.Footnote 3 The HST now represents a significant source of tax revenue. In addition to significantly increased workload for the CRA, the combined federal and provincial rates entail increased compliance risks that the CRA is mitigating through a dedicated GST/HST organization and increased focus on risk intelligence and assessment.
During 2010-2011, review of business filings in our GST/HST pre-assessment program provided an early warning that a potentially significant number of large businesses would, perhaps inadvertently, not comply with HST reporting requirements for the recapture of input tax credits. This would normally result in audit action and the application of penalties. Our response was to take a proactive and constructive approach that involved acting on risk intelligence available from our systems to proactively communicate with businesses at risk of non-compliance to clarify their obligations and offer assistance where needed. Some 26,000 letters were sent to large registrants identified by our systems. Follow-up telephone calls were made to more than 15,000 businesses that were still at risk of non-compliance after the mail-out, and subsequent calls are still being placed to a subset of these businesses that still remain at risk.
We have determined that compliance action, including re-assessment and penalty application, is necessary and appropriate for a smaller number of businesses and are proceeding with these steps. The distribution of tax revenues collected by the CRA to participating provinces is dependent on registrants reporting full and accurate information about their taxable expenses. The approach followed in this instance protected the revenue base of our client governments through early identification of businesses at risk, proactive compliance communication based on intelligence, assistance and follow-up. In addition, the presence of the CRA within the community of large taxpayers may have prevented significant reporting non-compliance from arising, and averted important audit expenses and compliance costs for businesses.
Enforcement
While the CRA has a sustained audit presence across sectors, our Special Enforcement Program is focused on addressing the small minority of taxpayers who are engaged in more serious acts of non-compliance. Our Special Enforcement Program conducts audits and undertakes other civil enforcement actions against individuals and businesses known to be, or suspected of, deriving income from illegal activities. Suspected significant cases of fraudulent non-compliance are dealt with by our Criminal Investigations Program, which investigates and refers cases for prosecution to the Public Prosecution Service of Canada. These cases can result in penalties, court fines and up to five years of incarceration. We communicate the consequences of fraud committed against the Canadian public, in order to maximize the deterrent effect of these convictions. The CRA works with regional communications advisors to distribute news releases containing details of convictions on tax evasion to local, regional, and national media. In 2010-2011, the CRA distributed 235 news releases on convictions which were used to generate articles and broadcast news topics. In 2010-2011, a total of 204 taxpayers were convicted for tax evasion or fraud. The courts imposed $22.8 million in fines and 47 years of jail sentences. For the reporting period, 129 income tax and GST/HST investigations were referred to the Public Prosecution Service of Canada.
The nature of this taxpayer segment makes it difficult to measure the influence of our enforcement program on others who may be considering similar non-compliant behaviour. This is, in part, because the drivers of non-compliant behaviour among this population may go beyond strictly attempting to avoid taxes. Other criminal considerations may be at play.
The effectiveness of CRA enforcement programs and activities is essential to achieving its compliance objectives. In 2010, a multi-year evaluation of the CRA’s enforcement programs was completed. The findings from the report are being incorporated into action plans to support a more focused approach for the Criminal Investigations and the Special Enforcement programs, which will enhance file selection and further build upon partnerships with the Public Prosecutions Service of Canada and law enforcement agencies. The rate of conviction is very high due to case selection. Cases are selected for prosecution based on their expected outcome as there is a high cost to this type of compliance intervention. In this way, Canadians and Canadian businesses are reassured that the most egregious cases are pursued to the fullest extent. The results achieved during 2010-2011 support our assessment that we contributed to making non-compliance more difficult.
Lessons learned
What worked well: We worked closely with our international partners to identify Canadian taxpayers participating in a significant aggressive tax planning (ATP) schemes. These efforts attracted a large amount media interest. Over the reporting period, Finance Canada, with the support of the CRA, introduced proposed legislation that would require the mandatory reporting of foreign avoidance transactions. This would provide an early warning system which would enable us to gather information on tax avoidance schemes at an early stage and address them before they become a larger problem. The underground economy (UE) remains a priority for the CRA. Our UE strategy is to use a mix of outreach, education, communication, and compliance actions. The CRA has taken the lead for OECD countries to write a paper on the cash economy and we are supporting the Netherlands who are the lead on writing the paper, “Right from the Start.” This approach uses outreach and communications to target new businesses to ensure that “right from the start” compliance is encouraged.
Our Voluntary Disclosures Program (VDP) continues to receive disclosures from taxpayers hoping to avoid penalties and prosecutions, by putting their tax affairs in order. We promoted the program through speaking engagements and other outreach initiatives as well as increased references to VDP in our correspondence with taxpayers and in tax alerts.
What could be improved: We will proceed with developing a strategy to target non-compliance by self-employed individuals. In 2010, a multi-year evaluation of the CRA’s enforcement programs was completed. The findings from the report are being incorporated into action plans to support a more focused approach for the Criminal Investigations and the Special Enforcement programs.
Performance report card
|
Fiscal Impact: Table note 17
|
|||||||
|
$7.2 Table note 18
|
|||||||
|
Fiscal impact generated per audit FTE Table note 19 ($ million)
|
|||||||
|
Small and medium-sized enterprises ($ billion) Table note 20
|
|||||||
- Table note 17
- Fiscal impact targets are used to measure overall performance of the CRA for planning purposes. Individual quotas are not assigned. Return to Table note 17 source text
- Table note 18
- The two billion dollar increase over 2008-2009 is attributable to two audits which were unusually large in nature. Return to Table note 18 source text
- Table note 19
- This includes all support staff, auditors, management, and executives who report to the audit function area. Return to Table note 19 source text
- Table note 20
- This includes the fiscal impact generated through our work in addressing the underground economy. Return to Table note 20 source text
For supplementary information on this program activity, please visit:
www.cra.gc.ca/annualreport
Appeals (PA5)
Strategic outcome
Taxpayers meet their obligations and Canada’s revenue base is protected.
Program activity description
Providing a timely and impartial dispute resolution process for taxpayers who disagree with decisions made by the CRA, by actively engaging in dialogue with the taxpayer and exploring alternative processes to resolve disputes when appropriate, as well as assisting the Department of Justice in handling appeals to the courts.
Performance summary and analysis of program activity
Building trust to promote compliance
Resolve taxpayer disputes and service complaints
Redress
The right of taxpayers to request an impartial review of CRA decisions is integral to our tax administration system. If they are still not satisfied following this comprehensive review, recourse through the judicial process is available.
We continued to ensure high quality standards during 2010-2011. Two key measures of our quality redress process are our measures of consistency and transparency. Transparency measures evaluate whether we offered to provide to the taxpayer all relevant information supporting the issues under dispute. Consistency measures evaluate whether we reviewed, researched, and addressed taxpayers’ issues under dispute, applied the law correctly, provided taxpayers with an opportunity to respond to our proposals, and arrived at correct decisions. During 2010-2011, we exceeded our transparency and consistency targets, except for commodity taxes where we achieved 95% against a 98% consistency target.
The largest proportion of our dispute-resolution workload involves income tax disputes. During 2010-2011 it took, on average, nine workable days more to provide taxpayers with a decision compared to 2009-2010. In contrast, we took 30 workable days more in 2009-2010 compared to 2008-2009. Even though the workable days to resolve disputes has continued to climb, this growth is lower than in prior years.
During 2010-2011, the average time to resolve commodity tax disputes rose by an average of 48 days and the average age in inventory for our commodity tax files increased. These increases resulted from the reassignment of resources from commodity tax to income tax resolution activities in 2009-2010. This past year, we adjusted our commodity tax capacity, leading to the resolution of more commodity tax disputes than in the previous year.
The average time to resolve a CPP/EI appeal to the Minister of National Revenue rose by six days in 2010-2011. Our production rate increased and our inventory of workable files at the end of the year dropped. These changes were influenced by the resolution of older files and a slight drop in intake. The average age of inventory for our CPP/EI files also improved this past year, dropping to 118 days during 2010-2011 from 135 days in 2009-2010.
Service complaints
Service complaints help us to identify problems, propose solutions, and provide taxpayers with a formal avenue of recourse, which is guaranteed under the Taxpayer Bill of Rights. If taxpayers disagree with a decision resulting from our Service Complaints process, they can file recourse actions with the Taxpayers’ Ombudsman.
Improving this service to taxpayers is critical to the ongoing success of the program and to increasing Canadians’ confidence in the CRA’s promise of fairness. In 2010-2011, we reviewed the cases received by the Service Complaints program to identify common complaints from taxpayers.
We identified 26 issues of national importance through analysis of our Service Complaints Program. Of these, 5 were resolved, 21 are still under review. Some of the examples of issues resolved included:
- An international fax number for anyone not satisfied with the services provided by CRA.
- Tax information for the Retirement Compensation Arrangement slips.
We have in place three performance indicators to demonstrate our determination to provide taxpayers with a consistent and effective service complaints process:
- We aim to send the taxpayer a complaint acknowledgement letter within two business days of receiving the complaint;
- We are committed to updating the taxpayer on the status of their complaint every 15 days thereafter; and
- We strive to resolve the taxpayer complaint within 30 working days.
For the period 2010-2011, we exceeded the 90% performance targets for all three standards.
Fully integrate the Problem Resolution Program and the CRA Service Complaints initiative
We completed the integration of the Problem Resolution Program and the CRA Service Complaints initiative in June 2010. This integration strengthens existing service redress mechanisms in place at the CRA and safeguards the service rights outlined in the Taxpayer Bill of Rights.
Address the challenge of dealing with increasing mandatory workloads
The CRA is experiencing an increase in disputes from taxpayers impacted by the CRA’s audit approach to aggressive tax plans. These plans typically involve transactions, arrangements, or events that are specifically designed to reduce taxes. We have preserved our high quality standards in the processing of disputes. However, due to the high volume, this approach has been maintained at the expense of overall timeliness.
During 2010-2011, we further strengthened service to Canadians by taking a centralized workload distribution approach to the less complex disputes received. Previously, this work had regional boundaries but today it can be distributed throughout the country. This strategy is starting to produce improvements in service delivery.
Develop and implement program status reporting and regional management for the taxpayers relief workload
The Taxpayer Relief Program was successfully launched on April 1, 2011. This program is being delivered by newly established four regional intake centres and four centres of expertise.
The key deliverables achieved as part of the project implementation are:
- A regional service delivery model established to improve consistency in processes and decisions;
- Performance measures being developed to monitor and report on the Program's effectiveness in achieving its objectives;
- The Taxpayer Relief Registry System enhanced to support the taxpayer relief business transformation;
- A scanning system developed and introduced to support the CRA’s sustainable development strategy; and
- The CRA’s external Web site on taxpayer relief updated in line with the taxpayer relief external communications strategy.
Lessons learned
What worked well: We further strengthened service to Canadians by taking a centralized workload distribution approach to the less complex disputes received. Previously, this work had regional boundaries but today it can be distributed throughout the country. This strategy is starting to produce improvements in service delivery.
What could be improved: We are experiencing an increase in disputes from taxpayers impacted by the CRA’s audit approach to aggressive tax plans. These plans typically involve transactions, arrangements, or events that are specifically designed to reduce taxes. We have preserved our high quality standards in the processing of disputes. However, due to the high volume, this approach has been maintained at the expense of overall timeliness.
Performance report card
|
Workable days to complete a case Table note 21
|
|||||||
- Table note 21
- The overall rating is based on whether or not results were achieved against established targets for the combined workloads. Return to Table note 21 source text
For supplementary information on this program activity, please visit:
www.cra.gc.ca/annualreport
Benefit programs (PA6)
Strategic outcome
Eligible families and individuals receive timely and correct benefit payments.
Program activity description
Providing Canadians with income-based benefits and other services that contribute directly to their economic and social well being through administration of the Canada Child Tax Benefit, Goods and Services Tax/Harmonised Sales Tax credit, Children’s Special Allowances, the Disability Tax Credit, the Universal Child Care Benefit, and Working Income Tax Benefit (WITB) advance payments as well as a range of ongoing benefits and one-time payment programs on behalf of the provinces and territories, and other federal government departments. Assisting benefit recipients in meeting their obligations through the provision of timely responses to their enquiries.
Performance summary and analysis of program activity
Making it easier to receive the right social benefits
Strengthen service to benefit recipients
Although e-services are fast becoming Canadians’ preferred choice, many people still rely on the telephone for access to information and services. Information exchanged over the phone can be critical to timely account updates and accurate benefit and credit calculations. In 2010-2011, the total of benefit calls (CCTB and GST/HST credit) handled by agents or through automation was over 9% higher than in 2009-2010. The increase was primarily due to calls related to two new credits: the Ontario Sales Tax Transition Benefit and the Ontario Sales Tax Credit. We were successful in meeting our target of 90% of callers able to reach us by telephone for the third consecutive year.
Support business growth and partnerships
In 2010-2011 we delivered four new programs; the Nova Scotia Affordable Living Tax Credit, the Ontario Sales Tax Transition Benefit, the Ontario Sales Tax Credit and the British Columbia Harmonized Sales Tax Credit. Combined, these programs represented 24 million payments worth more than $3.6 billion. By delivering such programs on behalf of our provincial and territorial partners, we are reducing the overall cost to Canadians of benefit and credit issuance through reduced duplication in administration.
We gauge our progress as the provider of choice by the volume of programs and services we are asked to deliver each year for our federal, provincial, and territorial clients. In 2010-2011, we introduced 19 new programs and services, bring the total to 115.
During 2010-2011, CRA worked in partnership with Human Resources and Skills Development Canada on a telephone survey o Universal Child Care Benefit (UCCB) recipients to determine the effectiveness of the program. CRA provided data for the analysis, as well as information to identify UCCB recipients for the survey.
Strengthen benefits delivery infrastructure
The Taxpayer Representative Identification System (TRIS) is an online database that permits CRA employees to verify whether a third-party representative is authorized to act of behalf of a particular taxpayer. During 2010-2011, enhancements were made to allow Efile service providers to submit TRIS forms electronically. This enhancement has contributed to improved results for the timely processing of TRIS forms.
Our individual credit determination (ICD) system determines entitlement to benefit and credit payments and also provides information, where authorized by law, that supports other governments in delivering their own programs. To make sure we can deliver reliable benefit and credit programs for years to come, we have made strategic investments in our system infrastructure.
Optimize service delivery channels
E-services are growing in popularity among benefit recipients. There was an increase of 62% over the last year in visits to Benefits related Web pages of My Account. We attribute this trend to several things including enhancements of our web pages and giving access to recipients legal representatives to the Benefits Online Application and View Children in my Care options.
Another example of enhanced service for Canadians is the Automated Benefit Application (ABA). The ABA enables Canadian newborns to be registered automatically for the federal and provincial benefit programs we administer. This eliminates the need for a separate application for each program and the related processing time, speeding delivery of payments to recipients. In 2010-2011, the number of provinces participating in the ABA program increased from three to five with the Provinces of Ontario and Quebec joining in July 2010.
Ensure accurate payments
To measure levels of compliance, we review and verify recipient information each year, contacting individuals to confirm details of their accounts. If the account information is incorrect, we update it. We use both random sampling and specific criteria to select accounts. More than 95.5% of the random accounts that were validated during 2010-2011 contained accurate information, meeting our target of 95%, while over 49.9% of the individuals contacted as a result of targeted reviews required account adjustments, meeting our target of 50%.
We measure payment accuracy by comparing the net value of CCTB overpayments to the total amount of CCTB payments issued. Net CCTB overpayments in 2010-2011 were 38 million, representing only 0.38% of the $10 billion in CCTB payments issued during the year, coming in under our established target of less than 0.4%. These figures suggest that we have been successful in delivering accurate payments to benefit recipients.
Lessons learned
What worked well: In 2010-2011 we launched four new programs; the Nova Scotia Affordable Living Tax Credit, the Ontario Sales Tax Transition Benefit, the Ontario Sales Tax Credit and the British Columbia Harmonized Sales Tax Credit. Combined, these programs represented 24 million payments worth more than $3.6 billion.
What could be improved: We are challenged each year to ensure that increased needs and limited resources do not have a negative effect on our delivery of essential benefits and services.
Performance report card
|
Percentage of CCTB callers who reach our telephone service Table note 22
|
|||||||
|
Percentage of GST/HST credit callers who reach our telephone service Table note 23
|
|||||||
- Table note 22
- Caller accessibility targets were increased from 80% to 90% for 2008-2009. Return to Table note 22 source text
- Table note 23
- There was no target for GST/HST credit callers before 2008-2009. Return to Table note 23 source text
For supplementary information on this program activity, please visit:
www.cra.gc.ca/annualreport
Internal services (PA7)
Strategic outcomes
Taxpayers meet their obligations and Canada’s revenue base is protected; and
Eligible families and individuals receive timely and correct benefit payments.
Program activity description
Internal Services are groups of related activities and resources that are administered to support the needs of programs and other corporate obligations of an organization. These groups are: Management and Oversight Services; Communications Services; Legal Services; Human Resources Management Services; Financial Management Services; Information Management Services; Information Technology Services; Real Property Services; Materiel Services; Acquisition Services; and Travel and Other Administrative Services. Internal Services include only those activities and resources that apply across an organization and not to those provided specifically to a program.
Performance summary and analysis of program activity
Maintaining business sustainability
MANAGEMENT OVERSIGHT
In 1999, the Canada Revenue Act established a unique governance structure for the CRA. This structure encompasses a direct, legislated relationship between the Minister of National Revenue and the Board of Management, as well as specific, legislated roles and responsibilities for each.
To make sure that we are effectively meeting our responsibilities for accountability, we use two complementary tools: the Management Accountability Framework (MAF) assessment conducted by the Treasury Board of Canada Secretariat and the Board of Management Oversight Framework (BoMOF) assessment conducted by our own Board of Management. Together, the two assessment tools provide a complete evaluation of the CRA’s management performance.
In 2010-2011, our Board of Management conducted the fourth BoMOF assessment and gave our management team high grades. Out of the nineteen indicators, none required attention or presented an opportunity for improvement. All were found to be “strong” or “acceptable”.
The 2010-2011 MAF assessment examined six indicators during the most recent MAF round. The CRA received “strong” ratings for half of these indicators and “acceptable” for the remainder.
The positive results of these assessments provide Canadians with assurance that the CRA is actively pursuing management excellence.
Improving our human resources capacity
The CRA environment is experiencing the effects of some important changes that continue to have an impact on our workforce and workplace. These include baby boomers leaving the workplace, taxpayers’ changing needs, and the emergence of new technologies. The challenge lies in identifying where to focus our efforts and resources to ensure that we continue to attract, develop and retain a workforce that will enable us to meet both current and future business requirements.
In 2010-2011 we have taken an increasingly strategic and horizontal approach to aligning its human resources planning with its business planning. Our third consolidated Strategic Workforce Plan (ASWP) lays out how we will ensure that it acquires and develops the human resources talent necessary to achieve program objectives.
Since its first publication, the ASWP has matured into an effective planning tool that establishes the workforce goals and objectives that we must achieve to support the strategic priorities identified in our Corporate Business Plan.
The CRA implemented several components of the ASWP in 2010-2011:
- A Respectful Workplace intranet module was launched that added new topics throughout the year, including a video featuring our Commissioner.
- The CRA’s Injury and Illness Policy was complemented by our Managing Injury and Illness Process Tool, which was promoted extensively throughout 2010-2011. It has been recognized as a best practice within the Public Service and is now shared with three other government departments.
- A voluntary survey of managers was completed in summer 2010 to gain a better understanding of employee mobility issues and challenges. The survey results were published to enable branches and regions to use this information in their development of tailored strategies.
The CRA also fulfilled commitments made in the ASWP related to leadership development, employee orientation, and learning strategies for key jobs:
- Various initiatives were undertaken to address the learning needs of managers as their careers progress. A manager Caf� was created on the Manager’s Corner Web site to allow for the exchange of information and ideas. An Executive/Cadre Orientation Session and an Executive/Cadre Learning Program were launched to support newly recruited executives.
- Employee orientation is a key activity in developing the CRA’s talent pool. In 2010-2011 we launched “A Good Start”, an employee orientation program to provide new employees with helpful information about the organization. We also launched a web site to support managers in integrating new employees.
In addition, as a result of agreements with the provinces related to HST this past year, we welcomed new provincial employees into our organization. The first wave of provincial employees made a successful transition to the CRA in November 2010.
In 2010-2011 we undertook activities that reinforce our ongoing commitment to values, ethics, and integrity. An Integrity Framework is being developed to support the CRA in balancing two significant responsibilities: fostering our culture of integrity; and, preventing, monitoring, detecting, and managing integrity lapses. A “CRA culture of integrity value chain” was developed. Tailored orientation and training products help executives, managers, and employees recognize and fulfil their roles in a way that reflects the CRA’s culture of integrity and its core values.
Our Discipline Policy and Procedures, which were extensively reviewed and enhanced in 2010-2011, contribute to the overall integrity of the CRA by clearly articulating the possible consequences when an employee fails to act in accordance with the values and expected standard of conduct. Appropriate disciplinary and/or administrative action (up to and including termination of employment) is promptly taken in all cases where employee misconduct has been determined.
IT responsiveness and sustainability
Information technology (IT) is integral to the CRA’s capacity to deliver its programs and services to Canadians. To maintain this capacity, we work diligently to ensure that our systems and infrastructure are robust, secure, reliable, and recoverable.
System updates
In October 2010, CRA-Credential Management Service was implemented, significantly reducing the CRA’s cost of authentication for e-services and positioning the CRA to grow its e-service offerings cost-effectively.
In 2010-2011, we updated the Information Technology – Infrastructure Investment Plan to reflect both funding restraints and planned expenditures. Our Application Sustainability Program was enhanced by implementing a long range plan. We also agreed to share our technological expertise with Treasury Board Secretariat in developing a government-wide response to the Office of the Auditor General audit on IT sustainability.
Working with others
The CRA has entered into a tri-lateral arrangement with the Bank of Canada and Public Works and Government Services Canada to jointly acquire data centre services in the National Capital Region from the private sector. The data centre supports the work of the CRA and the Canada Border Services Agency (CBSA). The contract to build the new facility was awarded in 2010-2011. The state-of-the-art data centre will meet long-term availability, business continuity, security, and growth requirements, while incorporating “green” energy and environmental technology.
Environmental upgrades were implemented at all of the CRA’s data centres in 2010-2011, while ensuring recoverability efforts continue to meet business requirements for all CRA systems. In the event of a disaster at Data Centre Heron we have improved our ability to respond and provide near-continuous availability to taxpayers and benefit recipients through the automatic transfer of mainframe services to Data Centre St-Laurent. We also dedicated significant resources to prepare our systems and infrastructure for the tax season, avoiding major outages, and decreasing the number of critical incidents that have a national impact during the filing season.
During the year, we maintained high levels of availability for the multiple national CRA and CBSA systems, while meeting the challenges of safeguarding our IT assets from accidental or deliberate security threats. We also worked with the CBSA to ensure that our shared IT services relationship, the largest within the Government of Canada, continues to be cost effective for the Government. In 2010, we updated our Memorandum of Understanding for the provision of Corporate Administrative Services to the CBSA.
Awards and secure systems
In October 2010, we were recognized as Distinction Award Honourees for four of our information technology projects at the Government Technology Exhibition and Conference. We further developed our IT strategy, focusing on our commitment to sustain and improve our performance by strengthening the governance of our IT investments and implementing best practices for risk management.
In addition, over the past year, we continued to advance our Security Modernization Program as we began deploying host intrusion protection technology and advanced preparations for the implementation of network access control technology. We also implemented the CRA-Credential Management Service on time and within budget, significantly reducing the cost of authentication for e-services and positioning the CRA to grow its e-service offerings in a cost-effective manner.
Ensure secure management of protected information
Safeguarding Canadians’ personal information is a priority at the CRA. In 2010-2011, we made investments in our security management systems in order to protect information. We are modernizing the National Audit Trail System (NATS) to streamline employees’ access to our systems and to permit a more proactive approach to detecting unauthorized access. NATS was selected as a project to be included in the CRA’s Strategic Investment Plan. We continued to advance the Identity and Access Management Project. Its objective is to standardize processes used to manage access to our data, thereby ensuring compliance with security policies and rules. We also advanced the Internal Fraud Control program, to ensure that the organization continues to take all reasonable measures to safeguard the assets, resources, information and reputation of the organization. This includes the development of tools and methodology to perform fraud risk assessments. The Internal Fraud Control Policy received Board of Management approval in June 2010. This policy defines internal fraud for the CRA and describes roles and responsibilities for control of fraud.
During the reporting period, the Information and Technology Security Strategy was produced to ensure an integrated and consistent approach to the delivery of our security program. It articulates a consolidated governance structure to further strengthen the CRA’s ability to safeguard the confidentiality, integrity and availability of our information and technology assets. The Strategy was approved by the Board of Management in December 2010.
Manage business information
This past year saw the CRA take a major step forward in enhancing information management practices. We developed the CRA Information Management Strategy 2010-2011 to 2012-2013, the first of its kind for the organization. The strategy approved in 2010 will help us to align with emerging Government of Canada direction.
We completed the primary functional information classification scheme and retention periods for all program and most corporate branches. As well, we advanced the development and implementation of detailed functional information classification including three pilots and research on metadata and recordkeeping. A report with recommendations will be presented early in 2011-2012, which is expected to be followed by detailed planning in 2011-2012.
Accountability and oversight
The CRA takes accountability very seriously, recognizing that transparency is crucial to demonstrate results for Canadians and to gain taxpayers’ trust. In 2010-2011, we tested the design and implementation of its key internal controls related to financial reporting on CRA activities and partially completed operational effectiveness testing of these controls. These efforts support the Chief Executive Officer’s and Chief Financial Officer’s annual Statement of Management Responsibility, including Internal Control Over Financial Reporting, which is published with the annual Financial Statements audit report.
This work will help provide assurance that appropriate internal controls over financial reporting are operating effectively and that the CRA’s financial reporting is reliable. It ensures that significant financial controls, risks, and issues are identified and addressed as required by the Tax Collection Agreements, the TBS Policy on Internal Controls, and the Financial Administration Act.
Budget 2010 announced that federal government departments’ and agencies’ operating budgets would be frozen for two years at fiscal year 2010-2011 levels. This year, we developed a cost containment management plan to ensure that resources would be available to continue to support government priorities, as well as to fulfil our legislated responsibilities and maintain the delivery of core business, while respecting the need for fiscal restraint.
Refine our strategic investment plan
First introduced in 2009, our Strategic Investment Plan (SIP) provides decision-makers with the necessary information to effectively manage our portfolio of major infrastructure investment projects. It is integrated with our strategic themes and objectives, and consistent with the Treasury Board’s Policy on Investment Planning. Annual updates to the SIP focus on ensuring the integrity and sustainability of our mission-critical systems, and allow for adjustments to be made in view of changing priorities, emerging risks, or government-wide initiatives that affect funding.
The second, 2010-2015 edition of the SIP was successfully developed and approved by senior management in the reporting period. During its development, particular attention was devoted to ensuring the plan adequately reflects our needs and priorities in terms of IT infrastructure and business/IT solutions. This theme was replicated throughout the various related SIP products, such as the Treasury Board Submission and Capital Plan prepared in support of the condition to access the funding for the T1 Redesign. The plan led to investment decisions and the granting of approval for a number of projects to initiate their planning stages and present a submission to our Agency Management Committee.
In 2010-2011, we also implemented an integrated project management tool, Project System, for major new investment projects. Project System was integrated into our Corporate Administration System to facilitate project and portfolio structuring and reporting. Among its benefits, the new tool enables the multi-year tracking of project costs and enhances our ability to compare planned costs to actual expenditures. In accordance with the plan for gradual implementation, seven projects were captured in Project System in 2010-2011 as they entered new stages of the approval process. To ensure the successful implementation of the new system, monthly discussion forums were held to gather feedback and provide training. A strong commitment to consultation and coordination with key stakeholders ensured that issues were addressed and that the most accurate financial information possible was captured in the system.
Employ risk management consistently and systematically
The Enterprise Risk Management program is designed to effectively manage risks through a systematic and comprehensive approach that is methodically integrated into its decision-making, planning, and reporting processes.
An update to the Corporate Risk Inventory 2009 was completed in 2010. The 2010 edition of the Inventory was developed by conducting interviews that provide a broad perspective on shifts in the internal and external environments that drove changes to the risks presented in the 2009 Inventory. The conclusion drawn from these interviews was that no significant changes to the enterprise risks have been identified to warrant additional action. Consequently, we are continuing to implement strategies for already identified risks requiring mitigation.
During 2010-2011, the CRA consulted with national and international organizations from the public and private sectors as well as communities of expertise on leading practices. Based on our research findings, we adopted an improved enterprise risk management cycle. This multi-year approach will eliminate cycle overlap and process fatigue, provide a more horizontal outlook, and reduce inefficiencies while increasing the availability of more timely and relevant risk information.
Service Standards in the CRA
Maintaining the confidence of Canadians in the integrity of the tax system is essential to the success of the CRA. Service standards that are reasonable and consistently met contribute to increasing the level of confidence that Canadians place in government. Our service standards publicly state the level of performance that citizens can reasonably expect to encounter from the CRA under normal circumstances. We set targets that state the percentage of time or level of accuracy that we expect to attain for the established standard. Targets represent the percentage or degree of improvement we expect to attain, based on operational realities such as resource availability, infrastructure, historical performance, the public’s expectations, and the complexity of the work. Our standards and targets are reviewed annually and updated, as necessary.
For more information on CRA’s service standards, please visit: http://www.cra-arc.gc.ca/gncy/nnnl/menu-eng.html
Enhance Sustainable Development
This past year was a transition year for the CRA in implementing our Sustainable Development (SD) National Action Plan. While we continued to focus on maintaining SD momentum, we began preparing the CRA to support Canada’s first Federal SD Strategy. During 2010-2011, we implemented numerous activities under the SD National Action Plan including increasing SD awareness, the sustainable business travel course, green procurement, energy conservation, battery recycling program implementation, SD performance reporting and the paper use reduction. The following reflects the results of these efforts:
- 97% of employees are familiar with SD as it relates to the CRA (up 8% from 2007 and exceeding the 2010 target of 95%);
- A total of 1,400 employees completed the Sustainable Business Travel course;
- Over 49% of goods purchased in Synergy were “green”;
- Energy waste was reduced by 25% in six pilot facilities;
- Battery recycling programs were expanded; and
- An updated SD Performance Reporting Tool, SD Criteria Tool, and new SD wiki space were launched.
As encouraging as the above results are, average office paper use per employee increased by 4%, highlighting the need for continued efforts to meet our paper reduction commitments.
The CRA Sustainable Development Strategy 2011-2014 was developed to specify direction for future CRA SD activities.
Enhance the Integration of Social Media
Due to the rising popularity of social media and increased demand from both Canadians and internal stakeholders to accelerate its use, the CRA completed a Strategic Plan for External Communications through Social Media for 2010‑2012. This plan establishes clear goals and objectives when using social media to communicate with Canadians and identifies planned activities in support of these objectives.
In 2010-2011 social media components were considered for all major communication and marketing or advertising initiatives. When deemed appropriate, social media tools, YouTube videos or videos for the CRA video cast window were incorporated into larger communication and marketing strategies. Social media was fully integrated into the tax‑filing season strategy.For example, CRA used its new Twitter account to issue tweets of its popular Tax Tip series.
For the second consecutive year, the CRA repeated its YouTube Video Contest – The Underground Economy: Not Your Problem? – as a component of the Compliance Communication Strategy. The objective of the contest was to continue the discussion initiated during the first contest about the downside of the underground economy.
The CRA Web Site Strategic Plan
The CRA Web Site Strategic Plan 2009-2010 to 2011-2012 was approved in February 2010. The plan established four key objectives. To meet them, the CRA undertook a variety of initiatives to better understand and respond to Canadians’ expectations for CRA Web services. The following highlights illustrate how the CRA has moved the Strategic Plan forward:
Objective – Increase the overall awareness of the services offered on the Web site:
Objective – Increase the ease of finding information by 5%:
- We conducted the 2010 CRA Web Site Individual Telephone and Online User Survey.
- We conducted usability testing with individual and business users.
- We developed high-level business requirements for advanced Web site research.
- We completed an upgrade of a new search engine for the CRA Web site.
- We developed business requirements for a test environment.
- We actively participated in the User Experience Working Group.
Objective – Explore and implement three new web technologies:
- We improved Web site infrastructure to support enhanced multimedia content.
- We continued with CRA-wide implementation of the Publishing Content Management Solution.
Lessons learned
What worked well: We delivered on our management priorities through timely and responsive decision-making, a fully accountable senior management culture, streamlined management policies and practices, and improved planning and reporting.
What could be improved: We continue to do additional work on our management regime. We will also continue to advance Information Management.
For supplementary information on this program activity, please visit:
www.cra.gc.ca/annualreport
Canada’s Economic Action Plan Initiatives
Reducing the tax burden on Canadians is a central theme to many of the action plan initiatives undertaken in recent years. The Economic Action Plan introduced significant new personal income tax reductions that are providing relief, particularly for low- and middle-income Canadians, as well as measures to help Canadians purchase or improve their homes. These tax reductions allow individuals and families to keep more of their hard-earned money and improve incentives to work, save and invest, while also contributing to the Government's long-term economic agenda.
Our efforts at the CRA have enabled the Government to successfully deliver on these commitments. We continue to administer programs to help families, seniors, workers, and persons with disabilities. We also administered corporate income tax reductions that were put in place to help Canadian businesses weather the effects of the global economic challenges, to maintain and create jobs.
In 2010-2011, the CRA was provided with $9.6 million in action plan funding to administer the Home Renovation Tax Credit, First-Time Home Buyers Tax Credit. Additional monies were also provided for Late filing and incorrect format penalties and for the simplification of GST/HST for the direct selling industry. These supplementary funds enabled the CRA to augment our capacity to deal satisfactorily with the increased information requirements presented by these initiatives.
The following are just a few of the action plan initiatives that the CRA administered and delivered on behalf of Canadians.
The Working Income Tax Benefit Program provided a refundable tax credit for eligible working low‑income individuals and families who are already in the workforce and encouraged Canadians to enter the workforce.
The First-Time Home Buyers’ Tax Credit assists first-time home buyers with the costs associated with the purchase of a home.
The Home Renovation Tax Credit Program provided a non-refundable tax credit for eligible expenses incurred for work performed or goods acquired for an eligible dwelling.
The Canada Child Tax Benefit Program provided a tax-free monthly payment to eligible families to help them with the cost of raising children under the age of 18. Through the Economic Action Plan, the federal government raised the level at which the National Child Benefit Supplement amount for low-income families and the Canada Child Tax Benefit are phased out, so that eligible families with two children received additional benefits.
We are pleased to report that the tax relief measures for individuals, families and businesses announced in Canada’s Economic Action Plan have now been fully implemented. Our efforts over these past few years in implementing the action plan initiatives demonstrate our commitment to make sure that Canadians have all of the information they need, not only to meet their tax obligations but also to take full advantage of the tax savings to which they may be entitled.
Section III: Supplementary Information
Statement of Management Responsibility Including Internal Control Over Financial Reporting
We have prepared the accompanying financial statements of the Canada Revenue Agency according to accounting principles consistent with those applied in preparing the financial statements of the Government of Canada. Significant accounting policies are set out in note 2 to the financial statements. Some of the information included in the financial statements, such as accruals and the allowance for doubtful accounts, is based on management's best estimates and judgment, with due consideration to materiality. The Agency’s management is responsible for the integrity and objectivity of data in these financial statements. Financial information submitted to the Public Accounts of Canada and included in the Agency’s Annual Report, is consistent with these financial statements.
To fulfill its accounting and reporting responsibilities, management maintains sets of accounts which provide records of the Agency’s financial transactions. Management also maintains financial management and an effective system of internal control over financial reporting (ICFR) that take into account costs, benefits, and risks. They are designed to provide reasonable assurance that transactions are within the authorities provided by Parliament, and by others such as provinces and territories, are executed in accordance with prescribed regulations and the Financial Administration Act, and are properly recorded to maintain the accountability of funds and safeguarding of assets.
Financial management and internal control systems are reinforced by the maintenance of internal audit programs. The Agency also seeks to assure the objectivity and integrity of data in its financial statements by the careful selection, training, and development of qualified staff, by organizational arrangements that provide appropriate divisions of responsibility, by communication programs aimed at ensuring that its regulations, policies, standards, and managerial authorities are understood throughout the organization, and by conducting an annual assessment of the effectiveness of its system of ICFR. An assessment for the year ended March 31, 2011 was completed in accordance with the Policy on Internal Control and the results and action plans are summarized in the annex.
The system of ICFR is designed to mitigate risks to a reasonable level based on an on-going process to identify key risks, to assess effectiveness of associated key controls, and to make any necessary adjustments. The effectiveness and adequacy of the Agency’s financial management and its system of internal control are reviewed by the work of internal audit staff, who conduct periodic audits of different areas of the Agency’s operations and by the Board of Management which is responsible for ensuring that management fulfills its responsibilities for financial reporting and internal control and exercises this responsibility through the Audit Committee of the Board of Management. To assure objectivity and freedom from bias, these financial statements have been reviewed by the Audit Committee and approved by the Board of Management. The Audit Committee is independent of management and meets with management, the internal auditors, and the Auditor General of Canada on a regular basis. The auditors have full and free access to the Audit Committee.
The Auditor General of Canada conducts independent audits and expresses separate opinions on the accompanying financial statements which do not include an audit opinion on the annual assessment of the effectiveness of the Agency's internal controls over financial reporting.
Linda Lizotte-MacPherson
Commissioner and
Chief Executive Officer
Filipe Dinis
Chief Financial Officer and Assistant Commissioner, Finance and Administration
Ottawa, Ontario
August 30, 2011
Financial performance information – Parliamentary appropriations
Introduction
This section of the CRA Annual Report to Parliament 2010-2011 provides the details of the Agency’s resource management performance for the purpose of reporting to Parliament on the use of appropriations in 2010-2011. This complements the information provided in the spending profile sections under each Program Activity and satisfies the reporting requirements set for departmental performance reports.
Financial reporting methodologies
The CRA’s funding is provided by Parliament through annual appropriations (modified cash accounting basis) and, in this section, the CRA reports its expenditures and performance to Parliament, together with details on the management of Parliamentary appropriations on the same basis. In addition to the above reporting requirements, the CRA is also required to prepare its annual financial statements in accordance with the accounting principles applied in preparing the financial statements of the Government of Canada (full accrual accounting basis). Accordingly, the audited Statement of Operations - Agency Activities in our 2010-2011 Annual Report to Parliament includes certain items such as services received without charge from other government departments and federal agencies. A reconciliation can be found in note 3 in the same report.
The CRA is participating in a Treasury Board Secretariat (TBS) pilot project to extend accrual accounting to the budgeting and appropriations process. As required by the pilot project, CRA prepared and included future-oriented financial statements (FOFS) in the 2010-2011 Report on Plans and Priorities (RPP). This future-oriented financial information was prepared on an accrual basis to strengthen accountability and improve transparency and financial management. As part of the analysis of net cost of operations, this DPR compares actual results to the initial future-oriented financial statements contained in the 2010-2011 RPP.
CRA financial information
Activities of the Agency
|
Main Estimates Table note 24
|
|
|
Planned Spending Table note 25
|
|
|
Total Authorities Table note 26
|
|
- Table note 24
- Spending authorized by Parliament at the beginning of the fiscal year. Return to Table note 24 source text
- Table note 25
- Main Estimates authorities plus other amounts anticipated to be authorized during the fiscal year. Return to Table note 25 source text
- Table note 26
- Total spending authorized by Parliament during the fiscal year. Return to Table note 26 source text
The Financial Statements - Agency Activities reports $3,975.4 million as total Parliamentary appropriations used (note 3 in our 2010-2011 Annual Report to Parliament shows the reconciliation to the net cost of operations). The difference from the $4,418.5 million reported in this section is explained by two items reported in the Financial Statements - Administered Activities: the statutory disbursements to provinces under the Softwood Lumber Products Export Charge Act, 2006, $220.7 million; and the Children’s Special Allowance payments, $222.4 million.
Overview
For 2010-2011, Parliament approved $4,476.4 million through the Main Estimates, as shown in the CRA’s 2010-2011 Report on Plans and Priorities.
The 2010-2011 Main Estimates were adjusted to include:
- $150.3 million for the carryforward from 2009-2010;
- $82.5 million for maternity and severance payments;
- $57.8 million for the implementation of Harmonized Sales Tax for Ontario and British Columbia and the Affordable Living Tax Credit for Nova Scotia;
- $49.3 million for additional employee benefits plan costs;
- $32.4 million for various collective agreements increases;
- $18.2 million for increased Respendable Revenue mainly to provide services to the Canada Border Services Agency;
- $15.0 million for the implementation of various tax measures announced in the 2010 Federal Budget;
- $8.2 million for the Government advertising campaigns;
- $4.0 million for Court Awards and Crown Assets Disposal; and
- $2.3 million for the Financial Interoperability and Stewardship Initiative in support of the Corporate Administrative Systems.
These increases were offset by the following reductions:
- $258.3 million due to a modification to the original estimate of disbursements to provinces under the Softwood Lumber Products Export Charge Act;
- $24.3 million due to delays in proposed amendments to the Income Tax Act related to foreign investment entities and non-resident trusts;
- $14.1 million transferred to Public Works and Government Services Canada (PWGSC) to adjust charges related to accommodation and real property services;
- $2.5 million for statutory Children’s Special Allowance payments;
- $0.3 million due to a reduction in the budget for the Office of the Minister; and
- $0.2 million transferred to the Treasury Board Secretariat to support the National Managers’ Community.
This resulted in total approved authorities of $4,596.7 million for 2010-2011, representing an in-year increase of 2.7% over the Main Estimates.
Of the $4,596.7 million total authority, CRA’s actual spending totalled $4,418.5 million resulting in $178.2 million remaining unexpended at year-end. After deducting unused resources related to Government advertising campaigns, the remaining $178.0 million is available for use by the Agency in 2011-2012 under its statutory two-year spending authority. This amount represents 3.9% of the total authority.
The Agency’s two-year spending authority enables the CRA to be more strategic in its use of public funds by taking a multi-year view of plans and budgets. The financial flexibility in 2010-2011 was somewhat higher than usual due to restraint measures introduced by the CRA during the latter half of the fiscal year in response to the Operating Budget freeze implemented by the Government in Budget 2010. This increased carryforward was part of the Agency’s strategy to address unfunded operating pressures in 2011-2012, including previously approved salary increases for employees.
Revenues administered by the Agency
Total revenues administered by the CRA amount to some $311 billion in 2010-2011, an increase of 11.5% from the $279.0 billion administered in 2009-2010.
Financial highlights
There are three significant program administration changes which have influenced the results in the Financial Statements.
On July 1, 2010, the CRA successfully implemented the Harmonized Sales Tax (HST) in the provinces of Ontario and British Columbia. However, on August 26, 2011 the Province of British Columbia announced that it will return to the provincial sales tax. The transition period is expected to take a minimum of 18 months. During this period, the Agency will continue to administer the HST in British Columbia.
The CRA has received funding for 2010-2011 and subsequent years of $710 million (including employee benefit plan contributions and accommodation charges) and authority to spend $21.7 million of internal CRA funds for the continuing implementation and administration of the HST in Ontario and British Columbia. Of this amount, $91.7 million was received to cover costs in 2010-2011. Funding was used to enhance service to taxpayers, further develop capacity to identify and address the risk of HST non-compliance, transition affected provincial employees to the Agency, implement remaining IT system modifications, and administer new province-specific HST flexibilities in Ontario and British Columbia.
Program enhancements to address the increased risk of HST non-compliance and completing the necessary system changes will continue to be a priority for the Agency in 2011-2012.
The CRA established a separate Capital Expenditures Vote as of April 1, 2010, meaning the Agency’s Capital asset expenditures, with the exception of certain year-end adjustments, were funded by a distinct capital budget authority. Previously, capital amounts were included in, and funded out of, the Operating Vote Authority.
In fiscal year 201l, the Agency’s capital expenditures totalled $110.4 million. The Agency carried forward an amount of $52 million, which was a result of an overestimated capital budget requirement at the time Main Estimates were prepared due to changes in assumptions regarding the terms and conditions of procurement agreements. The unused balance of capital funding will be used to finance capital purchases in fiscal year 2012.
As outlined in the table below, the CRA continued to invest in information technology (IT) systems in order to ensure modern and efficient program delivery. The Agency had several large-scale projects that required substantial investments in the development of IT systems. Combined with the acquisition of IT hardware, the Agency invested $106 million in IT related capital assets this fiscal year. The value of these new capital assets has been offset by amortization expenses of $93.4 million in 2010-11.
Figure 2 Information Technology Investment in Capital Assets
As part of the 2010 Federal Budget, and to support its priority of restoring fiscal balance, the Government announced a freeze on the operating budgets of departments and agencies until 2012-2013. As a result, no incremental funding was provided to organizations for the costs of wage increases.
In fiscal year 2010-2011, the Agency managed these operating pressures in a decentralised manner by requiring individual budget managers to absorb them within existing budgets. The funding shortfall of approximately $13 million was primarily comprised of the economic increases associated with the Public Service Alliance of Canada (PSAC) and the Professional Institute of the Public Service of Canada (PIPSC) collective agreements, as well as salary increases for the Human Resource (HR) and Executive/ Cadre (EC) groups.
Given the magnitude of the pressures associated with non compensated wage and salary cost increases in future years, the Agency has undertaken a targeted program spending realignment review to identify potential sources of funding. The reduction in spending will primarily be achieved through general administrative and program efficiencies.
Analysis of Net Cost of Operations
The Agency’s 2010-2011 net cost of operations increased by $123 million from 2009-2010. Agency expenses totaled $4,606 million in 2010-2011 (2009-2010 - $4,441 million) (see Note 9 of the Financial Statements - Agency Activities for the breakdown of expenses by category). When adjusting for non-tax revenue of $610 million (2009-2010 - $569 million), the net cost of operations amounts to $3,995 million, as illustrated below:
|
Personnel
|
||
|---|---|---|
The Agency’s expenses are composed of 74% in personnel expenses (salaries, other allowances and benefits) and 26% in non-personnel expenses, as illustrated in the figure below.
Figure 3 Total Expenses by Type
Personnel expenses are the primary drivers for the Agency. A number of factors contributed to the net increase of $179 million for this type of expenses in 2010-2011, the most significant being the increase in the rate used to calculate severance benefits. Additional costs were also incurred for salary revisions pursuant to collective agreements provisions.
Comparison of Future-oriented Financial Information and Actual Results
The Agency’s final net cost of operations for 2010-2011 was $163 million more than was anticipated in the future-oriented financial statements included in the 2010-2011 RPP ($3,995 million - $3,832 million). This represents a 4.2% variance and is explained as follows:
-
The future-oriented financial statements were prepared based on Parliamentary appropriations received as of the 2010-2011 Main Estimates and did not consider expenditures as a result of resources received for the remainder of the year for such items as:
- Carryforward amounts from 2009-2010;
- Funding related to measures arising from the 2010 Federal Budget; and
- Implementation of the Harmonized Sales Tax (HST) in Ontario and British Columbia, the Harmonized Sales Tax Credit (HSTC) for these provinces, and the Nova Scotia Affordable Living Tax Credit (NSALTC).
- Other explanations for the variance relate to the Agency’s unused appropriations for 2010-2011 and variations in accrual adjustments mainly for asset acquisitions and the related amortization, and personnel related costs such as severance benefits.
Financial Statements
For supplementary information on the CRA’s audited financial statements and unaudited supplementary financial information, please visit:
http://www.cra-arc.gc.ca/gncy/nnnl/menu-eng.html.
List of Supplementary Information Tables
All electronic supplementary information tables found in the 2010-11 Departmental Performance Report can be found on the Treasury Board of Canada Secretariat’s website at: http://www.tbs-sct.gc.ca/dpr-rmr/2010-2011/index-eng.asp.
- Sources of Respendable and Non-Respendable Non-Tax Revenue
- User Fees Reporting
- Status Report on Projects operating with specific Treasury Board Approval
- Details on Transfer Payment Programs
- Green Procurement
- Response to Parliamentary Committees and External Audits
- Internal Audits and Evaluations
Section IV: Other Items of Interest
Board membership
The Board of Management of the CRA is made up of 15 members appointed by the Governor in Council. They include the Chair, the Commissioner and Chief Executive Officer, a director nominated by each province, one director nominated by the territories, and two directors nominated by the federal government. Members of the Board bring an external and diverse business perspective from the private, public, and not-for-profit sectors to the work of the CRA.
The following are the Board members, as of March 31, 2011. Footnote 4
Susan J. McArthur,B.A.,ICD.D
Chair, Board of Management
Managing Director
Jacob Securities Inc.
Toronto, Ontario
Camille Belliveau, CFP, FCGA
Executive Director
Groupe EPR Canada Group Inc.
Shediac, New Brunswick
Myles Bourke, B.Comm., FCA
Corporate Director
Chartered Accountant
Lethbridge, Alberta
Richard J. Daw, CFP, CMC, FCA
Executive in Residence
Faculty of Business Administration of Memorial University
St. John’s, Newfoundland and Labrador
Raymond Desrochers, B.Comm., CA, CFE
Partner
BDO Dunwoody LLP Chartered Accountants
Winnipeg, Manitoba
John V. Firth, BFA, EPC
Financial Advisor
Whitehorse, Yukon Territory
Gerard J. Fitzpatrick, FCA, TEP
Partner
Fitzpatrick and Company
Chartered Accountants
Charlottetown, Prince Edward Island
Gordon Gillis, B.A., LL.B.
Corporate Director
Dartmouth, Nova Scotia
Norman G. Halldorson, B.Comm., CA, FCA
Corporate Director
Clavet, Saskatchewan
James J. Hewitt, FCMA
Corporate Director
Penticton, British Columbia
Fauzia Lalani, P.Eng.
Field Logistics
Director - Services
Suncor Energy Services Inc.
Calgary, Alberta
James R. Nininger, B.Comm., M.B.A., Ph.D
Corporate Director
Ottawa, Ontario
Sylvie Tessier, M.B.A., P.Eng., ICD.D
Director of Professional Services
Hewlett Packard
Toronto, Ontario
Linda Lizotte-MacPherson, B.Comm.
Commissioner and Chief Executive Officer
Canada Revenue Agency
Ottawa, Ontario
Organizational Structure
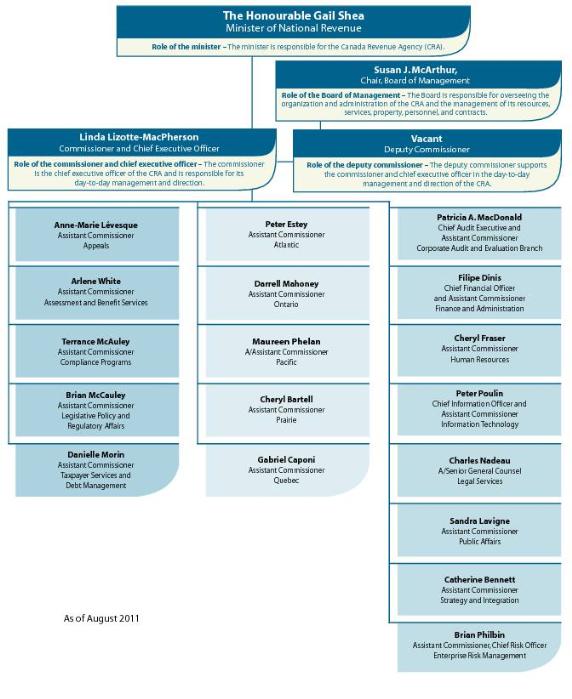
Rating our data quality
In conjunction with the performance results ratings, we also assign each indicator a data quality rating.
For each indicator, we use consistent approaches in evaluating the information derived from our data collections systems and all other sources. We rely upon CRA managers to vouch for the completeness of the records for data integrity purposes (i.e., data belongs to the same category, is collected for the same period, and by the same method). We examine data for relevance, formulas for accuracy, and other factors that must be considered. We also use comparable information from prior years for the purpose of historical comparison, which often appears in the Canada Revenue Agency Departmental Performance Report. To ensure consistency, we perform the following tasks to verify that the information reported in our numerous reports is valid, reliable, and is accompanied by appropriate evidence:
- Validation: This is a process of verification to ensure that the data meets the requirements for its intended purposes. We review and evaluate data for completeness and plausibility (accuracy, timeliness, interpretability, coherence). We also identify contact information, check calculations, confirm system reliability (verifying the source of information), and note and correct any errors.
- Data quality assessment: We apply a data quality checklist and review prior years’ data to assess the quality of data for each indicator.
- Electronic filing system: We store data in a database for easy reference and further analysis for other purposes.
- Physical filing system: We maintain physical files of the evidence collected from all sources to provide validation and assurance that our data quality ratings are accurate and supported.
We always endeavour to use the most appropriate and reliable data when evaluating our results. There are two main data sources for the Canada Revenue Agency Departmental Performance Report: administrative data (normally communicated in aggregate or after some simple calculations are performed on them) and survey data. All data sources are validated for accuracy and a data quality rating of good, reasonable, or weak, as categorized below, is applied to each indicator.
We believe that these three levels of data quality ratings provide a reasonable assessment of the reliability of the data. Generally, our data sources provide reliable information. In situations where the supporting data is too imprecise to draw firm conclusions, it is reflected in the data quality rating.
Service standards in the CRA
Maintaining the confidence of Canadians in the integrity of the tax system is essential to the success of the CRA. Service standards that are reasonable and consistently met contribute to increasing the level of confidence that Canadians place in government. Our service standards publicly state the level of performance that citizens can reasonably expect to encounter from the CRA under normal circumstances. We set targets that state the percentage of time or level of accuracy that we expect to attain for the established standard. Targets represent the percentage or
degree of improvement we expect to attain, based on operational realities such as resource availability, infrastructure, historical performance, the public's expectations, and the complexity of the work. Our standards and targets are reviewed annually and updated, as necessary.
For more information on CRA’s service standards, please visit: http://www.cra-arc.gc.ca/gncy/stndrds/menu-eng.html
Sustainable development
This past year was a transition year for the CRA in implementing our Sustainable Development (SD) National Action Plan. While we continued to focus on maintaining SD momentum, we began preparing the CRA to support Canada’s first Federal SD Strategy. During 2010-2011, we implemented numerous activities under the SD National Action Plan including increasing SD awareness, the sustainable business travel course, green procurement, energy conservation, battery recycling program implementation, SD performance reporting and the paper use reduction. The following reflects the results of these efforts:
- 97% of employees are familiar with SD as it relates to the CRA (up 8% from 2007 and exceeding the 2010 target of 95%);
- A total of 1,400 employees completed the Sustainable Business Travel course;
- Over 49% of goods purchased in Synergy were “green”;
- Energy waste was reduced by 25% in six pilot facilities;
- Battery recycling programs were expanded; and
- An updated SD Performance Reporting Tool, SD Criteria Tool, and new SD wiki space were launched.
As encouraging as these results are, average office paper use per employee increased by 4%, highlighting the need for continued efforts to meet our paper reduction commitments.
The CRA Sustainable Development Strategy 2011-2014 was developed to specify direction for future CRA SD activities.
For more information on our sustainable development performance, please visit www.cra.gc.ca/sds.
Summary of the assessment of effectiveness of the systems of internal control over financial reporting and the action plan of the Canada Revenue Agency
Fiscal year 2010-2011
Annex to the Statement of Management Responsibility Including Internal Control Over Financial Reporting.
Note to the reader
With the Treasury Board Policy on Internal Control, effective April 1, 2009, departments and agencies are now required to demonstrate the measures they are taking to maintain an effective system of internal control over financial reporting (ICFR).
As part of this policy departments are expected to conduct annual assessments of their system of ICFR, establish action plans to address any necessary adjustments, and to attach to their Statements of Management Responsibility a summary of their assessment results and action plan.
Effective systems of ICFR aim to achieve reliable financial statements and to provide assurances that:
- Transactions are appropriately authorized;
- Financial records are properly maintained;
- Assets are safeguarded from risks such as waste, abuse, loss, fraud and mismanagement; and
- Applicable laws, regulations and policies are followed.
It is important to note that the system of ICFR is not designed to eliminate all risks, rather to mitigate risk to a reasonable level with controls that are balanced with and proportionate to the risks they aim to mitigate.
The maintenance of an effective system of ICFR is an ongoing process which involves identifying key risks, assessing the effectiveness of associated key controls and adjusting them as required, as well as monitoring the system in support of continuous improvement. As a result, the scope, pace and status of departmental assessments of the effectiveness of their systems of ICFR will vary from one organization to another based on risks and taking into account their unique circumstances.
The annual assessment of ICFR contemplated in the Treasury Board (TB) Policy on Internal Control is intended to be a management self-assessment led and administered by the Chief Financial Officer and supported by senior management. However, key external audit findings and results can inform this self-assessment. In the case of the CRA, changes to Federal-Provincial Tax Collection Agreements (TCAs) that took effect starting with the 2004 tax year introduced a new audit provision requiring the Auditor General to periodically perform a review of the adequacy of CRA’s internal controls relevant to the annual financial statements provided under the TCAs, the results of which are reported to provincial and territorial finance Ministers. In fulfilment of these requirements, the Office of the Auditor General (OAG) audits, periodically, those aspects of the CRA’s self-assessment of ICFR that are relevant to the TCAs. The portion of CRA’s ICFR that is subject to audit under the TCAs and the results of the controls audits performed to date by the OAG are explained and described in Sections 3 and 4 of the Annex.
1. Introduction
This document is attached to the CRA’s Statement of Management Responsibility Including Internal Control Over Financial Reporting for the fiscal year 2010-2011. As required by the TB Policy on Internal Control, effective April 1, 2009, this document provides summary information on the measures taken by the CRA to maintain an effective system of ICFR. In particular, it provides summary information on the assessments conducted by the CRA as of March 31, 2011, including progress, results and related action plans along with some financial highlights pertinent to understanding the CRA’s unique control environment.
1.1 Authority, Mandate and Program Activities
The CRA’s mandate is based upon a framework of complex laws enacted by Parliament and by provincial and territorial legislatures. To fulfil its mandate the CRA administers a range of tax, benefits and related programs aimed at ensuring that taxpayers meet their obligations and receive their entitlements and at protecting Canada’s tax base. For more detailed information on the CRA’s authority, mandate and program activities, please refer to the Agency overview section of the Departmental Performance Report on page 60 or the CRA’s Report on Plans and Priorities http://www.tbs-sct.gc.ca/rpp/2011-2012/inst/nar/nar00-eng.asp. Information on the expenses and revenues related to the CRA’s operations and activities can also be found in the Public Accounts of Canada http://www.tpsgc-pwgsc.gc.ca/recgen/txt/72-eng.html.
1.2 Financial highlights
The CRA’s key results for fiscal-year 2010-2011 are as follows:
- Total expenses of $4,606 million, 74% of which is personnel expenses.
- Total assets and liabilities of $793 million and $1,068 million respectively. Capital assets comprise 68% of the Agency’s total assets. Employee severance benefits comprise about 59% of total liabilities and accounts payable and accrued liabilities comprise about 16%.
- Total administered revenues of about $311 billion, comprised of $191 billion in revenue administered under tax and other related federal legislation on behalf of the Government of Canada, $83 billion in revenue administered on behalf of provincial, territorial and First Nations governments under various Memoranda of Understanding and similar arrangements, and $37.2 billion in revenue administered on behalf of the Canada Pension Plan.
- Total payments of about $20.5 billion in benefits and credits administered under benefit programs and services on behalf of the Government of Canada and provincial and territorial governments.
Responsibility for delivering CRA’s mandate is shared by program branches and corporate functions located at headquarters and within regional operations across Canada including at 48 Tax Services Offices and 7 Tax Centres. The CRA’s Information Technology (IT) capacity is critical to its ability to deliver services to Canadians and involves the support of two data centres that process up to 4.5 million transactions per hour, five mainframe computers, about 1,400 servers and maintenance of over 450 national business applications across a distributed computing environment covering more than 400 locations.
The Agency’s Finance and Administration (F&A) Branch supports the delivery of CRA programs and services by providing sound advice, products, and services related to a number of key functions including financial administration, resource management, security, internal affairs, and administration. It also helps ensure compliance and accountability with related legislation, policies, and directives. F&A activities are performed by a team of almost 3,000 employees, about 30% of whom are located in headquarters and 70% of whom are located in the regions. This team is integral to the effectiveness of CRA’s system of control over financial reporting, which encompasses two sets of financial statements - one for Agency Activities and one for Administered Activities. Also of importance to financial reporting, in particular in relation to Administered Activities, are many of the procedures carried out as part of regional or headquarters operations, such as collection, data entry and processing of income tax returns, as well as a majority of the system applications in use at the CRA. This makes CRA’s task of scoping, documenting and assessing the related controls uniquely challenging.
1.3 Audited financial statements
As noted above, for financial reporting purposes, the activities of the Agency have been divided into two sets of financial statements: Agency Activities and Administered Activities. The Agency Activities financial statements include those operational revenues and expenses which are managed by the Agency and utilized in running the organization. The Administered Activities financial statements include those revenues and expenses that are administered for someone other than the Agency, such as the federal government, a province or territory, or another group or organization.
The CRA has issued annual audited financial statements since 1999-2000 and has consistently received a clean audit opinion from the Auditor General of Canada.
1.4 Service arrangements relevant to financial statements
1.4.1 CRA reliance on other government service providers:
The CRA relies on other organizations for the processing of certain transactions that are recorded in its financial statements.
- Public Works and Government Services Canada (PWGSC) centrally administers salary payments and looks after such items as calculation of general pay, payroll deductions, security over pay information, and automatic retroactive adjustments through the Regional Pay System (RPS),
- Treasury Board Secretariat (TBS) provides the CRA with information used to calculate various accruals and allowances such as the accrued severance liability,
- the Department of Justice provides legal advisory, litigation and legislative services to the CRA, and
- the Office of the Auditor General of Canada (OAG) provides auditing services to the CRA.
- The Minist�re du Revenu du Qu�bec is responsible for the joint administration of the goods and services tax (GST) and Qu�bec Sales Tax for businesses in the Province of Quebec.
1.4.2 CRA services upon which other departments and agencies rely:
- The CRA provides IT services in relation to the Canada Border Services Agency’s operational financial system.
1.5 Significant changes in fiscal-year 2010-2011
- Starting for fiscal year 2010-2011 the CRA implemented a separate Capital Vote in order to segregate its capital budget and expenditures from its operating budget and expenditures when seeking spending authority from, and reporting to, Parliament. This involved changes to systems and procedures to project, fund, code and monitor capital costs separately.
- In December 2009, the CRA decided to move the Chief Risk Officer responsibilities from the CFO and Assistant Commissioner, F&A and to create a new, independent Chief Risk Officer position reporting directly to the Commissioner. Following that decision, in June 2010, Mr. Brian Philbin was appointed to the new position and a separate branch was created to deliver the re-defined Enterprise Risk Management (ERM) function.
- Effective July 1, 2010 the Ontario and the British Columbia provincial sales tax (PST) and the federal GST were replaced by a single harmonized sales tax (HST) which is administered by the CRA. Preparing to meet the new HST business requirements involved modifying and in some cases expanding CRA business processes and IT infrastructure. On August 26, 2011 the Province of British Columbia announced that it will return to the PST provincial sales tax. The transition period is expected to take a minimum of 18 months. During this period, the Agency will continue to administer the HST in British Columbia.
- In December 2010 the CRA Board of Management approved the five new CRA policies listed below which support the CRA Policy Framework for Financial Management and Corporate Finance. Four of the five new policies flow from the TB financial management policy suite, while the Policy on Financial Administration, established further to the authority over general administrative policy granted to the CRA under the Canada Revenue Agency Act, covers financial entitlements to compensate individuals for expenses incurred while conducting CRA business (e.g., travel and hospitality).
- On December 3, 2010 Mr. Filipe Dinis, Deputy Assistant Commissioner, F&A, assumed the duties of CFO and Assistant Commissioner on an acting basis. Mr. Dinis was permanently appointed to this position on January 27, 2011.
2. CRA’s control environment relevant to ICFR
The CRA recognizes the importance of setting the tone from the top to help ensure that staff at all levels understand their roles in maintaining an effective system of ICFR and are well equipped to exercise these responsibilities effectively. The CRA’s focus is to ensure risks are managed well through a responsive and risk-based control environment that enables continuous improvement and innovation.
2.1 Key positions, roles and responsibilities
Below are the CRA’s key positions and committees with responsibilities for maintaining and reviewing the effectiveness of its system of ICFR.
Commissioner – The Commissioner and Chief Executive Officer (CEO) of the CRA, as Accounting Officer, assumes overall responsibility and leadership for the measures taken to maintain an effective system of internal control. In this role, the Commissioner chairs the Agency Management Committee, sits on the CRA Board of Management, and attends meetings of the Audit Committee.
Chief Financial Officer (CFO) – The Chief Financial Officer (CFO) reports directly to the Commissioner and provides leadership for the coordination, coherence and focus of efforts to design and maintain an effective and integrated system of ICFR, including its annual assessment. In this role the CFO chairs the CRA CEO/CFO Certification Steering Committee and attends meetings of the Audit Committee.
CEO/CFO Certification Steering Committee – The CEO/CFO Certification Steering Committee, which is chaired by the CFO and composed of Assistant Commissioners with significant responsibility for ICFR including the Chief Information Officer, the Chief Audit Executive and Assistant Commissioner, Corporate Audit and Evaluation Branch and the Chief Risk Officer, is responsible for reviewing the progress and results of CRA’s ICFR assessment process and approving action plans to address significant control issues.
Audit Committee of the Board of Management – The Audit Committee assists the Board of Management (the Board) in fulfilling its oversight responsibilities by reviewing the Agency’s accounting framework, financial and performance information, internal controls and financial risks, and compliance with financial and environmental legislation. On the recommendation of the Audit Committee, the Board approves the Agency’s annual financial statements. The Commissioner, the CFO, and the Chief Audit Executive and Assistant Commissioner, Corporate Audit and Evaluation Branch, as well as a representative of the Office of the Auditor General (OAG) each attend Audit Committee meetings. The Audit Committee was established in 1999 and is comprised of five external members all of whom are independent of the CRA.
Agency Management Committee – As the sole decision-making Committee in the Agency, the Agency Management Committee oversees program development and delivery, as well as the day-to-day business operations of the Agency and all associated risks. The Agency Management Committee reviews, approves and monitors the Corporate Risk Profile.
Chief Audit Executive – The Chief Audit Executive and Assistant Commissioner, Corporate Audit and Evaluation Branch reports directly to the Commissioner and provides, through an effective internal audit function, independent and objective assurance on the CRA’s risk management, internal control and governance practices. In this role, the Chief Audit Executive is a member of the CEO/CFO Certification Steering Committee and attends meetings of the Audit Committee.
Chief Risk Officer – The Chief Risk Officer and Assistant Commissioner of the Enterprise Risk Management Branch reports directly to the Commissioner and oversees the Agency’s ERM function designed to provide sound risk information for use in decision-making at the corporate, operational, and project levels.
Internal Controls Division – The Internal Controls Division within the F&A function supports the CRA’s efforts to design and maintain an effective and integrated system of ICFR by, in collaboration with IT and business process control owners, documenting and testing the adequacy of ICFR and reporting results to the CEO/CFO Certification Steering Committee, the Commissioner and the Audit Committee of the Board including, if applicable, information on action plans to strengthen controls.
2.2 Key measures taken by the CRA
The CRA also helps to ensure the effectiveness of its control environment in mitigating financial reporting risks by promoting ethical conduct and through its commitment to competence, its governance and organization structure, its ERM function, and its systems and processes that help ensure relevant information is communicated to appropriate individuals accurately and on a timely basis. Key elements and activities are described below.
- Building and maintaining awareness of the CRA Code of Ethics and Conduct.
- Formalizing management’s commitment to values and ethics via the performance management system.
- Providing mechanisms that help ensure appropriate action is taken in response to violations of the Code.
- a competency-based human resources management system that develops and promotes employees based on competencies identified as crucial to organizational success, including in the area of financial management,
- a formal Learning Policy that outlines specific roles and responsibilities of senior management, managers and employees in relation to employee development,
- an annual Individual Learning Plan process through which employees work with their managers to identify training opportunities for the upcoming year, linked to job requirements and competency development,
- a well established succession planning process for executive positions,
- an organizational structure and accountability regime that clearly set out reporting relationships and the assignment of authority and responsibility including for the initiation and approval of transactions,
- establishment of yearly performance agreements for executives, based on guidelines aligned with Corporate Business Plan (CBP) priorities and deliverables including in relation to financial management, and
- an independent and knowledgeable audit committee that is actively involved in overseeing the Agency’s ICFR.
- An integrated ERM function led by the Chief Risk Officer who reports directly to the Commissioner/CEO that provides the corporate view of risks to support effective decision-making and fosters a risk management culture within the Agency.
- an annual strategic planning process that links strategic initiatives and priorities to the Corporate Risk Profile,
- an annual corporate planning process which establishes, documents and communicates entity-level objectives and priorities and aligns the Agency’s activities and budget allocations with them, and
- the Resource Investment Management Committee that oversees the management and progress of major project investments including the identification, monitoring and management of internally and externally driven risks.
Information Systems and Communication
- monthly financial reports and analyses (for budget projections and for revenues and expenditures) that are reviewed and approved by senior management,
- Quarterly financial reports and analysis reviewed by the Agency Management Committee and the Board.
- a formal IT Strategy that guides IT development and maintenance, updated annually to help ensure continued support for the achievement of the strategies and priorities outlined in the CBP, including in relation to financial management,
- an annual application sustainability assessment to identify and manage application sustainability risks by setting system-by-system priorities for modernization,
- interaction between the CRA F&A Branch and TBS, Department of Finance and OAG officials to ensure that emerging accounting issues and developments are identified and suitably addressed, and
- The Internal Disclosures Office within the Corporate Audit and Evaluation Branch which provides a confidential channel through which employees can disclose wrongdoing.
- The Internal Controls Division within the F&A Branch tasked with providing those charged with governance with assurance that suitably designed ICFR are in place in the Agency and operating effectively
- Monitoring units within the F&A function, both at headquarters and at regional offices, that are responsible for monitoring transactions, both for Agency Activities (e.g., payroll) and Administered Activities (e.g., Personal (T1) income tax returns), to help ensure that risks to accurate financial reporting are suitably mitigated.
- an internal audit function that provides professional, independent and objective information, advice and assurance on the soundness of the Agency’s management framework and on the effectiveness, efficiency, and economy of the Agency’s strategies, systems, programs and practices,
- presentation of internal audit recommendations and management action plans to the Management Audit and Evaluation Committee, chaired by the CRA Commissioner and to the Audit Committee, and
- an annual follow-up process to monitor management's progress in implementing action plans responding to external and internal audit recommendations including in relation to financial reporting.
3. Assessment of CRA's system of ICFR
The CRA’s financial statements have been audited, as required under the Canada Revenue Agency Act, by the Office of the Auditor General (OAG), for eleven years. In parallel, the Audit Committee of the Board and CRA senior management have been providing increased oversight of the preparation and presentation of financial information including review of information regarding the design and adequacy of its system of ICFR with the objective of obtaining greater assurance that significant financial reporting risks are being properly mitigated.
In addition, revised federal-provincial Tax Collection Agreements (TCAs) that took effect starting with the 2004 tax year introduced new audit provisions requiring reports to be provided periodically to provincial and territorial finance Ministers on the results of Auditor General audits of the adequacy of CRA’s internal controls relevant to the annual financial statement provided under the TCAs. The OAG and CRA agreed that the new audit engagement would be according to the Canadian Institute of Chartered Accountants Handbook (CICA HB) Section 5970 standard (Auditor’s Report on Controls at a Service Organization), a new standard introduced in 2005 in recognition of the dramatic increase in outsourcing and use of service organizations including for the provision of varied and complex services.
These new reports are aimed at providing provincial and territorial governments and their auditors with independent, audit-level assurance that the controls at the CRA supporting the administration and reporting of provincial and territorial income tax revenue are properly designed to mitigate key risks and are operating effectively. The reports are intended for the specific use of provincial and territorial ministries with primary responsibility for income tax and their auditors; they are not public documents. To date CRA has issued two Section 5970 reports, both relating to the design and implementation of all key controls relating to the Corporation Income Tax Program (T2) as at a specific point in time. The third report covers the design and implementation of all key controls relating to the Personal Income Tax Program (T1) as at November 30, 2010.
The audits of ICFR that the OAG performs periodically in fulfilment of TCA requirements are a significant source of information on the state of CRA’s system of ICFR for its Administered Activities financial statements; however, they have a limited scope insofar as they only cover processes and systems involved in reporting on income tax assessed. They exclude certain of the CRA’s Administered Activities related to other revenue streams (e.g., GST, Excise Taxes and Duties) and certain significant accounts that, while not relevant to amounts payable under TCAs, are important aspects of the CRA’s financial information for Administered Activities (e.g., Accounts Receivable and the Allowance for Doubtful Accounts). As explained in subsection 3.2 below, the CRA’s approach to assessing its ICFR for Administered Activities, for purposes of the Policy on Internal Control, will encompass key control aspects falling outside TCA-related assessment and audit requirements.
3.1 Assessment baseline
The CRA’s assessment of ICFR involves first the assessment of design effectiveness to help ensure that all key controls relevant to its financial information have been properly identified, documented, and implemented and that they are aligned with the risks they aim to mitigate. Management will take action to address any areas of concern appropriately and in a timely manner. Once the CRA has verified the design effectiveness of its controls, it will assess operating effectiveness by testing the operation of controls over a defined period of time to determine whether they are working as intended. Management will take action to strengthen controls if needed. Testing of design and operating effectiveness will lead eventually to ongoing monitoring according to which the CRA’s repository of controls will be re-assessed on a multi-year, rotational basis according to risk, including consideration of any new financial reporting risks that have emerged since the last assessment.
CRA’s assessment covers the following three major categories of controls:
- Entity Level Controls: the controls and management practices across an entity that, when taken together, comprise the core organizational management control framework. Among these controls are the “tone from the top” including the organization’s culture, values and ethics, governance, transparency and accountability mechanisms as well as the activities and tools put in place across the organization to raise staff awareness, ensure clear understanding of roles and responsibilities and solid capacities and abilities in managing risks well. These controls constitute a critical component of an organization's system of internal control as they have a pervasive effect on the organization and can have significant consequences for the overall assessment of the effectiveness of ICFR.
- IT General Controls: the umbrella controls over the computer environments that support relevant business processes and related applications. Given how data moves between multiple business groups and IT systems on its way from initial transactions to the financial reports it is important that management obtains assurance regarding the processes and controls over the IT systems and databases that house, move, and transform this data. Key controls in specific IT applications that support financial data and transactions are typically addressed at the business process level.
- Business Process Controls: the controls that help mitigate the financial reporting risks associated with relevant procedures that take place in the organization's business units. Management must identify the business units and business processes (manual and automated) that handle transactions that impact significant accounts and related assertions, identify the risks that could reasonably result in a material misstatement and evaluate the adequacy of the controls, policies, procedures and validities that are in place to mitigate each of the identified risks.
3.2 Scope of CRA assessment as of March 31, 2011
In order to define the scope of its ICFR assessment, the CRA examined the main accounts and line items used in the preparation of its two sets of financial statements to determine where there are risks that, individually or in combination with others, could reasonably result in a material misstatement (financial reporting risks). Items at a higher risk were then mapped to the related business processes which were in turn risk rated and used to determine the key applications and systems to be included in the scope of the assessment.
Based on this analysis, the CRA determined the scope of its assessment to include controls related to financial reporting within the following business processes:
Agency Activities Financial Statements:
Administered Activities Financial Statements Footnote 5:
The CRA uses the Committee of Sponsoring Organizations (COSO) framework to assess the design effectiveness of its system of internal controls, since it is the most widely used and recognized model of control for purposes of assessing ICFR. The COSO framework is based upon five interrelated components of control, each of which contains a number of principles and attributes against which an organization’s ICFR may be assessed: Control Environment, Risk Assessment, Control Activities, Information Systems and Communication, and Monitoring.
Because COSO only provides limited guidance to assist organizations in establishing and evaluating IT controls, the CRA uses the COBIT (Control Objectives for Information and related Technology) for SOX (Sarbanes-Oxley Act of 2002) Footnote 6 framework to document and assess the design of its IT controls of relevance to financial reporting. COBIT for SOX identifies three control areas for review when assessing the adequacy of controls over the key applications and systems involved in the organization's financial reporting:
4. Progress and Assessment Results as of March 31, 2011
This section summarizes the CRA’s key assessment results from the design and operating effectiveness testing completed to date.
4.1 Design effectiveness of key controls
Agency Activities Financial Reporting
In 2010-2011, the CRA completed an assessment of the design effectiveness of its key controls related to financial reporting on Agency Activities. This review included key controls over the five business processes in scope (Payroll, Fixed Assets, Operating Expenditures, Budgeting and Projections, and Financial Close and Reporting) as well as relevant application controls and IT general controls, including for:
- The Corporate Administrative System (CAS), the CRA’s SAP-based Enterprise Resource Planning system which is the financial system of record at the CRA.
- Synergy (Ariba), the Agency’s e-procurement tool used to manage the purchasing life cycle.
- The Budget Tracking System designed to manage the Agency’s financial resources from an internal (budgeting) and central agency (Estimates) perspective.
Based on this review CRA management determined that a number of its controls related to access management, segregation of duties and certain review and monitoring activities could be improved and established action plans to make the necessary adjustments. As a lessons learned exercise, the CRA also performed selected operating effectiveness testing of controls over Agency Activities financial reporting. The CRA is using the results of this work to plan and perform more comprehensive testing in order to evaluate the operating effectiveness of these controls for the 2011-2012 period.
Administered Activities Financial Reporting
In 2010-2011, the CRA self-assessed the design effectiveness of certain of its business process controls over financial reporting on the Personal Income Tax Program (T1 Program) and of the application controls and IT general controls related to the key information systems involved in processing T1 transactions. Close to 60 information systems were reviewed in total. The Agency used the results to prepare a description of the design of these controls as at November 30, 2010 which was then submitted to the OAG for audit as per TCA requirements.
Based on the T1 self-assessment and OAG audit, CRA management determined that improvements are needed to the design of certain of its controls involved in the processing of non-routine assessments and reassessments, the management of systems changes and in relation to management of user access and proper segregation of duties.
In 2008, the CRA self-assessed the design effectiveness of certain of its business process controls over the Corporation Income Tax Program (T2 Program) and of the application controls and IT general controls related to the key information systems involved in processing T2 transactions. The Agency used the results to prepare a description of the design of these controls as at November 30, 2008 which the OAG audited in 2009, as per TCA requirements. In response to the findings of the self-assessment and OAG audit, CRA management took steps to improve controls over management of legislative and systems changes and over management of privileged user access as well as to strengthen procedures for managers' semi-annual review of employee access privileges and for facilitating proper segregation of duties.
In 2011-2012, the CRA plans to self-assess the operating effectiveness of these T2 controls, document the results, and, further to the TCA audit provisions, engage the OAG to perform an audit in order to provide an independent opinion on the operating effectiveness of these controls over a six-month period.
4.2 Operating effectiveness of key controls
From February to September 2009 F&A led an exercise to assess the operating effectiveness of the CRA’s entity level controls (ELCs) relevant to both the Agency Activities financial statements and the Administered Activities financial statements. Key activities included:
- interviews with CRA senior officials to understand and identify and corroborate the key ELC;
- documentation of key ELCs using the COSO control framework as a starting reference and customizing the framework as needed to reflect the Agency’s environment; and,
- review of supporting documentation and a sample of processes to substantiate and demonstrate the design effectiveness and, where applicable, the operating effectiveness of the controls.
This initial assessment indicated that the CRA has a strong system of controls at the entity level, that most of these controls are operating effectively and that all relevant control objectives within the COSO framework are being achieved. While several potential opportunities for improvement were observed and were discussed by management there were no significant gaps identified.
In 2010-2011 F&A conducted a risk-based assessment of the operating effectiveness of these controls both for purposes of the OAG’s audit of the design of CRA’s controls over financial reporting on the T1 program under the TCAs and for purposes of the Statement of Management Responsibility including ICFR for the 2010-2011 financial statements. This assessment revealed that the CRA continues to have a strong system of ELCs.
5. CRA’s Action Plan
This section summarizes how CRA is addressing the results of 2010-2011 control assessment activities and its plans for completing the assessment of the design and operating effectiveness of its system of internal control.
5.1 Progress as of March 31, 2011
Agency Activities Financial Reporting
In 2010-2011, in response to the results of the design effectiveness and the selected operating effectiveness testing performed, CRA management identified and partially completed a number of corrective measures to strengthen controls over Agency Activities financial reporting. These measures include greater restriction or segregation of access to perform certain transactions, introduction of new directives to clarify and reinforce responsibilities and accountability for role definition and management, and improved documentation of review and monitoring activities for audit trail purposes.
Administered Activities Financial Reporting
In 2010-2011 the CRA mostly completed its plans to strengthen controls over management of legislative and systems changes and over access management in response to the findings of the OAG’s 2009 audit of the design of T2 controls relevant to TCAs. In addition, the CRA made substantial progress in developing action plans in response to preliminary findings from the 2011 OAG audit of the design of T1 controls relevant to TCAs. These preliminary findings indicated the need to strengthen certain of the controls involved in the processing of non-routine assessments and reassessments, the management of systems changes and access management.
5.2 Action plan for the next fiscal year and subsequent years
The CRA’s assessment efforts to date have revealed that the CRA has a strong and effective system of ELCs that constitutes an important component of the Agency’s ICFR for both Agency Activities and Administered Activities. Because maintaining public trust is crucial to the fulfilment of its mandate, in 2011-2012 the CRA will continue with the implementation of its new Integrity Framework, comprised of policy instruments, programs, and processes designed to reinforce a culture of integrity by more systematically engaging management and staff in preventing, monitoring, detecting and managing breaches that put employees, assets, information and revenues at risk. Given the significance of ELCs for the overall assessment of the effectiveness of ICFR, the CRA will continue to monitor them annually based on risk to obtain assurance regarding their continued effectiveness.
Agency Activities Financial Reporting
The CRA’s plan for 2011-2012 is to substantially complete action plans to strengthen the design of controls where required and to complete the assessment of the operating effectiveness of all key ICFR for Agency Activities. Once it is confirmed that these ICFR are operating effectively, the CRA plans to move to an annual monitoring program to track and test changes to these controls and to perform other testing on a selective basis according to risk. This approach will allow the CRA to focus efforts on areas requiring re-testing based on feedback from business and IT control owners regarding changes that have occurred during the period and on higher risk areas.
Administered Activities Financial Reporting
In 2011-2012 the CRA plans to substantially complete action plans developed to address issues from the 2009 OAG audit related to design effectiveness of controls over the T2 program and the 2011 audit related to the design effectiveness of controls over the T1 program.
The CRA plans to build on the progress achieved in documenting and assessing the design effectiveness of its controls over both T1 and T2 financial reporting in support of TCA audit requirements, by completing assessments of the operating effectiveness of these controls starting with the T2 program in 2011-2012. As noted above, the CRA plans to engage the OAG to conduct an audit of the operating effectiveness of T2 controls over a six-month period. The OAG’s report will be in accordance with the new Canadian Standard on Assurance Engagements (CSAE) 3416, which has replaced the CICA HB Section 5970 standard and is effective starting with reporting periods ending in 2011.
The approach and timing for assessing the operating effectiveness of controls over the T1 Program as well as for assessing both the design and operating effectiveness of the ICFR for the remainder of the CRA’s Administered Activities including IT general controls and application level IT controls will depend on a number of factors including:
- plans currently under development to re-design the business processes and systems related to the T1 Program,
- significant shifts in the Agency’s program delivery agenda (e.g., if the CRA assumes responsibility for the implementation and administration of new federal, provincial, territorial or First Nations tax, benefit or credit programs),
- reductions to the Agency’s approved program spending levels due to Strategic and Operating Review or other government-wide restraint measures, or
- other developments that exert significant pressure on program and IT staff’s time and capacity.
In 2011-2012 CRA management will evaluate the level of effort involved in completing the assessment of the operating effectiveness of its system of internal control and will establish a suitable timeline. This timeline will be examined at a minimum annually in order to confirm the feasibility of the key deliverables and to take into account new information on financial reporting risks.
The table below provides an overview of CRA’s plans for completing its assessment and moving to a program of ongoing monitoring.
|
Planned 2013-2014 Table note 27
|
||||
|
T1 Personal Income Tax ICFR relevant to TCAs Table note 28
|
As per 2011-2012 analysis Table note 29
|
As per 2011-2012 analysis Table note 29
|
||
|
T2 Corporation Income Tax ICFR relevant to TCAs Table note 28
|
As per 2011-2012 analysis Table note 29
|
|||
|
As per 2011-2012 analysis Table note 29
|
||||
|
T3 Trust Income Tax Table note 28
|
||||
- Table note 27
- Timing for the on-going monitoring of ICFR for Agency Activities depends on the results of the 2011-2012 operating effectiveness assessment and any action plans established in response to these results. Return to Table note 27 source text
- Table note 28
- ICFR related to tax assessed are audited by the Office of the Auditor General in fulfilment of audit requirements in federal-provincial Tax Collection Agreements (TCAs); ICFR related to tax accruals and cash receipts are not subject to OAG audit. Return to Table note 28 source text
- Table note 29
- In 2011-2012 F&A, in consultation with management responsible for relevant business processes and with management in the Information Technology Branch as well as with input from external stakeholders such as provincial and territorial revenue ministry officials and the Office of the Auditor General, will analyse and prioritize the work required to complete the assessment of the operating effectiveness of all key ICFR for the CRA’s Administered Activities and will establish a plan for 2012-2013 and beyond to complete this work. Certain variables, including the factors listed and described above, may impact the CRA's ability to complete this work as planned and necessitate adjustments to timelines. Return to Table note 29 source text
- Footnote 1
- On August 26, 2011 the province of British Columbia announced that it will return to the provincial sales tax. The transition period is expected to take a minimum of 18 months. During this period, the CRA will continue to administer the HST in British Columbia. Return to Footnote 1 source text
- Footnote 2
- On August 26, 2011 the province of British Columbia announced that it will return to the provincial sales tax. The transition period is expected to take a minimum of 18 months. During this process, the CRA will continue to administer the HST in British Columbia. Return to Footnote 2 source text
- Footnote 3
- On August 26, 2011 the Province of British Columbia announced that it will return to the provincial sales tax. The transition period is expected to take a minimum of 18 months. During this period, the CRA will continue to administer the HST in British Columbia. Return to Footnote 3 source text
- Footnote 4
- As of March 31, 2011, one position on the Board was vacant. Return to Footnote 4 source text
- Footnote 5
- For purposes of assessing controls over the Administered Activities Financial Statements the CRA is only covering those processes associated with generating high and medium risk rated financial balances. Return to Footnote 5 source text
- Footnote 6
- Because most financial reporting processes are now driven by IT systems, ISACA (Information Systems Audit and Control Association) and its research affiliate, the IT Governance Institute (ITGI), developed COBIT for SOX to provide guidance on the design and evaluation of IT controls for the purposes of financial reporting objectives and ICFR. Return to Footnote 6 source text