
Treasury Board of Canada Secretariat
www.tbs-sct.gc.ca
Common menu bar links
Breadcrumb Trail
ARCHIVED - Department of Justice Canada - Report
 This page has been archived.
Archived Content
Information identified as archived on the Web is for reference, research or recordkeeping purposes. It has not been altered or updated after the date of archiving. Web pages that are archived on the Web are not subject to the Government of Canada Web Standards. As per the Communications Policy of the Government of Canada, you can request alternate formats on the "Contact Us" page.
Section III: Supplementary Information
Financial Highlights
| % Change | 2010-11 | 2009-10 | |
|---|---|---|---|
| Total assets | -2.3% | 492,892 | 504,433 |
| Total liabilities | -2.4% | 571,634 | 585,355 |
| Equity of Canada | -2.8% | (78,742) | (80,922) |
| Total | -2.3% | 492,892 | 504,433 |
| % Change | 2010-11 | 2009-10 | |
|---|---|---|---|
| Total expenses | 4.8% | 1,126,995 | 1,075,361 |
| Total revenues | 24.6% | 337,646 | 270,948 |
| Net cost of operations | -1.9% | 789,349 | 804,413 |
Financial Highlights Charts/Graphs
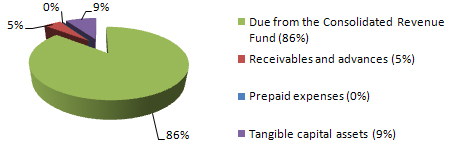
Total assets were approximately $493M at the end of 2010-11, a 2.3% decrease from the previous year’s total. This is mainly due to a decrease in the Consolidated Revenue Fund of 4.6%. The Consolidated Revenue Fund represents 86% of total assets, at approximately $424M. Tangible capital assets represented approximately $44M or 9% of total assets, while receivables and advances represented approximately $24M or 5% of total assets.
Assets by type
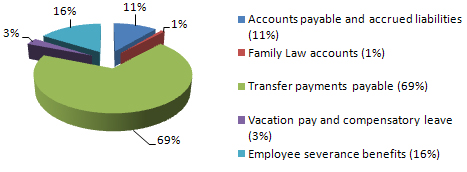
Total liabilities were $572M at the end of 2010-11, a 2.3% decrease from the previous year’s total. Transfer payments payable represents the largest portion of liabilities at $392M or 69% of total liabilities, a 1.9% decrease over the previous year.
Liabilities of type
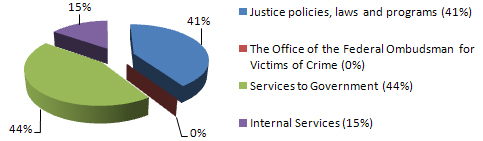
Total expenses for the Department were $1,127M in 2010-11, a 4.8% increase from the previous year's total. Of this amount, $497.4M or 44% of funds was spent on “services to government,” while “Justice policies, laws and programs” represented $459.1M or 41% of total expenses. The increase of 8.9% for “services to government” represents the largest increase over the previous year.
Expenses by Program Activity
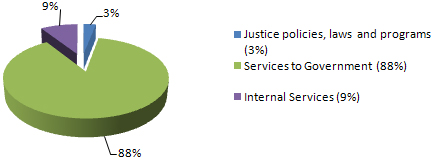
The Department’s total revenues amounted to approximately $337.6M for 2010-11, a 24.6% increase from 2009-10. Eighty-eight percent of departmental revenue was derived from services to government, a 23.9% increase over previous year.
Revenues by Program Activity
Financial Statements
The Department’s financial statements are available on the Justice Web site at: http://canada.justice.gc.ca/eng/dept-min/pub/dpr-rr/index.html.
List of Supplementary Information Tables
The following supplementary information tables can be found on the Treasury Board of Canada Secretariat’s Web site at: http://www.tbs-sct.gc.ca/dpr-rmr/2010-2011/index-eng.asp.
- Details on Transfer Payment Programs
- Green Procurement
- Horizontal Initiatives
- Internal Audits and Evaluations
- Response to Parliamentary Committees and External Audits
- Sources of Respendable and Non-Respendable Revenue
- User Fees Reporting
Section IV: Other Items of Interest
Key Publications
The following information is available on the Justice Web site:
Canada’s System of Justice:
http://canada.justice.gc.ca/eng/dept-min/pub/just/
Canada’s Consolidated Statutes and Regulations:
http://laws.justice.gc.ca/en/index.html
Department of Justice Organizational Chart:
http://canada.justice.gc.ca/eng/dept-min/chart.html
Department of Justice Programs and Initiatives:
http://canada.justice.gc.ca/eng/pi/index.html
Key Publications:
http://canada.justice.gc.ca/eng/dept-min/pub/index.asp
Careers at Justice:
http://canada.justice.gc.ca/eng/dept-min/recru/index.html
Organizational Contact Information
Public Inquiries:
Communications Branch
Telephone: 613-957-4222
TDD/TTY: 613-992-4556
Fax: 613-954-0811
Media Inquiries:
Communications Branch
Telephone: 613-957-4207
Fax: 613-954-0811
1 The Ombudsman’s Office is included within the Department of Justice Program Activity Architecture because resources for the Office are transferred from the Justice appropriation. However, while the Deputy Head of the Ombudsman’s Office reports directly to the Minister of Justice, he or she exercises delegated authorities that are separate from those of the Deputy Minister of Justice. Since the Office is not part of the Department of Justice Canada governance framework, it is therefore not part of the Department’s Performance Measurement Framework.
2 Type is defined as follows: Previously committed to – committed to in the first or second fiscal year before the subject year of the report; Ongoing – committed to at least three fiscal years before the subject year of the report; and New – newly committed to in the reporting year of the Departmental Performance Report.
3 The acronyms LA-01, LA-2A and LA-2B refer to different classification levels inside the Law Group, LA-01 being the first classification level.
4 Total Authorities include Net Vote Authority of $290.0M, which allows the Department to recover from other government departments and agencies some of the costs incurred to deliver legal services. The total amount recovered is $288.2M, which is included in Actual Spending.
5 Public Support for Legal Aid and Public Confidence in the Criminal Justice System (2011) and National Justice Survey: Mental Health Disorders in the Criminal Justice System (2009). These percentages are representative of the Canadian population within +/-2.5% (19 times out of 20). Due to a change in methodology, the percentages reported here are lower than percentages reported in the 2009-10 Departmental Performance Report. The change reflects a correction in the interpretation of the results based on a 10-point scale; where previously, a rating between 4 and 10 was interpreted as indicating confidence, a rating between 6 and 10 is now needed.
6 World Competitiveness Survey 2011 Yearbook, Survey Question within Government Efficiency - Societal Framework: “Justice is fairly administered.” Canada achieved an overall score of 8.41 on an index of 0-10.
7 The identification of numerical targets is not possible for this indicator as the Minister’s legislative agenda is largely driven by parliamentary business.
8 No target was established in the Report on Plans and Priorities for this indicator, therefore it is impossible to assess how it was met.
9 The six bills that received Royal Assent were Bill S-6, Serious Time for the Most Serious Crime Act; Bill S-9, Tackling Auto Theft and Property Crime Act; Bill C-21, Standing up for Victims of White Collar Crime Act; Bill C-22, Protecting Children from Online Sexual Exploitation Act; Bill C-30, Response to the Supreme Court of Canada Decision in R. v. Shoker Act; and Bill C-48, Protecting Canadians by Ending Sentence Discounts for Multiple Murders Act. The nine other bills that died on the Order Paper at the dissolution of Parliament on March 26, 2011 were Bill C-4, S�bastien’s Law (Protecting the Public from Violent Young Offenders); Bill C-16, Ending House Arrest for Property and Other Serious Crimes by Serious and Violent Offenders Act; Bill C-17, Combating Terrorism Act; Bill S-10, Penalties for Organized Drug Crime Act; Bill C-50, Improving Access to Investigative Tools for Serious Crimes Act; Bill C-51, Investigative Powers for the 21st Century Act; Bill C-53, Fair and Efficient Criminal Trials Act; Bill C-54, Protecting Children from Sexual Predators Act; and Bill C-60, Citizen’s Arrest and Self-defence Act.
10 Commencing in the 2009-10 Estimates cycle, the figure for resources for Program Activity C1- Internal Services is displayed separately from other program activities, since they are no longer distributed among the remaining program activities, as was the case in previous Main Estimates. This has affected the comparability of spending and FTE information by program activity between fiscal years.
11 Actual Spending by Program Activity was realigned after the submission of the 2010-11 Public Accounts.
12 These interim results reflect feedback received from the nine client departments surveyed in 2010-11. The complete results of the survey will be available in 2012.
13 Service standards are available at http://www.justice.gc.ca/eng/dept-min/service.html.
14 These results are further discussed under the Lessons Learned for Program Activity B1 - Services to Government.
15 Planned Spending excludes anticipated legal services costs of $265M for the provision of legal services to other government departments and agencies.
16 Total Authorities include Net Vote Authority of $262.9M.
17 Actual Spending by Program Activity was realigned after the submission of the 2010-11 Public Accounts.
18 A portion of the Net Vote Authority was allocated to Internal Services during fiscal year 2010-11 which is not included in the Planned Spending.
19 Total Authorities include Net Vote Authority of $27.1M.
20 Actual Spending is higher than Total Authorities due to the misalignment of the Net Vote Authority between the two Program Activities, Services to Government and Internal Services and also internal reallocations to support Department-wide investments and projects.
21 Actual Spending by Program Activity was realigned after the submission of the 2010-11 Public Accounts.
22 Actual Spending by Program Activity was realigned after the submission of the 2010-11 Public Accounts.
23 Targets are not available as none were identified in the Report on Plans on Priorities. Revised expected results and performance indicators will be available in the 2012-13 Report on Plans and Priorities and corresponding targets will be included.
24 As targets are not available, it is impossible to assess how these were met. The performance status therefore summarizes results achieved during the reporting period and/or year-over-year changes based on the most recent data available.
25 Estimated total criminal justice spending comprises: (1) Police expenditures – estimated using the proportion of total time spent by police on crime-related activities (65%) and includes salaries, benefits, and other operating expenses such as accommodation costs, fuel, and maintenance; capital expenditures, funding from external sources, revenues, and recoveries are not included; (2) Court expenditures – estimated, as no current data are available; most recent official information on court expenditure was collected in 2002-03; (3) Prosecution expenditures – estimated, as no current data are available; most recent official information on court expenditure was collected in 2002-03; (4) Legal aid expenditures – estimated for criminal matters only as, with the exception of the direct legal services expenditure, there is no breakdown between criminal matters and civil matters for central administration and other costs; (5) Corrections expenditures – both operating and capital expenditures are included. Provincial capital expenditures are estimated using the proportion that federal capital costs represent relative to federal operating expenditures. In addition, as there is no cost information available for youth corrections in Canada, these costs are estimated based on the information that youth correction costs are approximately 25% of the adult correction costs, according to a 1997 report by Statistics Canada.
26 Statistics Canada, Canadian Centre for Justice Statistics (CCJS), Police Resources in Canada, 2010; Statistics Canada, CCJS, Overview of the Courts Personnel and Expenditures Survey, 2002-03; Statistics Canada, CCJS, Overview of the Prosecution Personnel and Expenditures Survey, 2002-03; Statistics Canada, CCJS, Legal Aid in Canada: Resource and Caseload Statistics, 2009-10; Statistics Canada, CCJS, Adult Correctional Services in Canada, 2007-2008 reference table; Statistics Canada, CCJS, Justice Spending in Canada, 1997.
27 Statistics Canada, CCJS, Adult Criminal Court Survey (2011).
28 Statistics Canada, Police-reported crime statistics in Canada, 2010 (http://www.statcan.gc.ca/pub/85-002-x/2011001/article/11523-eng.pdf)
29 Ibid.
30 According to Police-reported crime statistics in Canada, 2010: "In contrast to most types of crime, increases were reported in the rates of child pornography offences (+36%), firearm offences (+11%), criminal harassment (+5%), and sexual assault (+5%). Drug offences also increased in 2010 (+10%), driven primarily by a higher number of cannabis offences. The overall increase continues the upward trend that began in the early 1990s." (http://www.statcan.gc.ca/pub/85-002-x/2011001/article/11523-eng.pdf)
31 Statistics Canada, CCJS, Adult Criminal Court Survey (2011).
32 Ibid.
33 A trend cannot be established because fluctuations in the volume of criminal incidents year after year render comparisons inappropriate.
34 Statistics Canada, CCJS, Uniform Crime Reporting Survey (2011).
35 Statistics Canada, Criminal Victimization in Canada, 2009 (Most recent available data are based on the 2009 General Social Survey. The survey is conducted every five years).
36 2009 General Social Survey.
37 Public Support for Legal Aid and Public Confidence in the Criminal Justice System (2011) and National Justice Survey: Mental Health Disorders in the Criminal Justice System (2009). Due to a change in methodology, the percentages reported here are lower than percentages reported in the 2009-10 Departmental Performance Report. The change reflects a correction in the interpretation of the results based on a 10-point scale that was used in the study to determine confidence levels. Where a rate of 4 and above was previously interpreted as “attesting confidence”, a rate of 6 and above has now replaced it.
38 Department of Justice File Review
39 Ibid.
40 Survey on Public Support for Legal aid and Public Confidence in the Criminal Justice System (2011)
41 Department of Justice File Review and Survey of Provincial and Territorial Partners
42 Ibid.
43 Department of Justice Grants and Contributions Information Management System
44 Ibid.
45 http://www.justice.gc.ca/eng/pi/pb-dgp/arr-ente/yjsfp-pfsjj.html
46 http://www.justice.gc.ca/eng/pi/eval/rep-rap/11/fvs-sfv/index.html
47 Public Support for Legal Aid and Public Confidence in the Criminal Justice System (2011) and National Justice Survey: Mental Health Disorders in the Criminal Justice System (2009). These percentages are representative of the Canadian population within +/-2.5% (19 times out of 20).
48 Statistics Canada, CCJS, Survey of Maintenance Enforcement Programs
49 http://www.justice.gc.ca/eng/news-nouv/nr-cp/2010/doc_32560.html
50 Actual Spending by Program Activity was realigned after the submission of the 2010-11 Public Accounts.
51 Planned Spending excludes anticipated legal services costs of $265M for the provision of legal services to other government departments and agencies.
52 Actual Spending by Program Activity was realigned after the submission of the 2010-11 Public Accounts.
53 Targets are not available as none were identified in the Report on Plans on Priorities. Revised expected results and performance indicators will be available in the 2012-13 Report on Plans and Priorities and corresponding targets will be included.
54 As targets are not available, it is impossible to assess how these were met. The performance status therefore summarizes results achieved during the reporting period and/or year-over-year changes based on the most recent data available.
55 Due to changes in the methodology used by the Department to classify files by levels of risk, comparison with previous years is not possible. Therefore, no trend can be identified.
56 The number of publications reported last year (126) was found to be incorrect.
57 These percentages were calculated on the total number of files and hours for which a level of risk was assessed.
58 Formerly Indian and Northern Affairs Canada.
59 The Former Bills C-23, Eliminating Pardons for Serious Crimes Act, C-39, the Ending Early Release for Criminals and Increasing Offender Accountability Act, and C-59, the Abolition of Early Parole Act.
60 More information about the Brown Task Force on Governance and Cultural Change in the RCMP is available at http://www.publicsafety.gc.ca/rcmp-grc/rcmp-tfr-eng.aspx.
61 The Former Bill C-49, Preventing Human Smugglers from Abusing Canada's Immigration System Act.
62 Actual Spending is higher than Total Authorities due to the misalignment of the Net Vote Authority between the two Program Activities, Services to Government and Internal Services and also internal reallocations to support department-wide investments and projects.
63 Actual Spending by Program Activity was realigned after the submission of the 2010-11 Public Accounts.