
Common menu bar links
Breadcrumb Trail
ARCHIVED - Canada Border Services Agency - Report
 This page has been archived.
Archived Content
Information identified as archived on the Web is for reference, research or recordkeeping purposes. It has not been altered or updated after the date of archiving. Web pages that are archived on the Web are not subject to the Government of Canada Web Standards. As per the Communications Policy of the Government of Canada, you can request alternate formats on the "Contact Us" page.
Section III: Supplementary Information
Financial Highlights
For financial reporting purposes, the activities of the Agency have been divided into two sets of financial statements: Agency Activities and Administered Activities. The financial statements for Agency Activities include those operational revenues and expenses that are managed by the Agency and utilized in running the organization. The financial statements for Administered Activities include those revenues and expenses that are administered for entities other than the Agency (e.g. the federal government, a province or territory, or another group or organization). The purpose of this distinction is to more accurately represent the actual cost of Agency operations from those revenues that are administered on behalf of the Government of Canada.
Comparative figures have been reclassified to conform to the current year's presentation. The 2009–10 amounts for the Agency Activity financial statements have been restated as the Agency adopted retroactively for the revised Treasury Board Accounting Standard (TBAS) 1.2: Departmental and Agency Financial Statements, which is effective for the Agency for the 2010 11 fiscal year. The major change in the accounting policies of the Agency Activities required by the adoption of the revised TBAS 1.2 is the recording of amounts due from Consolidated Revenue Fund as an asset on the Statement of Financial Position. The 2009–10 amounts have been restated for comparative purposes. The financial statements for Administered Activities have also been restated due to unrecorded revenues from prior years which warranted a retroactive entry.
Agency Activities
| Percent Change % | 2010–11 | 2009–10 | |
|---|---|---|---|
| Financial assets | -17.5 | 92,523 | 112,185 |
| Non-financial assets | 9.9 | 461,256 | 419,727 |
| Total assets | 4.1 | 553,779 | 531,912 |
| Total liabilities | -1.1 | 411,691 | 416,125 |
| Total equity | 22.7 | 142,088 | 115,787 |
| Total liabilities and equity | 4.1 | 553,779 | 531,912 |
| Percent Change % | 2010–11 | 2009–10 | |
|---|---|---|---|
| Total expenses | 2.0 | 1,844,007 | 1,808,618 |
| Total revenues | -24.3 | 19,603 | 25,894 |
| Net results | 2.3 | 1,824,404 | 1,782,724 |
Administered Activities
| |
Percent Change % | 2010–11 | 2009–10 (Restated) |
|---|---|---|---|
| Total administered assets | -35.0 | 3,084,691 | 4,744,427 |
| Total administered liabilities | 159.8 | 211,929 | 81,561 |
| Net amount due to the Consolidated Revenue Fund (CRF) on behalf of the Government of Canada | -38.4 | 2,872,762 | 4,662,866 |
| Total administered liabilities and net amount due to the CRF on behalf of the Government of Canada | -35.0 | 3,084,691 | 4,744,427 |
| Percent Change % | 2010–11 | 2009–10 (Restated) |
|
|---|---|---|---|
| Total tax revenues | 10.0 | 23,199,697 | 21,068,273 |
| Total non-tax revenues | -54.2 | 16,975 | 37,054 |
| Less: bad debts | -137.0 | -10,049 | 27,146 |
| Net results | 10.0 | 23,226,721 | 21,078,181 |
Financial Highlights Charts – Agency Activities
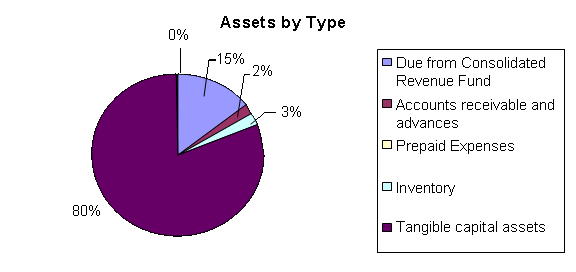
As per the Agency Activity financial statements, total assets were $554 million at the end of 2010–11, an increase of $22 million (4.1 percent) over the total assets of $532 million for 2009‑10. Financial Assets (due from Consolidated Revenue Fund, and accounts receivable and advances) have decreased by $20 million (17 percent) mainly due to a decrease in Employee Benefit Play payable at year end. Non-financial assets (prepaid expenses, inventory, and tangible capital assets) represent the largest portion at $461 million (83 percent) of total assets.
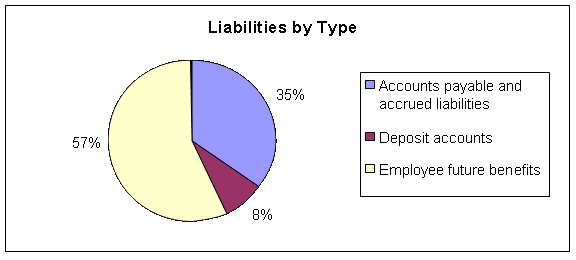
Agency total liabilities were $412 million at the end of the 2010–11, a decrease of $4 million (1 percent) over the total liabilities of $416 million for 2009–10. Employee future benefits represent the largest portion of liabilities at $236 million (57 percent) of total liabilities.

Agency Activity total expenses were $1.844 billion for 2010–11, an increase of $35 million (2.0 percent) over the total expenses of $1.809 billion for 2009–10. The majority of the funds, $1.343 billion (73 percent), were spent on salaries and employee benefits.
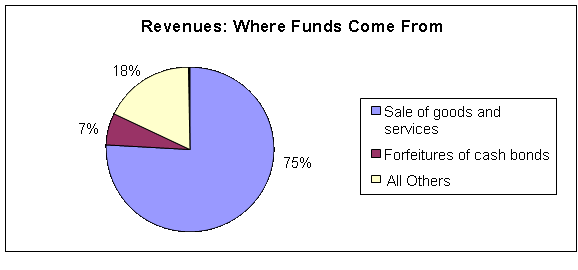
Revenues reported within the Agency Activity financial statements were $20 million for 2010–11, a decrease of $6 million (24 percent) over the total revenues of $26 million for 2009–10. This decrease is mainly due to the combination of provincial sales tax and goods and services tax in British Columbia and Ontario. Most of the revenues, $15 million (75 percent) were generated from the sale of goods and services.
Financial Highlights Charts – Administered Activities
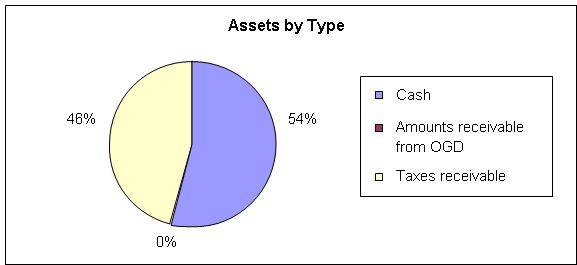
The CBSA's administered assets were $3,084 million at the end of 2010–11, a decrease of $1,660 million (35 percent) over the total assets of $4,744 million for 2009–10. This is due to the elimination of a large goods and services tax/harmonized sales tax receivable from the Canada Revenue Agency in 2010–11. Cash and taxes receivable represent the largest portion at $3,079 million (greater than 99 percent) of the CBSA's administered assets.
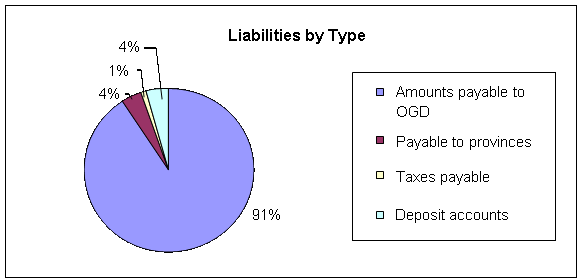
Administered by total liabilities were $212 million at the end of 2010–11, an increase of $130 million (160 percent) over the total liabilities of $82 million for 2009–10. This is a result of an increase in harmonized sales tax payable to the Canada Revenue Agency as a result of the implementation of the harmonized sales tax in Ontario and British Columbia in July 2010. Amounts payable to other federal government departments and agencies represents the largest portion of liabilities at $192 million (91 percent) of total liabilities.
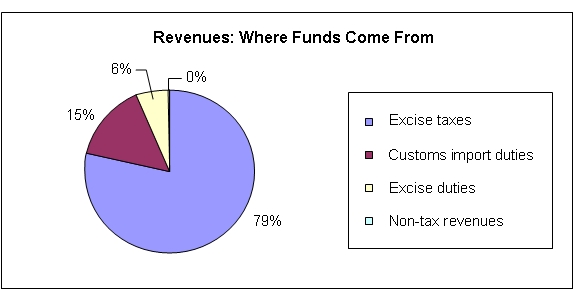
The CBSA's total administered revenues were $23,217 million for 2010–11, an increase of $2,111 million (10 percent) over the total revenues of $21,105 million for 2009–10. The economic recovery in 2010–11 primarily contributed to the increase in revenues. Most of the revenues, $18,265 million (79 percent) were generated from excises taxes on imported goods.
Financial Statements
The CBSA's financial statements are available on the Agency's website at http://www.cbsa-asfc.gc.ca/agency-agence/reports-rapports/menu-eng.html#fs-ef.
List of Supplementary Information Tables
All electronic supplementary information tables found in 2010-11 Departmental Performance Report can be found on the Treasury Board of Canada Secretariat website. [ 2 ]
- Sources of Respendable and Non-Respendable Revenue
- User Fees Reporting
- Status Report on Projects Operating with Specific Treasury Board Approval
- Status Report on Major Crown/Transformational
- Horizontal Initiatives
- Green Procurement
- Response to Parliamentary Committees and External Audits
- Internal Audits and Evaluations
Section IV: Other Items of Interest
Information and Contacts
To contact the CBSA and for more information on its activities, please visit the Agency's website at http://www.cbsa-asfc.gc.ca. Links to other websites of interest are provided below.
- Canada Revenue Agency website: http://www.cra-arc.gc.ca/
- Canadian Food Inspection Agency website: http://www.inspection.gc.ca/
- Canadian Security Intelligence Service website: http://www.csis.gc.ca/
- Citizenship and Immigration Canada website: http://www.cic.gc.ca/
- Department of Finance Canada website: http://www.fin.gc.ca/
- Foreign Affairs and International Trade Canada website: http://www.international.gc.ca/
- Health Canada website: http://www.hc-sc.gc.ca/
- Public Safety Canada website: http://www.publicsafety.gc.ca/
- Royal Canadian Mounted Police website: http://www.rcmp-grc.gc.ca/
- Transport Canada website: http://www.tc.gc.ca/
Notes
- Public Accounts of Canada 2010. [Return to Text]
- See 2010-11 Part III-Departmental Performance Reports (DPR): Supplementary Information (Tables), http://www.tbs-sct.gc.ca/dpr-rmr/2010-2011/index-eng.asp. [Return to Text]