
Common menu bar links
Breadcrumb Trail
ARCHIVED - Transport Canada - Report
 This page has been archived.
Archived Content
Information identified as archived on the Web is for reference, research or recordkeeping purposes. It has not been altered or updated after the date of archiving. Web pages that are archived on the Web are not subject to the Government of Canada Web Standards. As per the Communications Policy of the Government of Canada, you can request alternate formats on the "Contact Us" page.
Minister's Message

As Canada’s Minister responsible for the Transport, Infrastructure and Communities Portfolio, I am pleased to present Transport Canada’s Departmental Performance Report for 2010-2011.
Our transportation system has an impact on the lives of Canadians in ways that many may not realize. From the vehicles we drive to the waterways we enjoy; from the trains that carry the goods we buy at local stores to the airplane that flies us to a family reunion, Transport Canada supports a safe, secure, clean and efficient transportation system that Canadians can trust.
Canada’s Economic Action Plan was key to making this country a world leader in the economic recovery following the global economic crisis. For its part, Transport Canada has invested in faster and more reliable passenger rail services, more efficient border crossings, safer bridges and highways, improved airport security and refurbished harbours for small craft. Transport Canada has also accelerated activities under the existing Federal Contaminated Sites Action Plan at the Fort Nelson Airport in British Columbia, and the Halifax Airport Fire Training Area, creating jobs and reducing risks to human health and the environment. From the Peace Bridge in Ontario to the Motor Vehicle Test Centre in Quebec to the Keewatin Railway in Manitoba, projects that matter to Canadians have been completed on time.
We have worked hard to maintain Canada’s strong safety record by making our role in enforcing safety standards clear and by keeping our regulations current. We continue to be a world leader in the development of safety management systems.
Transport Canada has taken steps to keep Canadians safe and secure while travelling. The department worked with the Canadian Air Transport Security Authority to change airport screening procedures to increase passenger convenience and deliver a high level of security. We also continued to work with the United States and the International Civil Aviation Organization to strengthen air cargo security and help ensure the smooth flow of people and goods across borders.
We have adopted strategies that strengthen our international trade and supply chains through our gateways and trade corridors. The result is a more efficient, reliable and seamless trade-related transportation system in Canada. For example, the department continues to reach key milestones in the implementation of the Windsor-Detroit Crossing project, which is vital to Canada’s prosperity.
Transport Canada actively contributes to the Government’s Clean Air Agenda. The department completed, on schedule, two major initiatives that helped protect the environment, health and prosperity of Canadians. The ecotechnology for Vehicles and ecofreight programs helped introduce new clean transportation technologies that can lead to cleaner air for Canadians today and tomorrow.
Together, these initiatives improve our transportation system so that Canadians can continue to use it in their day-to-day lives with confidence.
I am proud of this department’s achievements on behalf of Canadians.
The Honourable Denis Lebel, P.C., M.P.
Minister of Transport, Infrastructure and Communities
Section I: Departmental Overview
1.1 Organizational Overview
1.1.1 Raison d’�tre
Transportation is an essential element of social and economic prosperity. Transport Canada was established to ensure that an effective transportation system provides open market access for natural resources, agricultural products and manufactured goods, and provides support to service industries. A safe and secure system provides reliable and efficient movement of goods and people across the country and around the world. In an environmentally responsible way, it meets the challenges posed by topography and geography, linking communities and reducing the effects of the distance that separates people. These vital roles reflect transportation’s interdependent relationships throughout all sectors of the economy and society.
Our Vision
A transportation system in Canada that is recognized worldwide as safe, secure, efficient and environmentally responsible.
The department’s vision of a sustainable transportation system integrates and balances social, economic and environmental objectives. Our vision is guided by these principles:
- the highest possible safety and security of life and property, guided by performance-based standards and regulations when necessary;
- the efficient movement of people and goods to support economic prosperity and a sustainable quality of life, based on competitive markets and targeted use of regulation and government funding; and
- respect for the environmental legacy of future generations of Canadians, guided by environmental assessment and planning processes in transportation decisions and selective use of regulation and government funding.
1.1.2 Responsibilities
Transport Canada is responsible for the Government of Canada’s transportation policies and programs. The department is responsible for developing regulations, policies and services under the legislative authority of Parliament. The department is required by the Canada Transportation Act to report on the state of the national transportation system. While not directly responsible for all aspects or modes of transportation, the department plays a leadership role to ensure that all parts of the transportation system across Canada work together effectively.
Transport Canada is part of the Transport, Infrastructure and Communities Portfolio that includes Transport Canada, Infrastructure Canada, shared governance organizations (e.g. the St. Lawrence Seaway Management Corporation), Crown corporations (e.g. the Great Lakes Pilotage Authority, Canada Post Corporation) and administrative tribunals/agencies (e.g. the Transportation Appeal Tribunal of Canada). Grouping these organizations into one portfolio allows for integrated decision making on transportation issues.
1.2 Summary of Performance
In 2010-2011 Transport Canada made significant progress in ensuring the maintenance and improvement of the Canadian transportation system. Building upon our world-class transportation system, Transport Canada invested $73 million to improve and repair infrastructure, increase safety on Canada’s railways and improve its laboratories and testing facilities, among other priorities. The department continued to implement safety management systems which provide for a strong Canadian safety culture. The Government of Canada also signed a number of international agreements regarding transportation safety and security over the past year.
Through Phase I of Canada's Economic Action Plan, announced in Budget 2009, the department continued to contribute to Canada’s economic recovery. Through the Gateways and Border Crossings initiatives, we have seen infrastructure improvements across the country to enable the fast and efficient movement of goods into the world marketplace. These investments will strengthen Canada's long-term economic competitiveness. Improved infrastructure at airports, ports and railway crossings also provide an immediate and long lasting improvement to the wellbeing of Canadians and international travellers.
1.2.1 Financial Resources
To support its mandate, Transport Canada received and utilized the following resources:
| Planned Spending | Total Authorities | Actual Spending |
|---|---|---|
| 1,883 | 1,958 | 1,288 |
Note: Variance explanations provided in Section 1.6 Summary Performance Tables by Strategic Outcomes and Internal Services
1.2.2 Human Resources
| Planned | Actual | Difference |
|---|---|---|
| 5,360 | 5,506 | 146 |
1.3 Strategic Outcomes and Program Activity Architecture
In the 2010-2011 Departmental Performance Report, Transport Canada outlines its achieved results against cited objectives in its 2010-2011 Report on Plans and Priorities. This aligns with the Government of Canada’s Policy on Management, Resources and Results Structures that requires the department to collect, manage, and report financial and non-financial information on program objectives, performance and results.
Transport Canada fulfils its mandate, responsibilities and objectives through four strategic outcomes.
Strategic Outcome 1: An efficient transportation system
To promote an efficient transportation system, Transport Canada:
- establishes marketplace frameworks to govern the economic behaviour of transportation sector organizations (e.g. rules for arbitrating disputes between shippers and rail carriers);
- provides leadership for gateways and trade corridor strategies (e.g. Canada's Asia-Pacific Gateway and Corridor Initiative);
- provides stewardship for federal transportation assets;
- partners with provinces, territories, municipal governments and the private sector in transportation infrastructure projects; and
- promotes innovation (e.g. state-of-the-art intelligent transportation systems).
Did you know?
There are ports in the Prairies. Regina’s Global Transportation Hub and Winnipeg’s Centre Port Canada are thriving inland ports that in part, are the result of federal funding for gateways and trade corridors.
Strategic Outcome 2: A clean transportation system
To promote a clean transportation system, Transport Canada:
- advances the federal government’s Clean Air Agenda in the transportation sector and complements other federal programs designed to reduce air emissions to protect the health of Canadians and the environment for generations to come;
- protects the marine environment and the health of Canadians by reducing the pollution of water from transportation sources; and
- fulfils its responsibilities by working towards a cleaner and healthier environment with regard to its own operations.
Did you know?
Transport Canada sent an aircraft and flight crews to the Gulf of Mexico to help monitor the extent of the crude oil spill following the Deepwater Horizon oil rig explosion.
Strategic Outcome 3: A safe transportation system
To promote a safe transportation system, Transport Canada:
- develops transportation safety regulations and oversees their implementation (e.g. safety at railway crossings);
- manages programs to:
- support safety-related investments at small airports;
- protect navigable waterways;
- certify and license aircraft, vessels and road vehicles; and
- provide air transport services that support aviation safety oversight work for federal and municipal clients (e.g. maintenance and operation of Canadian Coast Guard helicopters).
Did you know?
Transport Canada has the most advanced motor vehicle crash test laboratory in North America. The department can conduct realistic moving vehicle collisions at various angles and at high speeds.
Strategic Outcome 4: A secure transportation system
To promote a secure transportation system, Transport Canada:
- develops policies and programs that respond to emerging security risks and keep Canada competitive (e.g. codes of practice for the rail and transit industry);
- develops and enforces transportation security regulations (e.g. standards for screening passengers at airports); and
- works with international and national partners towards a shared and effective transportation security agenda (e.g. standards for security plans at ports, harmonization of aviation security standards).
Did you know?
The energy emitted from a full body scanner is 10,000 times less than the energy emitted from an average cell phone call.
You will find details about individual program activity achievements in Section II: Analysis of Program Activity Performance by Strategic Outcome.
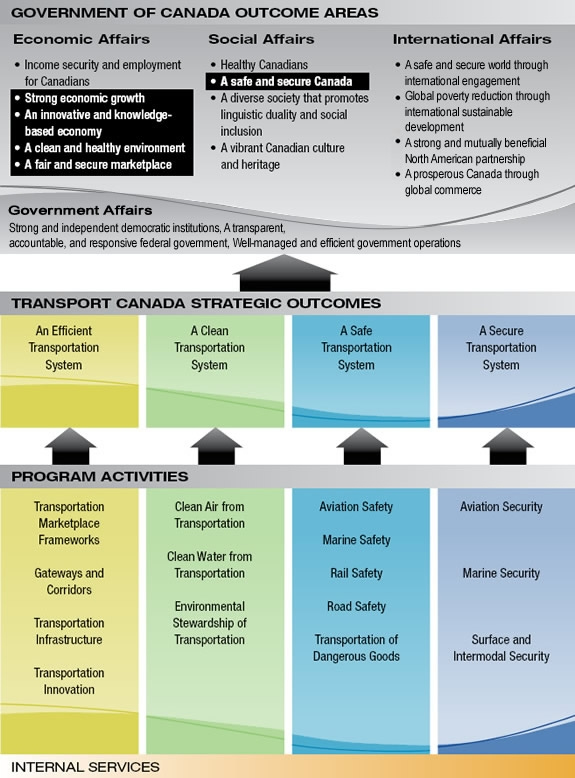
Program Activity Architecture
The Program Activity Architecture provides a standard basis for reporting to citizens and Parliament on the alignment of resources, program activities and results. Complementing its departmental performance management and reporting system, the Government of Canada has adopted a whole-of-government framework[1] for reporting to Parliament on progress made as a nation.
Figure 1 illustrates how Transport Canada’s Program Activity Architecture contributes to the broader Government of Canada outcome areas of strong economic growth; an innovative and knowledge-based economy; a clean and healthy environment; a fair and secure marketplace; and a safe and secure Canada. It also includes all program activities that contribute to our four departmental strategic outcomes. The Internal Services program activity, as an enabling function, supports all four strategic outcomes.
Figure 1: Transport Canada Program Activity Architecture
1.4 Contribution of Priorities to Strategic Outcomes
Transport Canada identified nine organizational priorities in its 2010-2011 Report on Plans and Priorities. These priorities addressed emerging and ongoing issues, which further strengthened the department’s approach to integrated decision making. The priorities are as follows:
- improve the effectiveness of safety management systems implementation;
- strengthen aviation security for passengers, workers and air cargo;
- complete the delivery of Canada’s Economic Action Plan to accelerate economic recovery;
- advance the implementation of the three gateway strategies (the Asia-Pacific Gateway and Corridor Initiative, the Continental Gateway and Trade Corridor Strategy, and the Atlantic Gateway and Trade Corridor Strategy) to support economic growth and competitiveness;
- continue to support the government’s Clean Air Agenda;
- develop a departmental approach for continuous improvement in the design, management, and delivery of grants and contributions programs;
- position Transport Canada to contribute to the Government of Canada’s initiatives to improve the federal regulatory system for major projects;
- strengthen the connection between people, resources and portfolio governance to deliver on the department’s priorities and mandate; and
- continue to support the public service renewal priority with a focus on talent management and employee engagement.
Transport Canada’s nine organizational priorities relate to one or more strategic outcomes. The department sets and/or revises priorities on an annual basis, informed by environmental scanning and corporate risks. It also aligns these priorities with Government of Canada commitments as stated in the Budget 2009 and the 2009 Speech from the Throne.
We have included the progress achieved for each priority in the following tables. First-time priorities are labelled as "new"; those committed to in the first or second fiscal year prior to this report are "previously committed to"; and older commitments are identified as "ongoing".
| Status | Definition |
|---|---|
| Exceeded | More than 100 percent of the expected level of performance for the priority identified in the corresponding Report on Plans and Priorities was achieved during the fiscal year. |
| Met All | One hundred percent of the expected level of performance for the priority identified in the corresponding Report on Plans and Priorities was achieved during the fiscal year. |
| Mostly Met | Eighty to 99 percent of the expected level of performance for the priority identified in the corresponding Report on Plans and Priorities was achieved during the fiscal year. |
| Somewhat Met | Sixty to 79 percent of the expected level of performance for the priority identified in the corresponding Report on Plans and Priorities was achieved during the fiscal year. |
| Not Met | Less than 60 percent of the expected level of performance for the priority identified in the corresponding Report on Plans and Priorities was achieved during the fiscal year. |
| In Progress | The indicator was under review during the 2010-2011fiscal year; therefore performance data is not available at the time of this report. |
| Priority | Type | Status | Linkages to Strategic Outcome(s) |
|---|---|---|---|
| Improve the effectiveness of safety management systems implementation. | Ongoing | Mostly Met | To promote a safe transportation system |
|
Summary of Accomplishments
Work in Progress
|
|||
| Priority | Type | Status | Linkages to Strategic Outcome(s) |
|---|---|---|---|
| Strengthen aviation security for passengers, workers and air cargo. | Previously Committed to | Met All | To promote a secure transportation system |
|
Summary of Accomplishments
|
|||
| Priority | Type | Status | Linkages to Strategic Outcome(s) |
|---|---|---|---|
| Complete the delivery of the Economic Action Plan to accelerate the economic recovery. | New | Mostly Met | All Strategic Outcomes |
|
Summary of Accomplishments
Work in Progess
|
|||
| Priority | Type | Status | Linkages to Strategic Outcome(s) |
|---|---|---|---|
| Advance the implementation of the three gateway strategies (the Asia-Pacific Gateway and Corridor Initiative, the Continental Gateway and Trade Corridor Strategy, and the Atlantic Gateway and Trade Corridor Strategy), including the new bridge crossing for Windsor-Detroit to support economic growth and competitiveness | Ongoing | Mostly Met | To promote an efficient transportation system |
|
Summary of Accomplishments
Work in Progess
|
|||
| Priority | Type | Status | Linkages to Strategic Outcome(s) |
|---|---|---|---|
| Continue to support the government’s Clean Air Agenda. | Previously Committed to | Mostly Met | To promote a clean transportation system |
|
Summary of Accomplishments
Work in Progress
|
|||
| Priority | Type | Status | Linkages to Strategic Outcome(s) |
|---|---|---|---|
| Develop a departmental approach for the continuous improvement in the design, management and delivery of grants and contributions programs. | New | Mostly Met | All Strategic Outcomes |
|
Summary of Accomplishments
Work in Progess
|
|||
| Priority | Type | Status | Linkages to Strategic Outcome(s) |
|---|---|---|---|
| Position Transport Canada to contribute to the Government of Canada’s initiatives to improve the federal regulatory system for major projects | New | Exceeded | To promote a clean transportation system |
|
Summary of Accomplishments
|
|||
| Priority | Type | Status | Linkages to Strategic Outcome(s) |
|---|---|---|---|
|
Strengthen our connection of people, resources and portfolio governance to deliver on priorities and mandate, and streamline administrative processes. |
Previously Committed to | Mostly Met | All Strategic Outcomes |
|
Summary of Accomplishments
Work in Progress
|
|||
| Priority | Type | Status | Linkages to Strategic Outcome(s) |
|---|---|---|---|
| Continue to support the public service renewal priority with a focus on talent management and employee engagement. | Previously Committed to |
Mostly Met |
Internal Services |
|
Summary of Accomplishments
Work in Progress
|
|||
1.5 Risk Analysis
Transportation is a part of all social and economic activities. It provides market access to natural resources, agricultural products and manufactured goods, provides support to service industries and links communities. Canada’s multi-modal transportation network includes 38,000 kilometres (km) of important national and regional highways, 21 million registered vehicles, 243,000 km of shoreline, over 49,000 ships, 30,000 aircrafts and 45,000 km of rail. In addition to the inherent risks due to its breadth, risks are introduced into the transportation system by its complex structure, including multiple jurisdictions of government interacting with private-sector stakeholders and consumers. These complexities, as well as changes to the department’s role as a more policy- and partnership-based organization, require Transport Canada to effectively manage risk as it pursues its strategic outcomes.
Risk Analysis Approach
Transport Canada has implemented a strong risk management governance structure outlined in its new Integrated Risk Management Policy that aims to promote the systematic integration of risk management practices to respond to unforeseen events and risks that have been identified in its Corporate Risk Profile.
It has improved the sharing of risk information between strategic, operations, program and project levels through the creation of a Departmental Risk Management Working Group that has representation from all groups and regions. This venue also serves to review, contribute to and promote department-wide integrated risk management initiatives. Further, a Centre of Expertise in Risk Management has been established to provide ongoing support to management and employees in promoting a consistent approach to risk identification, assessment and response.
Key Risk Areas
Through an environmental scan and department-wide consultations, four key risk areas have been identified and assessed in terms of probability and potential impact on the department and reported in the department’s Corporate Risk Profile. The four key risk areas are transportation system efficiency, oversight effectiveness and efficiency, security threat/incident response capability and change management. For each of these key risk areas, Transport Canada has developed risk responses that will be implemented over the next few years.
1. Security/Incident Response Capability
As Canada remains a potential target of terrorists, Transport Canada continues to develop and implement security mitigation strategies. We have adopted a proactive approach that engages relevant internal and external partners and stakeholders while dealing with emerging threats to maintain the safety and security of Canada’s transportation system. For example, Budget 2010 provided the Canadian Air Transport Security Authority and Transport Canada with $1.5 billion over the next five years to strengthen the domestic air transportation system against terrorist attacks and enhance the protection of air travellers. Budget 2010 also provided $95.7 million for the Air Cargo Security program to further enhance preventative and detective measures to deal with emerging threats. This year, Transport Canada had to respond to the discovery of suspicious packages aboard two planes in transit to the United States on October 29, 2010. In response to this event, a threat and risk assessment was immediately conducted in cooperation with other government departments. The results of the threat and risk assessment led to the expansion of the Air Cargo Security program to include in-bound air cargo and a re-profiling of 7% of Aviation Security’s budget. The expansion of the Air Cargo Security program also resulted in the delay and/or cancellation of lower priority activities as well as staffing and contracting actions in order to make the adjustments.
2. Oversight Effectiveness and Efficiency
In a complex environment that includes multiple jurisdictions, growing traffic, competing environmental and economic demands, rapidly evolving technologies and the constant threat of terrorism, it is becoming increasingly challenging to ensure that Transport Canada is well positioned for the oversight of the national transportation system. In response to this risk, the department is reviewing the regulatory framework to ensure it remains current and efficient and that its inspectors and policy makers have the necessary tools and skills development to fulfill their role.
3. Change Management/Managing Transition
The effective management of change, and the pace of change, contributes to Transport Canada’s ability to achieve its strategic outcomes. A key response to this risk is building synergy and cohesion between new governance structures and current functional and regional practices while enabling results-based management. The department has been working on the development of its Integrated Business Plan to better support the achievement of its priorities and strategic outcomes and in strengthening its risk management practices to contribute to its overall performance.
4. Transportation System Efficiency
To ensure that Canada’s transportation network continues to meet the needs of Canadians, the Government of Canada and its partners have made significant investments in transportation infrastructure through strategic gateways and trade corridors and through the Economic Action Plan. Transport Canada continued to take a robust risk management approach to monitoring the delivery of supporting initiatives. Quarterly progress reports are made to the Transport Executive Committee and Departmental Audit Committee, providing risk-based information for timely adjustments to achieve the objectives of Canada’s Economic Action Plan. Further, through its Program Excellence initiative, the department improved the integration of sound risk information when delivering all grants and contribution programs by developing the Transfer Payment Integrated Risk Management Framework, the Project and Recipient Risk Assessment Tool and the risk-based recipient auditing strategy. This initiative reduces the administrative burden within the department and on low-risk recipients.
1.6 Summary of Performance Tables by Strategic Outcome and Internal Services
| Performance Indicators | Targets | 2010-11 Performance |
|---|---|---|
| Level of productivity of transportation sector | Increase by 2.5 percent to 5 percent relative to 2009 baseline (Productivity Index >113 in 2014) | Most recent figures are from the 2009 calendar year. The productivity of the transportation business sector decreased by 6.2 percent (for-hire trucking was not included, as figures are being updated). This was primarily due to decreased demand caused by the economic recession. Carriers did not adjust inputs enough to offset the decline in output. |
| Cost level in the transportation sector | Growth in unit costs does not exceed 11 percent over a five-year horizon relative to the 2009 baseline (Cost Index < 111 in 2014) | Unit costs, for the same subset, decreased by 0.5 percent. The reduction was due to much lower fuel prices in 2009 than 2008, but increases in other input prices moderated the overall unit cost decrease. |
| Program Activity | Actual Spending ($ millions) 2009-2010 |
Planned Spending ($ millions) 2010-2011 | Alignment to Government of Canada Outcomes | |||
|---|---|---|---|---|---|---|
| Main Estimates | Planned Spending |
Total Authorities |
Actual Spending |
|||
| Transportation Marketplace Frameworks | 11 | 9 | 9 | 11 | 10 | A fair and secure marketplace |
| Gateways and Corridors | 156 | 812 | 812 | 805 | 243 | Strong economic growth |
| Transportation Infrastructure | 46 | 297 | 310 | 322 | 282 |
Strong economic growth |
| Transportation Innovation | 7 | 14 | 14 | 16 | 11 | An innovative and knowledge-based economy |
| Total* | 220 | 1 132 | 1 146 | 1 154 | 546 | |
*Due to rounding, columns may not add to the totals shown.
Information on Variances (between Total Authorities and Actual Spending) at the Program Activity Level
Transportation Marketplace Frameworks: As a result of shifting priorities, work and resources originally planned for this program activity were undertaken by another program activity, Internal Services.
Gateways and Corridors: The variance of $562 million is partly due to delays in several projects under the Asia-Pacific Gateway and Corridor Initiative that account for $110.9 million of the variance. There were delays related to project design, approval and construction starts, as well as the need to secure additional funding partners, finalize the contribution agreements and, ensure due diligence.
The remainder of the variance, $450M, can be attributed to delays under the Gateways and Border Crossings Fund, as some projects progressed more slowly than anticipated in 2010-2011. Many factors influenced these delays, including severe weather hampering construction, and unanticipated challenges in the design and regulatory approval processes. In addition, lower-than-expected construction costs resulted in lower spending for a few projects. Finally, for certain announced projects, business cases were not received when expected, which delayed the federal due diligence process. These funds have been or will be moved to future years for the completion of projects.
Transportation Infrastructure: The variance of $40 million is due, in part, to delays in projects resulting from extended negotiations, setbacks in construction caused by adverse weather conditions and/or prolonged environmental assessments. As a result, the department re-profiled $32 million to subsequent fiscal years to align with the recipients’ cashflow needs. The remainder is related to the surplus from 2010-2011 due to various factors.
Transportation Innovation: A number of variables linked to developing and managing research partnerships contributed to the approximately $5-million variance for this program activity during 2010-2011. More than half the total, approximately $2.6 million, in Security and Prosperity Partnership funding was re-profiled due, in part, to delays in securing Treasury Board approval of the program’s terms and conditions. Other factors include delays in reaching funding agreements with recipients, and research partners’ focus on stimulus funding that left limited resources, both financial and personnel, to access the available Security and Prosperity Partnership funding.
| Performance Indicators | Targets | 2010-11 Performance |
|---|---|---|
| Level of greenhouse gas emissions from the transportation sector measured in tonnes of CO2 equivalent, pollutant emissions and discharges from the transportation sector | Greenhouse gas emission levels from the transportation sector consistent with Government of Canada targets | Transportation greenhouse gas emissions remained relatively unchanged in 2008 as compared to 2007 (around 171 mega tonnes of CO2 equivalent in both 2008[4] and 2007). |
| Level of compliance with applicable laws, regulations and guidelines | Full compliance with applicable laws, regulations and guidelines | Transport Canada was in compliance with applicable environmental legislation, regulations and guidelines, and did not receive any contravention notices. |
| Program Activity | 2009-2010 Actual Spending ($ millions) |
2010-11 ($ millions) | Alignment to Government of Canada Outcomes | |||
|---|---|---|---|---|---|---|
| Main Estimates |
Planned Spending |
Total Authorities |
Actual Spending |
|||
| Clean Air from Transportation | 19 | 23 | 23 | 19 | 17 |
A clean and healthy environment |
| Clean Water from Transportation | 10 | 6 | 6 | 7 | 8 |
A clean and healthy environment |
| Environmental Stewardship | 38 | 70 | 70 | 59 | 40 |
A clean and healthy environment |
| Total* | 67 | 99 | 99 | 85 | 65 | |
*Due to rounding, columns may not add to the totals shown.
Information on Variances (between Total Authorities and Actual Spending) at the Program Activity Level
Clean Air from Transportation: Some freight projects were delayed due to negotiation with proponents or re-scoped to reduce costs as a result of the economic downturn; lack of uptake of funding available to provinces under the National Harmonization Initiative for the Trucking Industry Program; the cancellation of funding rounds for the Moving on Sustainable Transportation program and the ecomobility Program; and staffing and project delays.
Clean Water from Transportation: The variance of $1 million is mainly due to Transport Canada’s decision to continue the delivery of the National Aerial Surveillance Program.
Environmental Stewardship of Transportation: The variance of $19 million is due to a $7.4 million surplus of Federal Contaminated Sites Action Plan funding that was accelerated under Canada’s Economic Action Plan. The surplus reflects more cost-effective remedial approaches and lower-than-expected tender prices. In addition, an $11.7 million surplus of funding not related to Canada’s Economic Action Plan is due primarily to project delays. Additional investigative work was required before remediation could proceed.
| Performance Indicators | Targets | 2010-11 Performance |
|---|---|---|
| Number/rate of accidents or fatalities by mode |
Maintain or improve accident/fatality rates by mode, based on each mode’s strategic objectives |
Compared with the preceding five-year average, current accident/fatality rates were maintained or improved in aviation, marine, rail and road. There was a 4-per-cent increase in reported accidents and there were zero deaths in the transportation of dangerous goods. Additional information can be found in the Transportation in Canada 2010 report. |
| Percentage of respondents to a national survey reporting confidence in the safety of the transportation system | Maintain or improve public confidence in the safety of transportation, based on the strategic objectives of each mode |
No surveys were conducted in 2010-2011. This indicator is currently under review. |
| Program Activity | Actual Spending ($ millions) 2009-2010 |
Planned Spending ($ millions) 2010-2011 | Alignment to Government of Canada Outcomes | |||
|---|---|---|---|---|---|---|
| Main Estimates | Planned Spending |
Total Authorities |
Actual Spending |
|||
| Aviation Safety | 231 | 240 | 240 | 253 | 211 | Safe and secure Canada |
| Marine Safety | 82 | 74 | 74 | 84 | 83 | Safe and secure Canada |
| Rail Safety | 37 | 36 | 36 | 34 | 31 | Safe and secure Canada |
| Road Safety | 30 | 40 | 40 | 42 | 42 | Safe and secure Canada |
| Transportation of Dangerous Goods | 14 | 14 | 14 | 14 | 14 | Safe and secure Canada |
| Total | 394 | 405 | 405 | 428 | 381 | |
*Due to rounding, columns may not add to the totals shown.
Information on Variances (between Total Authorities and Actual Spending) at the Program Activity Level
Aviation Safety: The variance of $42 million is due to the delay in the approval of the Airports Capital Assistance Program; contracting delays related to capital projects; increased revenue related to Transport Canada’s participation in the Louisiana Oil Spill Response Project; and staffing delays.
Rail Safety: The variance of $3.0 million is due to delays in completing Grade Crossing Improvement and Closure projects; staffing; and completing amendments to the Railway Safety Act.
| Performance Indicators | Targets | 2010-11 Performance |
|---|---|---|
| Number of adjustments made to the Canadian Regulatory Framework to achieve international acceptance | Two adjustments or less to the Canadian Regulatory Framework to achieve international acceptance | Two adjustments were made to the Canadian Regulatory Framework to improve aviation security in the area of air cargo. |
| Percentage of Canadians reporting to confident in the security of the transportation system | Maintain or improve confidence in the security of the transportation system, based on the strategic objectives of each mode |
No public confidence data for the security of the transportation system were gathered in 2010. However, a Marine Industry Stakeholder survey was completed in 2010-2011 in which 93 percent of stakeholders agreed that a Marine Security program is needed in Canada. Stakeholders further agreed that their organizations were prepared to detect and prevent marine threats and incidents (79 percent), and to respond and recover (93 percent). |
| Program Activity | Actual Spending ($ millions) 2009-2010 |
2010-11 ($ millions) | Alignment to Government of Canada Outcomes | |||
|---|---|---|---|---|---|---|
| Main Estimates |
Planned Spending |
Total Authorities |
Actual Spending |
|||
| Aviation Security | 71 | 29 | 29 | 49 | 43 | Safe and secure communities |
| Marine Security | 32 | 21 | 21 | 21 | 20 | Safe and secure communities |
| Surface and Intermodal Security | 12 | 6 | 7 | 7 | 7 | Safe and secure communities |
| Total | 115 | 56 | 57 | 77 | 70 | |
*Due to rounding, columns may not add to the totals shown.
Information on Variances (between Total Authorities and Actual Spending) at the Program Activity Level
Aviation Security: The variance of $6.0 million is a result of postponing several activities (including regulatory consultations, airport security assessments, and two technology test beds) due to the need to respond to the discovery of suspicious packages aboard two planes in transit to the United States on October 29, 2010. Timelines and activities were adjusted to quickly respond to this incident in an effective and efficient manner to protect the security of Canadians.
Marine Security: The variance is related primarily to transfers to other departments that did not take place during Supplementary Estimates "C" — $120,000 in the Marine Security Coordination Fund and $442,000 for the Coastal Marine Security Operations Centre. The remaining amount relates to delays to the opening of the Great Lakes Marine Security Operations Centre because of staffing issues.
| Performance Indicators | Targets | 2010-2011 Performance |
|---|---|---|
| Not applicable | Not applicable | Internal Services has no performance indicators to report on for the 2010-2011 reporting year. Indicator currently under development. |
| Program Activity | Actual Spending ($ millions) 2009-2010 |
2010-11 ($ millions) | ||||
|---|---|---|---|---|---|---|
| Main Estimates | Planned Spending |
Total Authorities |
Actual Spending |
Alignment to Government of Canada Outcomes | ||
| Internal Services | 217 | 175 | 177 | 212 | 227 | |
*Due to rounding, columns may not add to the totals shown.
Information on Variances (Between Total Authorities and Actual Spending)
The variance is attributed to extraordinary salaries, such as maternity and severance pay, not being refunded in time from the Treasury Board because of Parliament’s dissolution before the end of the fiscal year ($6.8 million). The balance of the surplus is due to internal reallocations within Transport Canada and realignments across strategic outcomes.
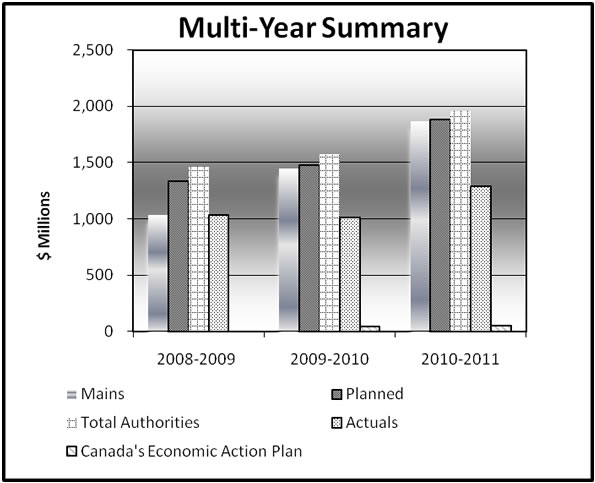
1.7 Expenditure Profile
1.7.1 Departmental Spending Trend
Figure 1 shows Transport Canada’s expenditures (planned, authorized and actual) from 2008-2009 to 2010-2011. The difference in actual spending, from $1,040 million in 2008-2009 to $1,288 million in 2010-2011, is due primarily to a change in the method of accounting for Airport Authorities lease payments. The change, however, does not impact the overall gross amount available to spend by the department.[5] The increase in actual spending is also attributed to major initiatives within the department over the same period, such as the Asia-Pacific Gateway and Corridor Initiative, and the Gateways and Border Crossings Fund. Although mostly in an upward trend over the past three years, there was a decrease in spending, due mainly to sunsetting of the ecoAUTO Rebate program.
Figure 1: Spending Trend for Transport Canada
Canada’s Economic Action Plan
The following table identifies the department’s initiatives and funding under Canada’s Economic Action Plan. Information on progress for these initiatives is found in Section II under each program activity.
Spending on Canada’s Economic Action Plan Initiatives
| Initiative | Authorized Spending ($ millions) | |||||
|---|---|---|---|---|---|---|
| 2009-2010 | 2010-2011 | 2011-2012 | 2012-2013 | 2013-2014 | Total | |
| Blue Water and Peace Bridges | 3.3 | 11.2 | 14.5 | |||
| Remote Passenger Rail Services | 4.5 | 3.4 | 7.9 | |||
| Accelerating Federal Contaminated Sites Action Plan | 13.0 | 35.5 | 48.5 | |||
| Rail Safety Initiatives | 11.3 | 14.1 | 14.4 | 14.3 | 14.3 | 68.4 |
| Modernization of Federal Laboratories | 4.5 | 9.7 | 14.2 | |||
| Security Plans | 2.7 | 2.7 | ||||
| Air Cargo Security Program | 11.0 | 11.0 | ||||
| Promoting Energy Development in Canada’s North | 2.9 | 2.9 | ||||
| Total | 53.2 | 73.9 | 14.4 | 14.3 | 14.3 | 170.0 |
*Based on original allocation as per Treasury Board. Includes Employee Benefits Plan.
Note: Due to rounding, column totals shown may not be exact. As with all financial information in the Departmental Performance Report, the figures exclude funding that does not come to the department (e.g. accommodation). Authorized spending is based on the original allocations as per the Treasury Board’s decision.
1.7.2 Voted and Statutory Items
See the Public Accounts of Canada for 2010-2011 (Volume II) for information on Transport Canada’s organizational votes and/or statutory expenditures.