ARCHIVED - Statistics Canada - Report
 This page has been archived.
Archived Content
Information identified as archived on the Web is for reference, research or recordkeeping purposes. It has not been altered or updated after the date of archiving. Web pages that are archived on the Web are not subject to the Government of Canada Web Standards. As per the Communications Policy of the Government of Canada, you can request alternate formats on the "Contact Us" page.
2009-10
Departmental Performance Report
Statistics Canada
The original version was signed by
The Honourable Tony Clement
Minister of Industry
Table of Contents
Section 2 Analysis of Program Activities
Section 3 Supplementary Information
Minister's Message

Last year, Canada was the last country to fall into the global recession. Today, our economy is beginning to emerge in the strongest position of any advanced country in the world. Investment and key stimulus measures as part of Year 1 of Canada's Economic Action Plan (www.actionplan.gc.ca) provided continued results and helped set Canada apart from its G-8 counterparts in terms of economic strength.
In 2009/2010, Industry Canada worked quickly with its Portfolio Partners to deliver timely and targeted stimulus initiatives. Composed of Industry Canada and 10 other agencies, Crown corporations and quasi-judicial bodies, the Portfolio helps the department to build a more productive and competitive economy.
As part of the Industry Portfolio, Statistics Canada continued to be a trusted source of statistical information to help Canadians better understand their country—its population, resources, economy, society and culture. The organization provided data and analyses to meet the statistical needs of federal, provincial and territorial governments, businesses, unions and not-for-profit organizations.
Moving forward, Industry Canada will continue to ensure that the jobs and industries of the future are created right here in Canada. We will follow through on delivering existing stimulus plans and continue to support government priorities. This means ensuring that we have the right conditions and regulatory frameworks in place to encourage investment in Canada, increasing support for R&D to improve Canada's long-term competitiveness and developing a digital economy.
I will work with the Industry Portfolio Partners, the private sector and other governments to enhance Canada's productivity and create the foundation for strong, sustainable and balanced growth.
It is my pleasure to present this year's Departmental Performance Report for Statistics Canada.
The original version was signed by Tony Clement, Minister of Industry
Chief Statistician's Message
I am pleased to present Statistics Canada's Departmental Performance Report.
As Chief Statistician of Canada, my goal is to ensure that Canadians have access to a trusted source of information. This is a key component in the effective governance of the country. Trust can only be kept if the data Statistics Canada produces are consistent with the needs of the country and well representative of the world they seek to describe. Statistics Canada strives to achieve this goal efficiently, producing relevant, high-quality information at the lowest possible cost.
I am happy to report that Statistics Canada continues to make progress in achieving its strategic outcomes:
- Information produced by Statistics Canada is relevant and widely accessed. Users downloaded 31.6 million data series from the CANSIM online database in 2009/2010, up by 4.3 million from the previous year. In addition, 9,294 media citations in newspapers, on national radio and television networks and online media services facilitated broad public access to data.
- The quality of statistical outputs has been maintained, as the high standard for sampling accuracy continues to be met and even exceeded for major statistical outputs.
- Statistics Canada is an efficient organization. The Treasury Board ranked Statistics Canada among the best-managed departments of similar size in the federal government.
However, to continually make progress, we must also acknowledge our challenges. After increasing by 14% in 2008/2009, visits to the Statistics Canada website decreased by 4% in 2009/2010. Although annual fluctuations are normal, owing in large part to the five-year census cycle, Statistics Canada continues to explore ways to improve the website and use new tools to broaden its reach to Canadians. As well, charging for data continues to be viewed as a barrier to access. Clients also indicated that data gaps remain in particular statistical sectors. To maintain the quality and utility of our statistics, we must reallocate resources from programs that are less relevant to those that address emerging information needs.
Statistics Canada is committed to maintaining an efficient, world class statistical system. I invite readers to benefit from the work of their national statistical bureau by visiting our website at www.statcan.gc.ca. Your feedback is most welcome.
The original version was signed by Wayne R. Smith, Acting Chief Statistician of Canada.
Section 1 Agency Overview
1.1 Summary Information
Raison d'être
The Government of Canada established Statistics Canada to ensure that Canadians have access to a trusted source of statistics related to Canada. Access to trusted information is fundamental in an open, democratic society to support decision-making by people and their elected representatives.
The statistics produced by Statistics Canada inform national policy and support evidence-based program management. A large portion of Statistics Canada's activities is devoted to meeting the needs of federal, provincial and territorial government policy departments, and to continually measuring Canadian socioeconomic dynamics and emerging trends.
Mandate
Statistics Canada's mandate derives primarily from the Statistics Act, R.S.C. 1970. The Act requires that the agency collect, compile, analyse and publish statistical information on the economic, social and general conditions of the country and its people. This mandate covers a broad range of statutory requirements and instruments, as well as contractual obligations, for which Statistics Canada must produce information.
The Statistics Act requires Statistics Canada to conduct a Census of Population and a Census of Agriculture every fifth year. The Act also confers substantial powers on the agency to request information for statistical purposes through surveys of businesses and households.
Statistics Canada is also mandated to co-ordinate and lead the national statistical system, specifically to prevent duplication in the information collected by government. Statistics Canada can also, by law, access all administrative records (e.g., tax data, customs declarations, and birth and death records), enabling it to reduce reporting burden on business and individual respondents, and to reduce redundant data-collection efforts across government. Statistics Canada is considered a leader among statistical agencies in reducing reporting burden by using administrative data. Partnerships and cost-recovery arrangements with other federal departments, other jurisdictions and external organizations play a large role in reducing reporting burden.
Strategic Outcome and Program Activity Architecture
Statistics Canada's strategic outcome is that Canadians have access to objective, high-quality, non-partisan statistics, statistical products, services and analyses on Canada, which fulfill legal requirements, are relevant to policy formulation and decision makers, and are responsive to emerging issues.
To meet this strategic outcome, Statistics Canada has identified two expected results. The first expected result focuses on Canadians' access to statistical information. The second expected result focuses on ensuring trust in the information provided. Key factors to ensure that the statistical information produced by Statistics Canada can be trusted are relevance and quality of data. In addition, the extent to which Statistics Canada is able to achieve its strategic outcome depends on its ability to optimize its management and operations through organizational efficiency.
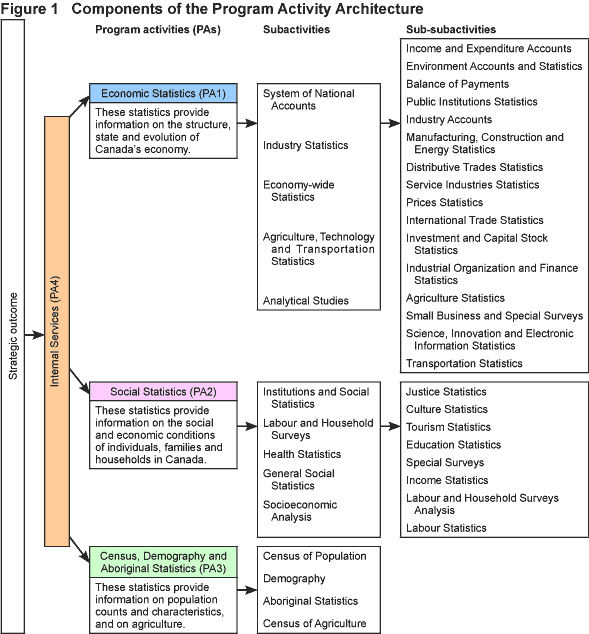
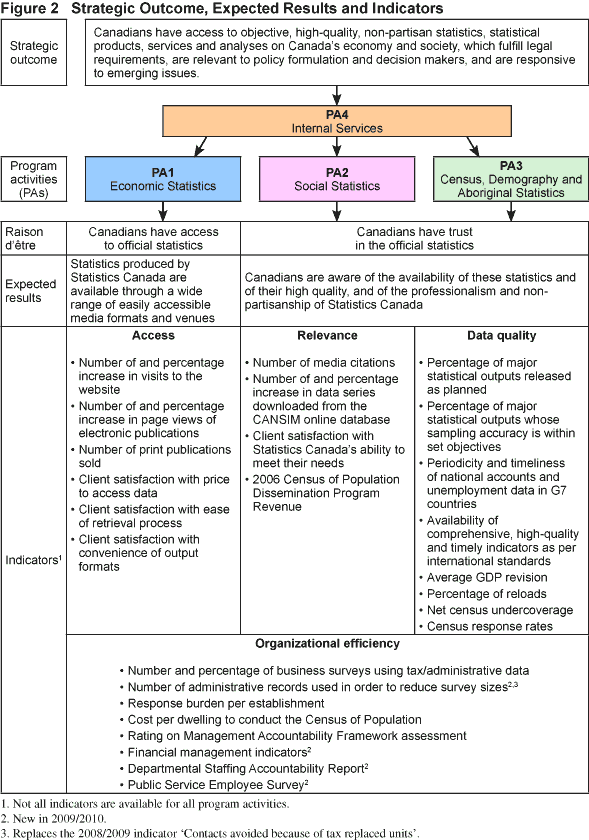
Statistics Canada's program activity architecture is shown in Figure 1. The strategic outcome and expected results, as well as all the performance indicators used in this report, are listed in Figure 2. Performance highlights are summarized in Table 3. Performance details by program activity are found in Section 2.
[D]
[D]
1.2 Performance Summary
Statistics Canada's statistical program is funded through direct parliamentary appropriations and cost-recovery activities. In recent years, the agency's 'respendable' cost-recovery revenues—revenues Statistics Canada is authorized to spend on the activity that generated them—have added more than $100 million to its total resources. A large portion of these respendable revenues is from federal departments to fund specific statistical projects.
| Planned spending | Total authorities | Actual spending |
|---|---|---|
| 454,391 | 537,221 | 509,093 |
| 1. Totals may differ within and between tables because of rounding. Amounts shown are net of respendable revenue. | ||
| Planned | Actual | Difference |
|---|---|---|
| 5,567 | 5,545 | 22 |
Table 3 Performance Highlights
| Performance Indicators | Targets/benchmarks | 2009/2010 performance summary1 |
|---|---|---|
| Indicators of access | ||
| Number of visits to the Statistics Canada website | Annual increase in visits exceeds 5% | Not met – Visits to the website decreased by 4.2%2 |
| Client satisfaction with price to access data | Rating of 4 on a scale of 5 | Somewhat met – Client satisfaction rating was 3.6 for economic statistics and 3.3 for social statistics |
| Indicators of relevance | ||
| Number of data series downloaded from the CANSIM online database | Annual increase in downloaded series exceeds 5% | Exceeded – Downloaded series increased 23.2% for economic statistics, 13.4% for social statistics |
| Clients' satisfaction with Statistics Canada's ability to meet their needs | Rating of 4 on a scale of 5 | Mostly met – Client satisfaction rating was 4.0 for economic statistics and 3.9 for social statistics |
| Number of media citations | Many | Met all – There were 9,294 media citations |
| Indicator of quality | ||
| Percentage of statistical outputs that meet set levels of sampling accuracy | 95% of major statistical outputs meet set levels of sampling accuracy | Exceeded – 96.0% for economic statistics and 99.7% for social statistics |
| Indicators of organizational efficiency | ||
| Rating on 21 areas of management, as defined in the federal Management Accountability Framework | Obtain rating of 'strong' or 'acceptable' in most areas of management | Met all – Rated 'strong' or 'acceptable' in all but one area of management |
| Departmental Staffing Accountability Report (DSAR) | Improve on results from the 2008 DSAR | Exceeded – Overall rating improved to 'strong' |
| Public Service Employee Survey 2008 | Rank among the best in comparison with other federal government departments (response rates and overall results) | Met all – Response rates well above Public Service average; job satisfaction at or above other federal departments |
| Financial reporting to Policy Committee | Monthly | Met all – All financial reports delivered as planned |
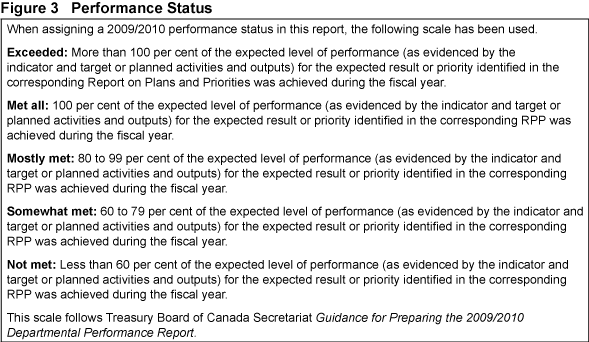
| 1. The scale used for assigning the 2009/2010 performance status is detailed in Figure 3. 2. After increasing by 14.4% in 2008/2009, visits to the Statistics Canada website decreased by 4.2% in 2009/2010 to just over 16.7 million visits for the year. Annual fluctuations are expected, the result of factors such as the number and types of releases and the social and economic situation in the country—the lowest numbers are posted at the end of the five-year census cycle. In 2009/2010, Statistics Canada continued to explore ways in which the website could be improved, and undertook new initiatives such as using social-networking tools to broaden its reach to Canadians. |
||
Table 3 Performance Highlights (concluded)
| Program activity | Expected results | 2009/20101 | Alignment to Government of Canada outcomes | ||||
|---|---|---|---|---|---|---|---|
| 2008/2009 Actual spending | Main estimates | Planned spending | Total authorities | Actual spending | |||
| $ thousands | |||||||
| Economic Statistics | Statistics produced by Statistics Canada are available through a wide range of easily accessible media formats and venues2 Canadians are aware of the availability of these statistics and of their high quality, and of the professionalism and non-partisanship of Statistics Canada.3 |
192,605 | 165,571 | 165,571 | 200,298 | 190,129 | A transparent, accountable and responsive federal government |
| Social Statistics | 128,249 | 132,585 | 132,585 | 144,751 | 136,495 | ||
| Census, Demography and Aboriginal Statistics | 85,398 | 78,669 | 78,669 | 100,325 | 93,146 | ||
| Internal Services | 91,109 | 77,566 | 77,566 | 91,847 | 89,323 | ||
| Total | 497,361 | 454,391 | 454,391 | 537,221 | 509,093 | ||
| 1. Totals may differ within and between tables because of rounding. Amounts shown are net of respendable revenue. 2. Expected result 1 focuses on access to statistical information by Canadians. 3. Expected result 2 contributes to ensuring trust in the information provided by Statistics Canada. |
|||||||
[D]
[D]
Performance Results
Overall, Statistics Canada has obtained solid evaluation results in each of the performance rounds.
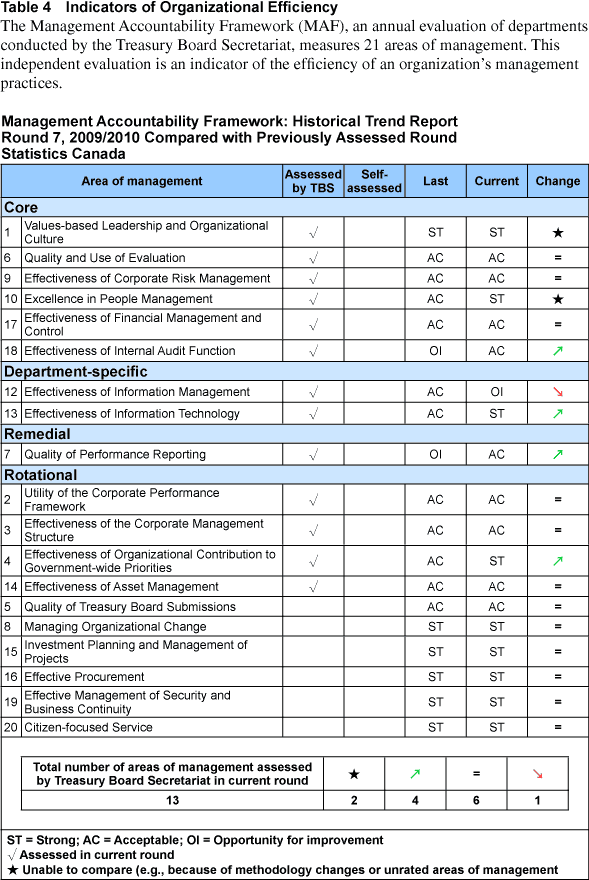
The 2009/2010 MAF Round 7 results indicate that the management efficiency of Statistics Canada is high and continues to improve. Highlights of the assessment include the following:
- 9 of the 21 areas of management are rated 'strong'
- 9 of the 21 areas of management are rated 'acceptable'
- assessment ratings improved in 4 areas of management in Round 7 over Round 6.
One area of focus is the effectiveness of the agency's information management. Here the MAF score went from 'acceptable' to 'opportunity for improvement'. Change has already taken place. The agency is developing a formal information management strategy and has established a departmental Information Management Committee to provide oversight.
Contribution of Priorities to Strategic Outcome
To support decision-making by Canadians and their elected representatives, Statistics Canada remained committed to providing access to a trusted source of information. The main accomplishments in 2009/2010 were to ensure that our information was more easily accessible, that our economic and social statistics remained strong in relevance and quality, that our 2011 Census preparations were completed, and that our operations became more efficient.
| Operational priorities | Type1 | Performance status | Link to program activity | Contribution to the strategic outcome2 |
|---|---|---|---|---|
| Historical Revision of the Canadian National Accounts An historical revision of the Canadian National Accounts was conducted to bring them in line with updated international standards. The project teams and governance are in place and on track to deliver the first phase in 2012, making Canada one of the first three countries in the world to implement the new standard. |
New | Met all | Economic Statistics | Quality |
| Balance of Payments Redesign A redesign of the Balance of Payments (Phase III) to update surveys of international financial transactions to meet revised international standards. In 2009/2010, Balance of Payments survey content was revised for the four principal annual financial surveys, resulting in a more coherent set of questionnaires. A systems prototype has been delivered, which features additional functionality for accessing historical data. Preliminary research on sampling methods has been delivered and is under review. |
New | Met all | Economic Statistics | Quality |
| General Business Panel Survey and Integrated Business Database The objective of the General Business Panel Survey and Integrated Business Database is to track business strategies and link them with businesses' performance over time. Pilot Survey Data—Together with the project sponsors, Statistics Canada determined the content for an integrated survey of business strategies, innovation and global value chains. The pilot survey was collected from January to March 2010, and achieved a response rate of over 60%. Business Performance Data—Qualitative survey data for 2009 has been processed, and several databases were linked to provide quantitative data on firm characteristics and business performance from 2000 to 2006. Some variables from the Business Register have been included from 2007 to 2009 to allow the linkage of pilot survey data. This provides a unique integrated database on Canadian businesses that can support analytical research. Researcher Assessment—Under this initiative, Statistics Canada facilitated access to this new database for designated policy researchers so they could to assess the utility of such data for policy research. |
Previously committed | Mostly met | Economic Statistics | Access |
| Services Producer Price Indexes Statistics Canada published three new services producer price indexes in the last year: the Wholesale Price Index, the For-hire Motor Carriers of Freight Index (covering trucking services) and the Commercial Rents Price Index. These and other new indexes are part of an initiative to improve coverage of service prices. Significant progress on the Retail Services Price Index and the Commercial and Industrial Machinery and Equipment Rental and Leasing Price Index was also made; these new products will be launched in October 2010. Development of other price indexes continues in the areas of banking, insurance, telecommunications and transportation. |
Ongoing | Met all | Economic Statistics | Relevance |
| Canadian Health Measures Survey The Canadian Health Measures Survey (CHMS) involves collection of key health information—via direct physical measurement—and the creation of national baseline health data. Data for the inaugural CHMS cycle were disseminated in January 2010 with the release of household and clinic data, and followed in March 2010 with the release of laboratory data (excluding environmental measures). Each release included microdata files, summary tables, a user guide, derived variables, a data dictionary and articles published in the Statistics Canada journal Health Reports. CHMS microdata files are available in Statistics Canada Research Data Centres and the CHMS share files have been provided to federal partners— Health Canada and the Public Health Agency of Canada. The second cycle of the CHMS began collection in August 2009 with essentially the same content. |
Ongoing | Met all | Social Statistics | Access |
|
Household Survey Redesign The household survey redesign will address challenges to the household survey program, in particular rising costs, declining response rates, changing user needs and a need for flexible options for respondents. This second year of the multi-year project saw the development of requirements and the start of integration of processes and systems, such as
|
Previously committed | Mostly met | Social Statistics | Quality and organizational efficiency |
| Crime Severity Index The new Crime Severity Index provides a more meaningful indicator of the change in police-reported crime from year to year. It also makes crime statistics more comparable at the provincial, territorial and municipal levels by taking into account the relative seriousness of each offence. The index was released in May 2009. Canada is considered among the leaders in the international community in the measurement of police-reported crime, owing to both our national coverage for incident-based crime microdata and the new Crime Severity Index. |
New | Met all | Social Statistics | Relevance |
| 2011 Census of Population Preparation for the 2011 Census of Population continued as planned, including an integrated Census Test conducted in the summer of 2009. The objectives of the test were to fully exercise systems, procedures and processes, as well as enhancements aimed at improving areas that were problematic in 2006 and to validate major changes. The first major initiative being implemented for the 2011 Census is to encourage online responses by mailing a letter instead of a questionnaire package to 60% of all dwellings. The second major initiative is a web-based system, enabling staff in the field to communicate with head office to better manage and monitor the follow-up required with Canadian householders who do not complete a census questionnaire promptly. |
Previously committed | Met all | Census, Demography and Aboriginal Statistics | Quality and organizational efficiency |
| 2011 Census of Agriculture The Census of Agriculture, along with the Census of Population, participated in the May 2009 Census Test. The test showed that proposed content changes to the questionnaire performed well with respondents. The test confirmed that, technically, the new Census of Agriculture collection methodology of a full mail-out is feasible. The mailing list performed well, as did the procedures for drop-off and return registration with Canada Post Corporation. The test clearly showed the positive impact on response rates for the Census of Agriculture owing to being coupled with the Census of Population: response rates were 10 percentage points higher in overlap areas than in areas where only the Census of Agriculture was tested. Systems development and testing, along with frame enhancement proceeded as planned, in order to position the Census of Agriculture for the Census in 2011. |
Previously committed | Met all | Census, Demography and Aboriginal Statistics | Quality and organizational efficiency |
| Management priorities | Type1 | Performance status | Link to program activity | Contribution to the strategic outcome2 |
| Collection Business Architecture The Collection Business Architecture initiative is designed to modernize and streamline Statistics Canada's data-collection processes. Through greater use of the excess space and infrastructure now available, business surveys previously collected from Ottawa were successfully conducted in regional offices located across Canada. Two pilots involving approximately 75 business surveys resulted in higher response rates than in previous years and the same level of data quality. Challenges were encountered this year, as we progressed through these initiatives: workloads increased for many staff members, additional training was delivered and change management processes were implemented. As a result, 80% of the mandated $2 million in financial efficiencies were achieved one year ahead of the target delivery date of April 1, 2011. |
New | Met all | Internal services | Organizational efficiency |
Public Service Renewal
|
New | Exceeded | Internal Services | Organizational efficiency |
| Internal Audit The objective was to strengthen the agency's internal audit function in accordance with Treasury Board policy. During the year, the internal audit function strengthened its professional practices and completed a full implementation of the Departmental Audit Committee. The renewed internal audit function is the cornerstone of assurance to the Chief Statistician and senior management on governance, risk management and internal control. Experienced internal auditors were recruited, a new risk-based audit plan was put in place, and greater coverage of high-risk areas was implemented. These are all elements of a strong internal audit function. The early implementation of a quality assurance and improvement program is a sign of the agency's strong internal audit governance framework. |
New | Met all | Internal Services | Organizational efficiency |
| 1. Type is defined as follows: previously committed to—committed to in the first or second fiscal year before the subject year of the report; ongoing—committed to at least three fiscal years before the subject year of the report; and new—newly committed to in the reporting year of the RPP or DPR. 2. These items are linked to the priorities elaborated in the agency's Corporate Business Plan. |
||||
Risk Analysis
Risk management is the foundation of all activities undertaken by the organization.
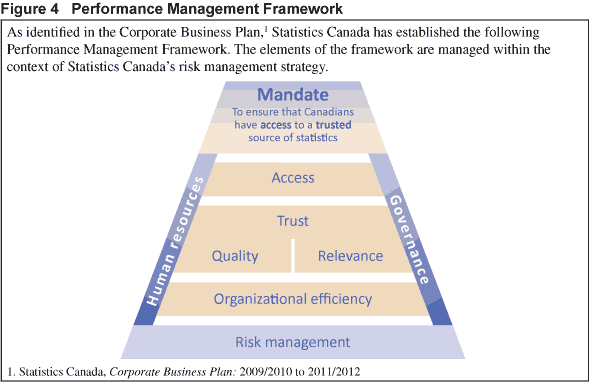
Statistics Canada achieves its strategic objective of efficiently providing access to relevant and quality data through the Performance Management Framework (see Figure 4). This framework is built on a foundation of risk management. At the heart of the framework and the department's mandate are access, relevance, quality and organizational efficiency. All activities are aligned with these objectives. The annual long-term planning process provides a means to optimize the allocation of resources towards the achievement of corporate objectives.
[D]
In this context, risk is defined as any event that may prevent the organization from achieving its objectives.
To manage risks, Statistics Canada has developed this model. First, managers and subject-matter experts identify and categorize all risks related to the four corporate objectives. They then measure the level of inherent risk for each identified risk. Inherent risk is the risk that is linked to an activity by the nature of the activity and by the very fact that the organization performs this activity. They then evaluate the effectiveness of existing mitigation strategies that have been in place over a number of years, based on the experience and judgment of program managers and Statistics Canada's senior management. What is left is the residual risk. This is what Statistics Canada is most concerned with, and needs to manage continually. As well, external risk factors are taken into consideration at the corporate level as part of this exercise.
To fully measure the residual risk, program managers provide their expert assessment of the probability of the risk materializing and the subsequent impact. They base their assessments on both quantitative information and subjective assessments derived from their experience. Experts are also asked to estimate the composite level of residual risk, or risk exposure, by combining the probability of the risk materializing and the subsequent impact. The risk exposure is classified as high, medium or low.
For the most important risks, as determined by the experts, the following information is also collected: the estimated cost of implementing further risk-mitigation strategies, and expert assessment of whether these strategies would be worth the cost.
The risk information thus gathered is used by program managers to help determine if proposals should be part of Statistics Canada's annual long-term planning process. That process, which begins each year in October and concludes in February, has a three- to five-year planning horizon. As part of the annual long-term planning process, the risks in the Risk Register are prioritized. An evaluation of the cost and benefit of various proposals to further mitigate the most important residual risks is completed. The long-term planning process therefore assesses return on investment in risk management activities towards the achievement of the corporate objectives. In some cases, mitigation of important risks may become a priority and be presented in the Report on Plans and Priorities. At the end of the period, the Departmental Performance Report provides an assessment of how effectively such risk mitigation contributes to the agency's priorities.
Applying this risk management model, the status of the key risks identified in the 2009/2010 Report on Plans and Priorities can be assessed. The risks identified were security of data supply, usefulness of outputs, and challenges of running a large and complex organization.
To mitigate these risks, Statistics Canada undertook a number of activities. First, the agency launched an initiative to modernize collection practices to improve efficiency and to address security of data supply. To make its outputs more useful, Statistics Canada made investments in many surveys, including surveys relating to the economy, the environment, health, and the administration of justice. In addition, the agency extended the coverage of producer price indexes in service industries—an investment to improve the measurement of real output and productivity in the Canadian economy. Statistics Canada has also revised the Canadian National Accounts to bring them in line with updated international standards.
More broadly, the management challenges of running such a complex organization have been well mitigated by the agency's strong governance structure and practices, as well as its risk management strategy, advisory committees, planning process, user feedback and audits and evaluations.
Finally, Statistics Canada must be prepared to deal with events when risks materialize. To do this, Statistics Canada has a business continuity plan in place. For any and all other risks, a strong governance structure is in place. New issues are quickly brought to the attention of Policy Committee, the agency's most senior executive committee, for immediate action. Statistics Canada's Risk Management Committee oversees development of the risk management model, and guides and monitors the implementation of the model.
This simple yet highly effective risk management model provides the following benefits:
- It provides Statistics Canada with a comprehensive picture of every major risk through a Risk Register. The Risk Register identifies significant risks by source and by program for the entire agency.
- It enables creation of Statistics Canada's Corporate Risk Profile in a consistent manner.
- It provides concrete quantitative risk-assessment data, enabling consistent, integrated decision-making based on solid facts.
- It enables optimization of benefits at the lowest possible cost by taking into account the costs and benefits of potential mitigation strategies.
- It provides the tools to constantly update and anticipate risks and plan on how to deal with them.
Expenditure Profile
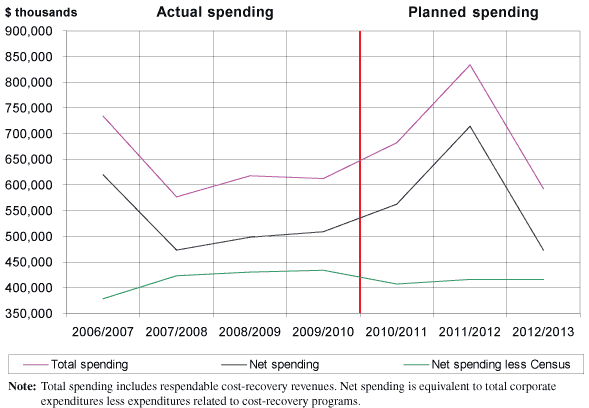
Figure 5 shows the seven-year trend of Statistics Canada's total spending and spending net of respendable revenue. The first year, 2006/2007, marks the year of the 2006 Census; the last year, 2012/2013, will be the year after the 2011 Census.
Figure 5 Spending Trends
[D]
As shown in Figure 5, total and net spending will rise in 2010/2011, peak in 2011/2012 when the 2011 Census of Population and 2011 Census of Agriculture are conducted, and drop sharply in 2012/2013 as these activities begin to wind down. This pattern is typical for the agency, a function of the cycle of the Census program, as demonstrated by the declining spending from 2006/2007 to 2007/2008.
In 2009/2010, net spending increased slightly over 2008/2009, owing to preparations for the 2011 Census.
Variances by Source
Table 6 provides a more detailed breakdown of Statistics Canada's spending for the most recent fiscal years.
| Program activity | 2007/2008 | 2008/2009 | 2009/2010 | |||
|---|---|---|---|---|---|---|
| Actual spending | Actual spending | Main estimates | Planned spending | Total authorities | Actual spending | |
| $ thousands | ||||||
| Economic Statistics | ||||||
| Net spending | 185,082 | 192,605 | 165,571 | 165,571 | 200,298 | 190,129 |
| Add respendable revenue | 18,914 | 22,282 | 24,497 | 24,497 | 24,497 | 24,808 |
| Total spending | 203,996 | 214,887 | 190,068 | 190,068 | 224,795 | 214,937 |
| Social Statistics | ||||||
| Net spending | 130,622 | 128,249 | 132,585 | 132,585 | 144,751 | 136,495 |
| Add respendable revenue | 55,696 | 70,354 | 59,872 | 59,872 | 59,872 | 50,788 |
| Total spending | 186,318 | 198,603 | 192,457 | 192,457 | 204,623 | 187,283 |
| Census, Demography and Aboriginal Statistics | ||||||
| Net spending | 75,155 | 85,398 | 78,669 | 78,669 | 100,325 | 93,146 |
| Add respendable revenue | 24,847 | 23,413 | 29,439 | 29,439 | 29,439 | 23,659 |
| Total spending | 100,002 | 108,811 | 108,108 | 108,108 | 129,764 | 116,805 |
| Internal Services | ||||||
| Net spending | 83,172 | 91,109 | 77,566 | 77,566 | 91,847 | 89,323 |
| Add respendable revenue | 3,698 | 3,794 | 6,192 | 6,192 | 6,192 | 3,691 |
| Total spending | 86,870 | 94,903 | 83,758 | 83,758 | 98,039 | 93,014 |
| Total Statistics Canada | ||||||
| Net spending | 474,031 | 497,361 | 454,391 | 454,391 | 537,221 | 509,093 |
| Add respendable revenue | 103,155 | 119,843 | 120,000 | 120,000 | 120,000 | 102,946 |
| Total spending | 577,186 | 617,204 | 574,391 | 574,391 | 657,221 | 612,039 |
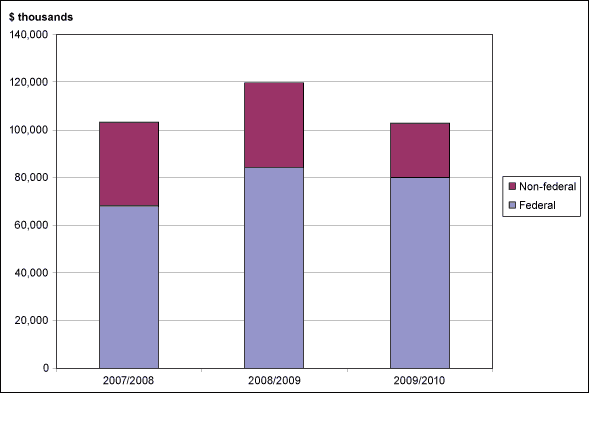
Respendable revenue adds more than $100 million per year to Statistics Canada's budget, enabling production of a wide variety of statistics used by other federal departments to run their programs effectively. Provincial governments, private companies and other entities also use these statistics extensively.
Statistics Canada relies heavily on other government departments to provide this much-needed source of funding, as Figure 6 demonstrates.
Figure 6 Respendable Revenues, by Source
[D]
Canada's Economic Action Plan Initiatives
Announced in Budget 2009, Canada's Economic Action Plan (CEAP) provided Statistics Canada with $2.9 million to extend the Canadian Environmental Sustainability Indicators program and $0.2 million to enhance federal public service student employment. The $3.1-million total includes contributions to employee benefit plans (EBP).
The Canadian Environmental Sustainability Indicators is a joint initiative with Environment Canada (the lead department) and Health Canada. In 2009/2010, Statistics Canada committed to deliver survey results and underlying microdata for the Households and the Environment Survey 2007, the Agricultural Water Use Survey 2006, the Industrial Water Survey 2007, and the Survey of Drinking Water Plant 2007. In addition, Statistics Canada undertook to collect the data for the Households and the Environment Survey 2009.
Performance status: Met all — all CEAP deliverables were completed.
Voted and Statutory Items
Table 7 shows the way in which Parliament approved Statistics Canada's resources, the changes in resources derived from supplementary estimates and other authorities, and how the funds were spent.
| Voted (number) or statutory (S) item | Truncated vote or statutory wording | 2009/20101 | |||
|---|---|---|---|---|---|
| Main estimates | Planned spending | Total authorities | Actual spending | ||
| $ thousands | |||||
| 95 | Operating expenditures | 391,910 | 391,910 | 460,237 | 432,109 |
| (S) | Contributions to employee benefit plans | 62,481 | 62,481 | 76,984 | 76,984 |
| Total | 454,391 | 454,391 | 537,221 | 509,093 | |
| 1. Totals may differ within and between tables because of rounding. Amounts shown are net of respendable revenue. | |||||
A significant portion of the difference between planned and actual spending is due to collective agreement settlements within the fiscal year. In-year approvals of funding for the Canadian Health Measures Survey and the 2011 Census of Agriculture also increased spending authority.
Section 2 Analysis of Program Activities
Statistics Canada's strategic outcome is that Canadians have access to objective, high-quality, non-partisan statistics, statistical products, services and analyses on Canada's economy and society that fulfill legal requirements, are relevant to policy formulation and decision makers and are responsive to emerging issues.
This section describes Statistics Canada's program activities, and the financial and non-financial resources available to each. Performance is assessed for each of the four program activities:
- Economic Statistics
- Social Statistics
- Census, Demography and Aboriginal Statistics
- Internal Services.
2.1 Program Activity 1: Economic Statistics
| 2009/2010 Financial resources1 ($ thousands) | 2009/2010 Human resources (FTEs) | ||||
|---|---|---|---|---|---|
| Planned spending | Total authorities | Actual spending | Planned | Actual | Difference |
| 165,571 | 200,298 | 190,129 | 2,088 | 2,179 | (91) |
| 1. Totals may differ within and between tables because of rounding. Amounts shown are net of respendable revenue. | |||||
Overview
The Economic Statistics program seeks to provide Canadians with a comprehensive, integrated set of measures of the structure, state and evolution of Canada's economy. With necessarily limited resources, this program must be continually adjusted to ensure it is responding to the highest-priority information needs of public and private decision makers. To support Canada's engagement in international policy-making, the program must respect international standards to permit intercountry comparison and analysis as well as development of global measures of economic performance.
To fulfill their purpose, statistics produced under this program must be of high quality and must accurately depict the performance of Canada's economy. They must also be timely, internally coherent and accessible.
The program must also be efficient, in terms of the resources consumed in the production of the various measures and in terms of the burden that the program imposes on businesses, farmers and other Canadians responding to its surveys.
Benefits for Canadians
An effective, well-developed economic statistics system is essential to the conduct of the federal government's business, most notably for developing, formulating and monitoring policy, as well as delivering several critical social and economic programs to Canadians. It is a prerequisite for Canada's recognition as a developed country and essential to its participation in international institutions such as the Organisation for Economic Co-operation and Development, the International Monetary Fund, the World Trade Organization and the United Nations. International co-ordination of economic policy and effective trade negotiations depend on statistical information.
Beginning with the Constitution Act of 1867, much Canadian legislation at the federal and provincial levels has relied on statistical information for its operation. Equalization payments to provinces and indexation of social benefits and tax brackets are important examples of legislated uses of economic statistics. In the private sector, many contracts and collective agreements are similarly dependent on economic statistics.
The current economic climate illustrates well the dependence of macro-economic fiscal and monetary policy on economic statistics. Equally important is a similar dependence on economic statistics of industrial and labour market policies, regional economic policy, policies designed to promote productivity and innovation, and policies designed to attract and retain foreign investment in Canada.
Private businesses, like governments, depend on economic statistics for their decisions on such things as mergers and acquisitions, investments and opening and closing locations. Timely and reliable statistics remove uncertainty about the economic environment and improve the efficiency of private decision-making.
For Canadians, economic statistics provide a scorecard for measuring their governments, to engage in policy debate and to hold governments to account. An effective economic statistics system is an essential ingredient of a vibrant, modern democracy.
Performance Analysis
| Year | Performance rating | |
|---|---|---|
| Statistics produced by Statistics Canada are available through a wide range of easily accessible media formats and venues. | 2009/2010 | Mostly met |
| 2008/2009 | Met |
| Indicator | Current benchmark/target | 2005/2006 | 2006/2007 | 2007/2008 | 2008/2009 | 2009/2010 | Rating |
|---|---|---|---|---|---|---|---|
| Number of page views of electronic publications ('000) | Annual increase exceeds 5% | 1,072 | 1,669 | 2,209 | 2,989 | 2,928 | Not met |
| Annual percentage increase in the number of page views of electronic publications (%) | 29.6 | 55.7 | 32.4 | 35.3 | (2.0) | ||
| Number of print publications sold — accessible on demand (number) | Many | 5,562 | 4,856 | 5,630 | 4,349 | 4,095 | Met all |
| Client satisfaction with price to access data | 4 on a scale of 5 | ... | ... | 3.8 | 3.6 | 3.6 | Somewhat met |
| Client satisfaction with ease of retrieval process | 4 on a scale of 5 | ... | ... | 3.9 | 3.9 | 4.1 | Exceeded |
| Client satisfaction with convenience of output formats | 4 on a scale of 5 | ... | ... | 4.0 | 4.0 | 4.0 | Met all |
| ... not measured Definitions Number of page views of electronic publications: The number of web pages viewed during visitor sessions on the Statistics Canada website. Number of print publications sold: The number of print copies for which a price was charged. Statistics Canada has moved to free dissemination of electronic versions of publications to encourage broader access. Client satisfaction: These data are derived from the client satisfaction surveys conducted by the Economic Statistics program activity. The surveys use measures that are consistent with the common measurement tool in use across the federal government. |
|||||||
| Performance results: The Economic Statistics program activity continued to have high numbers of electronic page views by clients. However, these declined relative to 2008/2009, and therefore did not meet the target. This suggests that more must be done to improve the effectiveness of the website. In accordance with Statistics Canada's strategy, there was a corresponding shift away from print publications. Overall, clients expressed satisfaction with the ease of retrieval and with the convenience of output formats. Clients expressed some dissatisfaction with respect to price, which continues to be a barrier to access. | |||||||
| Year | Performance rating | |
|---|---|---|
| Canadians are aware of the availability of these statistics and of their high quality, and of the professionalism and non-partisanship of Statistics Canada. | 2009/2010 | Met all |
| 2008/2009 | Met |
Key factors to ensure that the statistical information produced by Statistics Canada can be trusted are relevance and data quality, which include international comparisons.
| Indicator | Current benchmark/target | 2005/2006 | 2006/2007 | 2007/2008 | 2008/2009 | 2009/2010 | Rating |
|---|---|---|---|---|---|---|---|
| Number of data series downloaded from the CANSIM online database ('000) | Annual increase exceeds 5% | 5,176 | 8,445 | 8,535 | 11,251 | 13,859 | Met all |
| Annual percentage increase in the number of data series downloaded from the CANSIM online database (%) | 53.5 | 63.2 | 1.1 | 31.8 | 23.2 | ||
| Client satisfaction with Statistics Canada's ability to meet their needs | 4 on a scale of 5 | ... | ... | 3.9 | 3.9 | 4.0 | Met all |
| ... not measured Definitions Data series downloaded from the online database: Data series downloaded by external users from CANSIM, Statistics Canada's online database. Client satisfaction: These data are derived from the client satisfaction surveys conducted by the Economic Statistics program activity. The surveys use measures that are consistent with the common measurement tool in use across the federal government. |
|||||||
| Performance results: The Economic Statistics program activity continued to see strong growth in the number of tables downloaded from Statistics Canada's CANSIM online database. Table downloads require deliberate action on the part of clients, demonstrating the relevance of these data. Clients indicated that the data met their needs. | |||||||
| Indicator | Current target | 2005/2006 | 2006/2007 | 2007/2008 | 2008/2009 | 2009/2010 | Rating |
|---|---|---|---|---|---|---|---|
| % | |||||||
| Percentage of major statistical outputs released as planned | 100 | 100 | 100 | 100 | 100 | 100 | Met all |
| Percentage of major statistical outputs whose sampling accuracy is within set objectives | 95.0 | ... | 95.6 | 96.5 | 95.5 | 96.0 | Exceeded |
| Percentage of reloads | Less than 2.5 | ... | ... | 2.7 | 1.8 | 0.4 | Exceeded |
| ... not measured Definitions Major statistical outputs released as planned: Each year Statistics Canada publishes the planned release dates for major statistical outputs for the coming year on its website. These outputs and their release dates can be accessed at http://www.statcan.gc.ca/release-diffusion/index-eng.htm. Major statistical outputs whose sampling accuracy is within set objectives: Most surveys are based on statistical sampling. Sampling is an important means of achieving timely and cost-effective results. At the same time, estimates based on sampling can be expected to vary from sample to sample, and to differ from those that would result from a complete census. Sampling accuracy objectives are set on a survey-by-survey basis. Reloads: Outputs that require correction after release. In 2008, Statistics Canada enhanced its process for monitoring the quality of its data releases to reduce the risk of errors found after official release. |
|||||||
| Performance results: All major statistical outputs from the Economic Statistics program activity were released on time, adhering to the pre-established release schedule, and in accordance with accuracy targets. | |||||||
International Comparison of Canadian Economic Indicators
Managing Canada's macro-economy through monetary and fiscal policies is the responsibility of the federal government. The Bank of Canada, the Department of Finance and international organizations, such as the Organisation for Economic Co-operation and Development (OECD) and the International Monetary Fund, expect that the national statistical office will produce, in general compliance with international standards, a comprehensive and timely set of economic indicators to guide macro-economic policy.
Statistics Canada is internationally recognized for producing a comprehensive, high-quality and timely set of economic indicators. A May 2010 report by the OECD Statistics Directorate listed 28 categories of statistical measures (four more than in 2009) that member countries are expected to maintain and report. Canada was reported as fully compliant in 22 categories, Australia in 25, the United Kingdom in 23 and the United States in 25. Canada's compliance improved with the provision of capital stock by industry data, but declined in terms of consumer opinion surveys as this is not currently part of Statistics Canada's program. Compliance was lacking with respect to business tendency surveys (owing to the previous cancellation of the Business Conditions Survey), monthly international trade in goods by Standard International Trade Classification sections, and two new categories related to structural and business statistics.
Table 12 presents information derived from the International Monetary Fund website on the periodicity and timeliness of National Accounts data.
| G7 country | Benchmark | Periodicity | Timeliness | ||||
|---|---|---|---|---|---|---|---|
| SDDS | Result | Rating | SDDS | Result | Rating | ||
| Canada | Meet SDDS requirements | Quarterly | Quarterly | Met | 1 quarter | 60 days | Met |
| France | Quarterly | Quarterly | Met | 1 quarter | 50 days | Met | |
| Germany | Quarterly | Quarterly | Met | 1 quarter | 45 days | Met | |
| Italy | Quarterly | Quarterly | Met | 1 quarter | 10 weeks | Met | |
| Japan | Quarterly | Quarterly | Met | 1 quarter | 6 weeks | Met | |
| United Kingdom | Quarterly | Quarterly | Met | 1 quarter | 1 quarter | Met | |
| United States | Quarterly | Quarterly | Met | 1 quarter | 31 days | Met | |
| SDDS: Special Data Dissemination Standard. Definitions Periodicity: Frequency of data compilation. Timeliness: The lag between the end of the reference period and the dissemination of data. Source: Table 12, including the performance rating, was derived from information available on the website of the International Monetary Fund (IMF) at http://dsbb.imf.org/Applications/web/sddshome/. The IMF has established the Special Data Dissemination Standard (SDDS) as one of its surveillance standards. The objective of the SDDS is to enhance the data transparency of member countries, to promote development of sound statistical systems and to facilitate access to capital markets. Canada is a signatory to the SDDS, and an annual report on its performance with respect to this standard is available on the IMF website at http://dsbb.imf.org/images/pdfs/AnnualReports/2009/CAN_SDDS_AR2009.pdf. |
|||||||
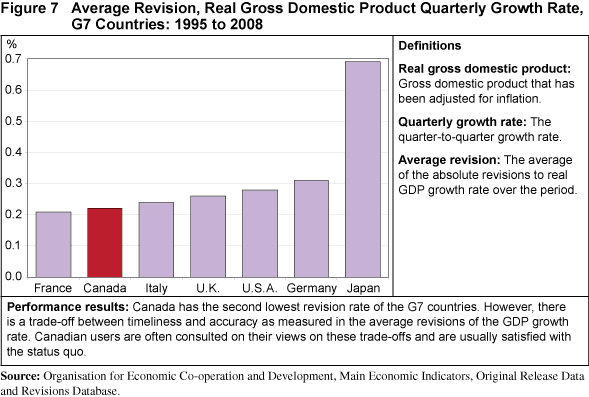
| Performance results: For measurement and dissemination of gross domestic product (GDP) data, Canada meets all of the standards set by the IMF. In fact, according to the annual report for 2009 on observance of the SDDS, “the
quality, coverage, periodicity and timeliness of Canada's economic data are considered to be excellent both in the context of the Article IV consultation and for purposes of ongoing surveillance.” Timeliness is measured as the lag between the end of the reference period and the dissemination of the earliest measures of GDP. Although Canada meets the IMF standard—it releases 60 days after the end of the reference period, 30 days ahead of the IMF limit—it appears to lag behind other G7 countries. This is because Canada releases GDP and the whole National Accounts database at once, providing users with a timely estimate of GDP and, at the same time, helping users understand the overall context. Many other countries, such as the United States, put out early or 'flash' estimates of GDP (the headline variable) and not the associated database. Most other G7 countries release the comprehensive database with a lag of 75 to 90 days from the end of the reference period. |
|||||||
Revisions to economic indicators are a normal consequence of the statistical compilation process. The first publication of quarterly real GDP based on income and expenditure is released approximately 60 days after the reference period, and provides timely information about the economy. These initial estimates are based on data available at the time of the release. However, this information will, at times, be incomplete. The initial estimates are revised or changed in value as increasingly complete source data becomes available. It is important that those initial estimates be reliable or close approximations of the final estimate.
Figure 7 illustrates the average revision to quarterly real GDP growth rate for Canada and other G7 countries, comparing the initial estimate to the latest available.
[D]
Organizational Efficiency
Statistics Canada, in an effort to improve its organizational efficiency, uses administrative data from various sources to reduce response burden.
| Indicator | Current target | 2005/2006 | 2006/2007 | 2007/2008 | 2008/2009 | 2009/2010 | Rating |
|---|---|---|---|---|---|---|---|
| Number of business surveys using tax/administrative data (number) | Continual increase | 30 | 41 | 42 | 43 | 47 | Met all |
| Percentage of business surveys using tax/administrative data (%) | 14 | 19 | 19 | 20 | 22 | Met all | |
| Number of administrative records used in order to reduce survey sizes ('000)1 | 55 | 61 | 2692 | 298 | 303 | Met all | |
| Definition and notes Use of administrative data: The use by Statistics Canada of data from the Canada Revenue Agency and other administrative sources as an alternative to obtaining data directly from respondents. Sometimes called survey data replacement, this reduces the number of questionnaires going to respondents and the associated response burden. 1. This comprehensive new indicator replaces “Contacts avoided because of tax replaced units”. 2. The sharp increase in the number of administrative records used in 2007/2008 reflects the development of a new program designed to make extensive use of tax data to derive a large portion of the estimate combined with a smaller-sized sample survey and therefore minimize response burden. |
|||||||
| Performance Results: The Economic Statistics program activity continued to use more and more administrative data in lieu of questionnaires. | |||||||
| Indicator | Current target | 2005/2006 | 2006/2007 | 2007/2008 | 2008/2009 | 2009/2010 | Rating |
|---|---|---|---|---|---|---|---|
| Index of response burden hours(1991 = 100) | 60 or less | 62 | 62 | 63 | 63 | 68 | Not met |
| Definition Response burden hours: This estimate is calculated annually using the frequency of each survey, the average time to complete the questionnaire and the number of surveyed respondents. Dividing by the estimated number of Canadian businesses gives average burden per establishment. The average is indexed, to a base year of 1991. The calculation excludes the quinquennial Census of Agriculture. |
|||||||
| Performance Results: Response burden has increased slightly in the Economic Statistics program activity in the last few years. This happened because the business community had information needs not covered by administrative data. | |||||||
Canada's Economic Action Plan Initiative
Announced in Budget 2009, Canada's Economic Action Plan (CEAP) provided Statistics Canada with $2.9 million to extend the Canadian Environmental Sustainability Indicators program. In 2009/2010, Statistics Canada delivered survey results and underlying microdata for the Households and the Environment Survey 2007, the Agricultural Water Use Survey 2006, the Industrial Water Survey 2007, and the Survey of Drinking Water Plant 2007. Performance status: Met all — all CEAP deliverables were completed.
Lessons Learned
What worked well
Maintaining quality of statistical outputs requires constant attention. To ensure that all its program components continue to meet the high data-quality standards Canadians expect, Statistics Canada has undertaken several initiatives, including an extensive quality review process. To date, nearly two dozen programs have undergone review, and the process has become an ongoing part of Statistics Canada's activities. This has made Statistics Canada more confident of the robustness and accuracy of its statistical outputs.
Regular interaction with stakeholders at all levels is critical to aligning our programs with highest priority information needs. Statistics Canada cannot determine in isolation what information is required.
What could be improved and what we are doing about it
During the course of the year, it became apparent that even the most knowledgeable stakeholders are not aware of all of the information held by Statistics Canada that is available to meet their information needs. Statistics Canada must do more to improve the effectiveness of its website, and to build knowledge and statistical capacity in the user communities.
Analytical research to support policy development sometimes requires access to statistical analysis based on anonymized personal and business microdata. Statistics Canada is now exploring ways under its legislative framework to expand access to business microdata without compromising its obligations towards respondents to protect their private information.
Businesses value the factual information published by Statistics Canada. In the current economic climate, it is even more critical that Statistics Canada release timely economic statistics and minimize burden on business survey respondents, so it can maintain high levels of collaboration into the future.
2.2 Program Activity 2: Social Statistics
| 2009/2010 Financial resources1 ($ thousands) | 2009/2010 Human resources (FTEs) | ||||
|---|---|---|---|---|---|
| Planned spending | Total authorities | Actual spending | Planned | Actual | Difference |
| 132,585 | 144,751 | 136,495 | 1,716 | 1,450 | 266 |
| 1. Totals may differ within and between tables because of rounding. Amounts shown are net of respendable revenue. | |||||
Overview
This program provides information to decision makers and all Canadians on the social and economic characteristics of individuals, families and households in Canada, and on the major factors that can contribute to their well-being. This program generates key indicators related to the labour market, earnings, pensions, income and expenditures, health, justice and education, as well as information on factors influencing social outcomes. Some indicators also target segments of the Canadian population, such as children, youth, Aboriginal peoples, immigrants, elderly people, and people with activity limitations. Those indicators are used by policy makers to make informed decisions on social issues.
This program also provides information and analysis on the facilities, agencies and systems that are publicly funded to meet Canadians' socioeconomic and physical needs, and on the outcomes of the services that they provide. It encompasses the justice, health and education systems as well as cultural institutions and industries—the program measures the nature and extent of their services and operations, the characteristics of the individual Canadians and families whom they serve and their impacts on Canadian society.
Benefits for Canadians
Timely and accurate information on a broad range of social issues provides decision makers at all levels of government, non-government organizations and academics with essential information for developing policies, managing programs, conducting research, and making decisions that affect individuals, families and households in Canada.
Performance Analysis
| Year | Performance rating | |
|---|---|---|
| Statistics produced by Statistics Canada are available through a wide range of easily accessible media formats and venues. | 2009/2010 | Mostly met |
| 2008/2009 | Met |
| Indicator | Current benchmark/target | 2005/2006 | 2006/2007 | 2007/2008 | 2008/2009 | 2009/2010 | Rating |
|---|---|---|---|---|---|---|---|
| Number of page views of electronic publications ('000) | Annual increase exceeds 5% | 2,417 | 3,003 | 3,210 | 3,962 | 4,304 | Exceeded |
| Annual percentage increase in the number of page views of electronic publications (%) | 30.6 | 24.2 | 6.9 | 23.4 | 8.6 | ||
| Number of print publications sold — accessible on demand (number) | Many | 6,277 | 6,470 | 7,816 | 4,604 | 5,005 | Met all |
| Client satisfaction with price to access data | 4 on a scale of 5 | ... | ... | 3.5 | 3.4 | 3.3 | Not met |
| Client satisfaction with ease of retrieval process | 4 on a scale of 5 | ... | ... | 4.1 | 3.8 | 3.4 | Somewhat met |
| Client satisfaction with convenience of output formats | 4 on a scale of 5 | ... | ... | 4.2 | 4.1 | 4.0 | Met all |
| ... not measured Definitions Number of page views of electronic publications: The number of web pages viewed during visitor sessions on the Statistics Canada website. Number of print publications sold: The number of print copies for which a price was charged. Statistics Canada has moved to free dissemination of electronic versions of publications to encourage broader access. Client satisfaction: These data are derived from the client satisfaction surveys conducted by the Social Statistics program activity. The surveys use measures that are consistent with the common measurement tool in use across the federal government. |
|||||||
| Performance results: The Social Statistics program activity again exceeded its target growth rate for electronic page views by clients. There was also a slight increase in sales of print publications. Overall, clients expressed satisfaction with the convenience of output formats. Clients expressed dissatisfaction with ease of retrieval and with respect to price. The latter constitutes a barrier to access. Statistics Canada is reviewing its dissemination model with a view to having more data available to the public free of charge. | |||||||
| Year | Performance rating | |
|---|---|---|
| Canadians are aware of the availability of these statistics and of their high quality, and of the professionalism and non-partisanship of Statistics Canada. | 2009/2010 | Met all |
| 2008/2009 | Met |
Key factors to ensure that the statistical information produced by Statistics Canada can be trusted are relevance and data quality, which include international comparisons.
| Indicator | Current benchmark/target | 2005/2006 | 2006/2007 | 2007/2008 | 2008/2009 | 2009/2010 | Rating |
|---|---|---|---|---|---|---|---|
| Number of data series downloaded from the CANSIM online database ('000) | Annual increase exceeds 5% | 8,202 | 11,879 | 12,114 | 14,159 | 16,063 | Exceeded |
| Annual percentage increase in the number of data series downloaded from the CANSIM online database (%) | 32.0 | 44.8 | 2.0 | 16.9 | 13.4 | ||
| Client satisfaction with Statistics Canada's ability to meet their needs | 4 on a scale of 5 | ... | ... | 4.1 | 4.0 | 3.9 | Mostly met |
| ... not measured Definitions Data series downloaded from the online database: Data series downloaded by external users from CANSIM, Statistics Canada's online database. Client satisfaction: These data are derived from the client satisfaction surveys conducted by the Social Statistics program activity. The surveys use measures that are consistent with the common measurement tool in use across the federal government. |
|||||||
| Performance results: The Social Statistics program activity saw strong growth in the number of tables downloaded from Statistics Canada's CANSIM online database. Table downloads require deliberate action on the part of clients, demonstrating the relevance of these data. | |||||||
| Indicator | Current target | 2005/2006 | 2006/2007 | 2007/2008 | 2008/2009 | 2009/2010 | Rating |
|---|---|---|---|---|---|---|---|
| % | |||||||
| Percentage of major statistical outputs released as planned | 100 | 100 | 100 | 100 | 100 | 100 | Met all |
| Percentage of major statistical outputs whose sampling accuracy is within set objectives | 95.0 | ... | 98.7 | 98.6 | 99.1 | 99.7 | Exceeded |
| Percentage of reloads | Less than 2.5 | ... | ... | 4.1 | 2.2 | 2.1 | Exceeded |
| ... not measured Definitions Major statistical outputs released as planned: Each year, Statistics Canada publishes the planned release dates for major statistical outputs for the coming year on its website. These outputs and their release dates can be accessed at http://www.statcan.gc.ca/release-diffusion/index-eng.htm. Major statistical outputs whose sampling accuracy is within set objectives: Most surveys are based on statistical sampling. Sampling is an important means of achieving timely and cost-effective results. At the same time, estimates based on sampling can be expected to vary from sample to sample, and to differ from those that would result from a complete census. Sampling accuracy objectives are set on a survey-by-survey basis. Reloads: Outputs that require correction after release. In 2008, Statistics Canada began an ongoing process of monitoring the quality of its data releases to reduce the risk of errors found after official release. |
|||||||
| Performance results: All major statistical outputs from the Social Statistics program activity were released on time, adhering to the pre-established release schedule, and in accordance with accuracy targets. | |||||||
International Comparison of Unemployment Data
Table 19 presents information on the periodicity and timeliness of unemployment data.
| G7 country | Benchmark | Periodicity | Timeliness | ||||
|---|---|---|---|---|---|---|---|
| SDDS | Result | Rating | SDDS | Result | Rating | ||
| Canada | Meet SDDS requirements | Quarterly | Monthly | Met | 1 quarter | 2 weeks | Met |
| France | Quarterly | Quarterly | Met | 1 quarter | Not later than 10 weeks | Met | |
| Germany | Quarterly | Monthly | Met | 1 quarter | 1 month | Met | |
| Italy | Quarterly | Quarterly | Met | 1 quarter | Not later than 1 quarter | Met | |
| Japan | Quarterly | Monthly | Met | 1 quarter | 1 month | Met | |
| United Kingdom | Quarterly | Monthly | Met | 1 quarter | 5 weeks | Met | |
| United States | Quarterly | Monthly | Met | 1 quarter | 3 weeks—not later than 1 month | Met | |
| SDDS: Special Data Dissemination Standard. Definitions Periodicity: This refers to frequency of data compilation. Timeliness: This refers to the lag between the end of the reference period and the dissemination of data. Source: Table 19, including the performance rating, was derived from information available on the website of the International Monetary Fund (IMF) at http://dsbb.imf.org/Applications/web/sddshome/. The IMF has established the Special Data Dissemination Standard (SDDS) as one of its surveillance standards. The objective of the SDDS is to enhance the data transparency of member countries, to promote development of sound statistical systems and to facilitate access to capital markets. Canada is a signatory to the SDDS, and an annual report on its performance with respect to this standard is available on the IMF website at http://dsbb.imf.org/images/pdfs/AnnualReports/2009/CAN_SDDS_AR2009.pdf. |
|||||||
| Performance results: Canada met or exceeded all the SDDS quarterly periodicity and timeliness requirements. | |||||||
Organizational Efficiency
In 2009/2010, the Social Statistics program activity undertook a number of initiatives to enhance organizational efficiency. Among the most significant of these was continued progress on a multi-year plan to streamline processes and systems for the collection and processing of survey data. The first of these integrated systems providing common processing tools will be operational by the end of 2010/2011. As well, concepts and definitions have been harmonized for a large number of core variables and are being implemented across the social surveys.
Lessons Learned
What worked well
The first nine years of operation of the Research Data Centre Network have exceeded all expectations. Conceived to offer academic researchers access to Statistics Canada's longitudinal microdata files through secure centres in six universities, the network has to date provided access to over 150 social survey files, census data and administrative files to almost 2,000 researchers in 24 centres across Canada. Building on this solid foundation, a remote microdata access application called Real Time Remote Access is being developed. This new application will automatically process the data and verify the results to ensure that confidential information is not disclosed. These are two examples of how the Microdata Access program is contributing significantly to the access and quality of Statistics Canada information.
The Content Harmonization Initiative is coming to a very successful conclusion. This project has developed standardized treatment for a number of concepts and variables used in the Social Statistics program. These include family, household, language and income. These standards will be implemented in all agency social surveys to improve coherence across survey results and introduce efficiencies in survey design.
Statistics Canada reached agreement with its partner, Human Resources and Skills Development Canada, to consolidate the two major occupational classifications into a single national classification. This is a considerable advance toward coherent occupational statistics across the Government of Canada.
What could be improved and what we are doing about it
An ongoing threat to the quality of Statistics Canada data is the increasing difficulty collecting it. The active lifestyles of Canadian families make it harder to contact them at home. As well, more households have only cellphones, or use Internet phones. All of this makes it more costly to maintain response rates. Without further efforts in survey collection, response rates and quality will decline. Statistics Canada is streamlining its collection functions to generate efficiencies in processes and systems that can be re-invested in maintaining response rates and data quality.
Statistics Canada will endeavour to improve communication with users about the data available on its website, and to ensure that these data are organized in a user-friendly and easy-to-access manner.
On the international front, Statistics Canada is involved in discussions on gaps for the measurement of societal well-being. This includes both a conceptual framework and the development of data in the areas of economic resources, quality of life and sustainability. Statistics Canada will continue to work with federal and international partners on this initiative.
2.3 Program Activity 3: Census, Demography and Aboriginal Statistics
| 2009/2010 Financial resources1 ($ thousands) | 2009/2010 Human resources (FTEs) | ||||
|---|---|---|---|---|---|
| Planned spending | Total authorities | Actual spending | Planned | Actual | Difference |
| 78,669 | 100,325 | 93,146 | 889 | 968 | (79) |
| 1. Totals may differ within and between tables because of rounding. Amounts shown are net of respendable revenue. | |||||
Overview
The census program, conducted on a five-year cycle, has two components. The census proper consists of a small number of primarily demographic questions, which are asked of 100% of Canadian households. Concurrent with the census, Statistics Canada also conducts a large-scale sample survey to collect a variety of socioeconomic and cultural information on the population. In the 2006 Census, the most recent completed, the sample survey went to one in every five households. Planning is underway for the 2011 Census.
The census program's many activities provide statistical information on the Canadian population, its demographic characteristics and conditions, and changes over time. It provides needed detailed information on subgroups of the population and for small geographic areas. Population counts and estimates are required to determine electoral boundaries, the distribution of federal transfer payments, and the transfer and allocation of funds among regional and municipal governments, school boards and other local agencies within provinces. This program also provides information on the socioeconomic conditions and well-being of Aboriginal peoples. Further, the census provides an anchor point—a benchmark—on which survey estimates are calibrated for accuracy and consistency purposes.
Also every five years, the Census of Agriculture provides data on the number and types of farms; farm operators; commodities grown; animals raised; business operating arrangements; land and land management practices; capital investments; farm vehicles, machinery and equipment; and hired agricultural labour.
Benefits for Canadians
Census Program
Decennial census data are constitutionally required for determining the number and boundaries of federal electoral districts.
Further, the demographic, social and economic data that the census program collects on the Canadian population are needed to meet the priority information needs of government and the private sector. The census program provides unique and essential data for the following:
- learning about populations that are key targets of government policy (e.g., recent immigrants; visible minorities; people with disabilities; Aboriginal peoples, including First Nations communities; ethnic, religious and language minorities; seniors and youth)
- supporting provincial/territorial and local government planning and program delivery, as it provides detailed small-area information to monitor progress on issues such as rural population decline, infrastructure-related investments by all levels of government and the changing makeup of neighbourhoods
- designing surveys that provide estimates of monthly employment, family incomes and expenditures, and other topics of concern to government, industry, labour and the general public
- analysing social and economic issues, such as skills shortage and integration of immigrants
- reviewing the effectiveness of current legislation.
Demography Statistics
During the intercensal period, population estimates are required to meet various legislative requirements, such as the Canada Health Transfer, the Canada Social Transfer, the Wait Times Reduction Transfer, the Equalization Formula and the Territorial Formula Financing, which together amounted to over $60 billion in 2009/2010. Population estimates are produced annually and quarterly by province and territory. Demographic projections are derived every five years, following the census, using various assumptions on population fertility, mortality and migration to define potential growth scenarios.
Aboriginal Statistics
Results from the 2006 Aboriginal Peoples Survey complement census data, providing a snapshot of the socioeconomic, cultural and health conditions of Métis, Inuit, and First Nations people living off-reserve. Similarly, the results of the 2006 Aboriginal Children's Survey address a data gap and provide decision makers with much-needed indicators of the early childhood development and well-being of Aboriginal children living off-reserve.
Significant data gaps exist, however, for the on-reserve population. Statistics Canada is working with Indian and Northern Affairs Canada in its efforts to develop strategies to fill these gaps.
Census of Agriculture
Direct federal and provincial payments to the agriculture sector in recent years have been approximately $5 billion annually. The Census of Agriculture is critical for the development and evaluation of the underlying programs and policies related to food supply and safety, the environment, renewal, science and innovation, and business risk management. It contributes both directly with data and indirectly with its support of the annual agricultural statistics program. The Census of Agriculture provides a comprehensive source of data that is the foundation for the analysis of the agriculture and agri-food industry undertaken by federal and provincial departments.
Users of Census of Agriculture data go beyond federal, provincial and municipal governments. Local-level organizations and agencies (e.g., conservation authorities), associations that directly represent farmers (e.g., the Canadian Federation of Agriculture and the National Farmers Union), academics (e.g., sociologists, economists and agronomists), specialized agriculture media and the general media all use Census of Agriculture data.
Performance Analysis
| Year | Performance rating | |
|---|---|---|
| Statistics produced by Statistics Canada are available through a wide range of easily accessible media formats and venues. | 2009/2010 | Met all |
| 2008/2009 | Met |
| Indicator | Current benchmark/target | 2005/2006 | 2006/2007 | 2007/2008 | 2008/2009 | 2009/2010 | Rating |
|---|---|---|---|---|---|---|---|
| Number of page views of electronic publications ('000) | Annual increase exceeds 5% | 288 | 344 | 5111 | 6301 | 666 | Met all |
| Annual percentage increase in the number of page views of electronic publications (%) | 40.5 | 19.4 | 48.5 | 23.3 | 5.7 | ||
| Number of print publications sold — accessible on demand (number) | Many | 1,892 | 2,208 | 2,037 | 1,726 | 1,291 | |
| 1. Revised from the 2008/2009 Departmental Performance Report. Definitions Number of page views of electronic publications: The number of web pages viewed during visitor sessions on the Statistics Canada website. Number of print publications sold: The number of print copies for which a price was charged. Statistics Canada has moved to free dissemination of electronic versions of publications to encourage broader access. |
|||||||
| Performance results: The Census, Demography and Aboriginal Statistics program activity exceeded its target growth rate for electronic page views by clients. In accordance with Statistics Canada's strategy, there was a corresponding shift away from print publications. | |||||||
| Year | Performance rating | |
|---|---|---|
| Canadians are aware of the availability of these statistics and of their high quality, and of the professionalism and non-partisanship of Statistics Canada. | 2009/2010 | Mostly met |
| 2008/2009 | Met |
Key factors to ensure that the statistical information produced by Statistics Canada can be trusted are relevance and data quality, which include international comparisons.
| Indicator | Current benchmark/target | 2005/2006 | 2006/2007 | 2007/2008 | 2008/2009 | 2009/2010 | Rating |
|---|---|---|---|---|---|---|---|
| Number of data series downloaded from the CANSIM online database ('000) | Annual increase exceeds 5% | 1,862 | 2,184 | 1,7931 | 1,861 | 1,721 | Not met |
| Annual percentage increase in the number of data series downloaded from the CANSIM online database (%) | 31.2 | 17.3 | (17.9) | 3.8 | (7.5) | ||
| 2006 Census of Population Dissemination Program revenue ($ millions) | Planned revenue | ... | ... | 2.4 | 4.1 | 3.1 | Met all |
| Actual revenue | ... | ... | 3.7 | 5.6 | 3.1 | ||
| ... not applicable 1. Revised from the 2008/2009 Departmental Performance Report. Definition Data series downloaded from the online database: Data series downloaded by external users from Statistics Canada's CANSIM online database. |
|||||||
| Performance results: The Census of Population, currently preparing for the 2011 Census, experienced a slight decline in the number of tables downloaded from its online database. This is typical of the level of demand at this point in the census cycle. Actual revenues associated with the Census of Population Dissemination Program met planned revenue as a result of the strong demand by users for custom tabulations that meet their individual and business information needs. Similarly, revenues generated as a result of sales through a network of secondary distributors of census data were also very strong—another indication of the relevance of the data. |
|||||||
| Indicator / International comparison | 2001 | 2006 |
|---|---|---|
| Net census undercoverage1 | ||
| Canada (%) | 2.99 | 2.80 |
| United States (2000 census) (%) | 2.31 | ... |
| Canada's position | Slightly worse | ... |
| Response rates | ||
| Canada – planned (%) | 98.0 | 98.0 |
| Canada – actual (%) | 98.3 | 96.5 |
| Rating | Met | Not met |
| Census outputs released as planned | ||
| Percentage of census outputs released as per the pre-announced schedule | 100 | 100 |
| Rating | Met | Met |
| ... not applicable 1. The target is that this be as low as possible. Definitions Net census undercoverage: The number of people missed less the number of people counted more than once. Following each census since the 1961 Census, the reverse record check (RRC) has been carried out to measure census population undercoverage. The RRC estimates the number of people missed in the census. This estimate is combined with the estimate from the census overcoverage study of the number of people enumerated more than once to calculate net undercoverage. Response rates: The accuracy of the data disseminated by Statistics Canada is directly related to the accuracy of the data provided by the respondents to its surveys or censuses. It follows that an important indication of accuracy is the percentage of respondents asked to provide data who actually do so. Generally, the higher the response rate, the greater the accuracy of the census results. Census outputs released as planned: The planned release dates for Census of Population data that Statistics Canada publishes on its website. These outputs and their release dates can be accessed at http://www12.statcan.gc.ca/census-recensement/2006/rt-td/index-eng.cfm. |
||
| Performance results: For the Census of Population, response rates are lower than in 2001, and are lower than planned. This is consistent with the change in response generally in survey-taking activities. All census outputs were released on time, adhering to the pre-established release schedule, and net undercoverage has improved since 2001. | ||
| Indicator / International comparison | 2001 | 2006 |
|---|---|---|
| Net census undercoverage – number of farms | ||
| Canada (%) | 5.60 | 3.40 |
| United States (2002 and 2007 censuses) (%) | 17.90 | 16.24 |
| Canada's position | Better | Better |
| Net census undercoverage – total farm area | ||
| Canada (%) | 1.90 | 1.30 |
| United States (2002 and 2007 censuses) (%) | 2.40 | 3.33 |
| Canada's position | Better | Better |
| Response rates | ||
| Canada (%) | 98.0 | 96.0 |
| United States (2002 and 2007 censuses) (%) | 88.0 | 85.0 |
| Canada's position | Better | Better |
| Definitions Net census undercoverage – number of farms: The number of farms missed by the census less the number of farms counted more than once. Net census undercoverage – total farm area: The total farm area missed by the census less the total farm area counted more than once. Response rates: The accuracy of the data disseminated by Statistics Canada is directly related to the accuracy of the data provided by the respondents to its surveys or censuses. It follows that an important indication of accuracy is the percentage of respondents asked to provide data who actually do so. Generally, the higher the response rate, the greater the accuracy of the census results. |
||
| Performance results: Response rates and net undercoverage compared favourably with corresponding measures for the United States. | ||
Organizational Efficiency
| Indicator / International comparison | 2006 | 2011 |
|---|---|---|
| $ Canadian | ||
| Cost per dwelling of conducting the Census of Population | ||
| Canada | 45.31 | 41.78 |
| Australia | 42.881 | 44.191 |
| United States (2010 census) | ... | 114.872 |
| Canada's position | Worse | Better |
| ... not applicable 1. Converted from Australian dollars on July 8, 2010, at a rate of 1 AUD = 0.9091 CAD, as per Bank of Canada at http://www.bankofcanada.ca/en/rates/exchform.html. 2. Converted from U.S. dollars on July 8, 2010, at a rate of 1 USD = 1.0446 CAD, as per Bank of Canada at http://www.bankofcanada.ca/en/rates/exchform.html. Definition Cost per dwelling: The total cost divided by the total number of dwellings. For 2011, this is an estimate. |
||
| Performance results: The 2006 Census underwent a significant methodological change that required a one-time investment of $35.4 million. The cost per dwelling including this investment was $45.31. The cost per dwelling in the 2011 Census is $41.78. In comparison to the 2006 Census, this represents a reduction of $3.53 (7.8%) per dwelling, or $51.7 million. | ||
2011 Census of Population
The 2011 Census will capitalize on major changes introduced for the 2006 Census. These include an option for Canadians to respond to the census online, automated editing and data capture technologies and greater centralization of operational activities. For the 2011 Census, Statistics Canada plans to leverage heavily on the approaches and systems developed for the 2006 Census, and pursue a re-use strategy.
In fiscal year 2009/2010, work on the development and implementation phase of the 2011 Census continued. Statistics Canada tested key census processes, systems, and planning assumptions in the integrated end-to-end Census Test, which was conducted in May 2009. Test findings were incorporated in the development of operational infrastructure and materials.
Lessons Learned
What worked well
As part of the preparations for the 2011 Census of Population, a test was conducted in May 2009, consisting of 125,000 households. The objectives of the test were to fully exercise systems, procedures and processes, as well as enhancements to improve areas that were problematic in 2006, and to validate major changes.
The test met its main objectives:
- evaluate the questionnaire to ensure relevant, good quality results
- test a new multi-wave collection approach aimed at increasing overall Internet response uptake while minimizing non-response
- test systems, procedures and processes to address issues encountered in the field during the 2006 Census (recruitment approaches, timely field/management communications).
Results of the test were used to validate assumptions and make required adjustments prior to the implementation phase of the 2011 Census. The 2009 Census Test was successful in demonstrating that these initiatives, among others, worked well and, with lessons learned, can be scaled up to the volumes required for the 2011 Census.
What could be improved and what we are doing about it
For the Census of Agriculture, issues identified during the Census Test will be resolved prior to the Census in 2011. These include
- labelling for mailings to operators of more than one farm
- recalibration of the scanners that capture data from questionnaires in order to increase both the quantity of throughput and quality of the resulting captured data
- minor adjustments to the systems related to the Census Help Line.
2.4 Program Activity 4: Internal Services
| 2009/2010 Financial resources1 ($ thousands) | 2009/2010 Human resources (FTEs) | ||||
|---|---|---|---|---|---|
| Planned spending | Total authorities | Actual spending | Planned | Actual | Difference |
| 77,566 | 91,847 | 89,323 | 874 | 948 | (74) |
| 1. Totals may differ within and between tables because of rounding. Amounts shown are net of respendable revenue. | |||||
Overview
Internal Services are activities that enable all of the agency's operations. These activities help Statistics Canada carry out its mandated functions and advance its strategic outcome.
Internal Services comprises groups of activities and resources that are administered to support the needs of programs and other corporate obligations of the organization: management and oversight services; communications services; legal services; human resource management services; financial management services; information management services; real property services; materiel services; acquisition services; and travel and other administrative services.
Benefits to Canadians
Statistics Canada provides access to a trusted source of information. In support of the agency's strategic outcome, our human resources, information technology, and other horizontal management areas must be fully integrated to ensure that our Economic Statistics, Social Statistics, and Census, Demography and Aboriginal Statistics programs have the guidance, infrastructure, and resources needed for successful delivery.
Performance Analysis
| Indicator | Current target | 2008/2009 | 2009/2010 | Rating |
|---|---|---|---|---|
| Rating on 21 areas of management, as defined in the Management Accountability Framework | Obtain rating of 'strong' or 'acceptable' in most areas of management | Rated 'strong' or 'acceptable' in all but two areas of management | Rated 'strong' or 'acceptable' in all but one area of management | Met all |
| Definition Management Accountability Framework: This is an annual evaluation of departments conducted by the Treasury Board Secretariat measuring 21 areas of management. This independent evaluation is an indicator of the efficiency of an organization's modern management practices. |
||||
| Performance results: Statistics Canada improved its rating regarding quality of its management. | ||||
| Indicator | Current target | Performance summary | Rating |
|---|---|---|---|
| Financial reports to Policy Committee provided as planned | Monthly |
|
Met all |
| Efficient and effective financial management service is delivered, based on a solid organizational foundation consisting of sound business practices, processes, systems and people | Adherence to Treasury Board Secretariat policies related to financial management |
|
Met all |
| Efficient and effective governance and strategic directions | Adherence to Management Accountability Framework standards related to governance and strategic directions |
|
Met all |
| Definitions Financial reports to Policy Committee provided as planned: Reporting by the agency's financial management services to the agency's executive committee. This is scheduled to occur monthly. Efficiency and effectiveness: These relate to the implementation of financial management initiatives and the Management Accountability Framework, which is an annual evaluation of departments conducted by the Treasury Board Secretariat. |
|||
| Performance results: Statistics Canada met all its financial management targets. | |||
| Indicator | Current target | Performance summary | Rating |
|---|---|---|---|
| Rating on Departmental Staffing Accountability Report (DSAR) | Improve on results from 2008 DSAR |
Overall rating improved to “strong”. All indicators were rated acceptable or strong. Specifically, improvements were noted in the following areas:
|
Met all |
| Public Service Employee Survey (PSES) 2008 – response rate compared with 2005 | Improvement | The 2008 response rate of 86.3% is an increase of 6.1 percentage points compared to PSES 2005. | Met all |
| Public Service Employee Survey 2008 – response rate compared with other departments | Above others | The 86.3% response rate is the highest response rate of the large departments and is well above the Public Service rate of 61.2%. | Exceeded |
| Public Service Employee Survey 2008 – results | Rank among the best in comparison with other federal government departments | Statistics Canada was rated as highly as or higher than other federal departments on job satisfaction, satisfaction with the organization and commitment to the organization: 61% of employees (20 percentage points higher than the Public Service as a whole) agreed that management had made progress resolving issues raised in the 2005 survey. Two-thirds of employees (19 percentage points higher than the Public Service as a whole) agreed that management will try to resolve concerns raised in this survey. | Exceeded |
| Definitions Departmental Staffing Accountability Report: An annual report provided by organizations to the Public Service Commission concerning the management and results of departmental/agency staffing. Public Service Employee Survey (PSES): A public service-wide survey that provides a snapshot of the views of employees about the organizations and units in which they work. The PSES also supports Public Service Renewal. By providing information on demographics, skills, career expectations and concerns of public service employees, it enables deputy heads to identify emerging human resources challenges and needs in their organizations. The ultimate outcome is ensuring that Canadians are served by a dynamic and effective Public Service now and into the future. |
|||
| Performance Results: Statistics Canada met or exceeded its targets in all human resources activities. | |||
Canada's Economic Action Plan Initiative
Announced in Budget 2009, Canada's Economic Action Plan (CEAP) provided Statistics Canada with $0.2 million to enhance federal public service student employment. Performance status: Met all — all CEAP deliverables were completed.
Lessons Learned
What worked well
The agency undertook ambitious work to strengthen the effectiveness of its internal audit function, the quality of performance reporting, the effectiveness of its information technology management and the effectiveness of the organizational contribution to government-wide priorities. This work was very successful, as indicated by the MAF scores for these areas of management. Internal audit and performance reporting went from 'opportunity for improvement' to 'acceptable'. The organizational contribution to government-wide priorities and the management of information technology went from 'acceptable' to 'strong'. In all, 13 areas of management were assessed in the current round: 4 improved, 1 declined, 6 were unchanged and 2 cannot be compared.
What could be improved and what we are doing about it
As described in Section 1, Information Management (MAF area of management 12) declined from 'acceptable' to 'opportunity for improvement'. This activity is considered fundamental to the mandate of Statistics Canada. The main reason for the decline is that the organization had an Information Management (IM) strategy with an accompanying action plan that was still in draft form at the time of the assessment. The draft action plan identified proposed initiatives and leads for each of the priorities; however, it did not include milestones, timelines and resources. The recommendation is therefore that “Statistics Canada should finalize and seek management approval for its IM Strategy and action plan, begin implementation, and ensure that appropriate governance structures and performance measurements are in place to monitor the progress of the strategy.”
Section 3 Supplementary Information
3.1 Financial Highlights
The financial highlights presented within this DPR are intended to serve as a general overview of Statistics Canada's financial position and operations. Financial statements can be found at http://www.statcan.gc.ca/dpr-rmr/2009-2010/financ-eng.htm.
Table 30 Financial Highlights
| Condensed Statement of Financial Position For the year ended March 31, 2010 |
% change | 2010 | 20091 |
|---|---|---|---|
| Assets | |||
| Total assets | (5.0) | 206,706 | 217,605 |
| Total | (5.0) | 206,706 | 217,605 |
| Liabilities | |||
| Total liabilities | (19.1) | 159,559 | 197,226 |
| Equity | |||
| Total equity | 131.4 | 47,147 | 20,379 |
| Total | (5.0) | 206,706 | 217,605 |
| Condensed Statement of Operations For the year ended March 31, 2010 |
% change | 2010 | 20091 |
|---|---|---|---|
| Expenses | |||
| Total expenses | (2.0) | 657,497 | 670,680 |
| Revenues | |||
| Total revenues | (15.7) | 102,193 | 121,295 |
| Net cost of operations | 1.1 | 555,304 | 549,385 |
Notes: The departmental financial statements and associated highlights have been prepared on an accrual accounting basis and, therefore, differ from the figures presented in previous sections, which are based on authorities voted by Parliament on a modified cash basis. Note 3 of the financial statements provides a reconciliation of accrual-to-cash accounting methods.
Totals may differ within and between tables because of rounding.
1. To maintain consistency and comparability, the 2009 figures above have been restated to incorporate Treasury Board Accounting Standard (TBAS) 1.2, as used in the 2009/2010 financial statements. For this reason, the 2009 figures in this table differ from the figures in the 2009 Condensed Statement of Financial Position reported in the 2008/2009 Departmental
Performance Report.
Figure 8 Assets by Type
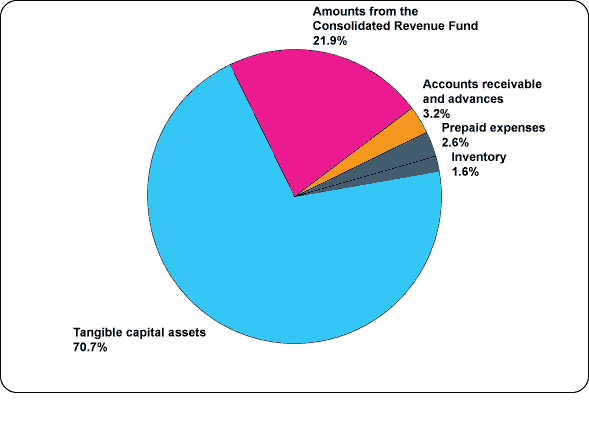
[D]
Total assets were $207 million at the end of 2009/2010, a decrease of $11 million, or 5.0%, over the previous year's total of $218 million. Tangible capital assets, composed mainly of informatics hardware ($26 million), software ($54 million) and software under development ($53 million), represent the largest portion of assets at $146 million, or 70.7% of the total. The remaining 29.3% is composed of amounts from the consolidated Revenue Fund (21.9%), accounts receivable and advances (3.2%), prepaid expenses (2.6%) and inventory (1.6%).
Figure 9 Liabilities by Type
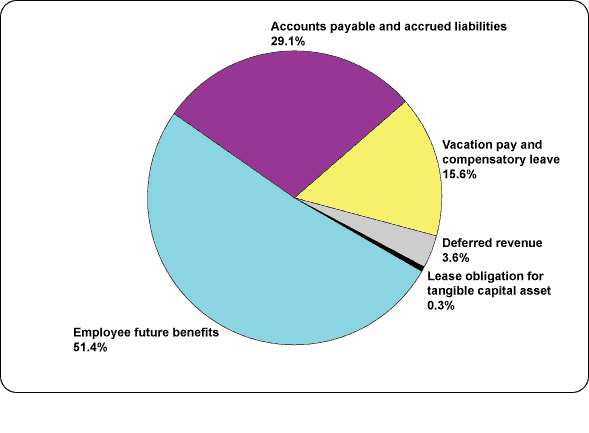
[D]
Total liabilities were $160 million at the end of 2009/2010, down $37 million, or 19.1% from the previous year's total of $197 million. Employee future benefits represents the largest portion of the liabilities at $82 million, or 51.4% of the total (down by $33 million year over year because of timing of salary where no accrual was required in 2009/2010). Accounts payable and accrued liabilities is the next largest portion at $46 million or 29.1% of the total, and is composed of accrued salaries and wages ($5 million), accounts payable external parties ($25 million) and accounts payable to other federal government departments and agencies ($16 million).
Figure 10 Revenues—Where Funds Come From
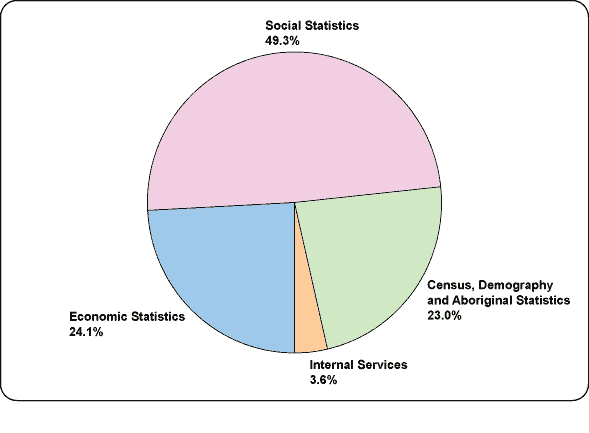
[D]
The agency's total revenues amounted to $102 million for 2009/2010, a decrease of $19 million, or 15.7%, from the previous year's revenue of $121 million, in large part because of a change in funding mechanism where $10 million previously received as cost-recovery revenue is now included in the base budget, and an $8 million reduction in requests for information from other government departments. The Social Statistics program generated $50 million (49.3%); the Economic Statistics program, $25 million (24.1%); the Census, Demography and Aboriginal Statistics program, $23 million (23.0%); and Internal Services, $4 million (3.6%).
Figure 11 Expenses—Where Funds Go
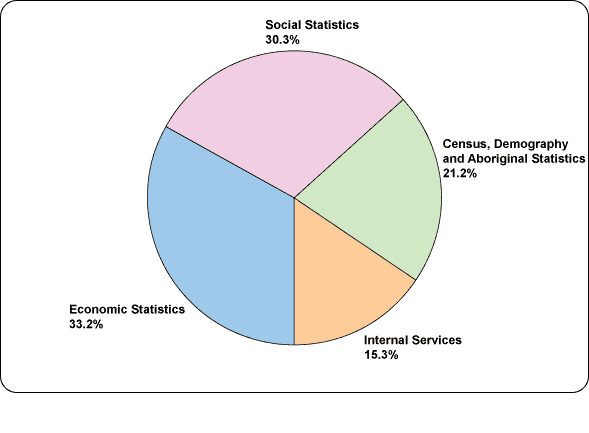
[D]
Total expenses, including respendable revenue and services provided without charge by other government departments, were $657 million in 2009/2010, down $14 million, or 2.0%, from $671 million the previous year. The Economic Statistics program accounted for $218 million (33.2%); the Social Statistics program, $199 million (30.3%); the Census, Demography and Aboriginal Statistics program, $139 million (21.2%); and Internal Services, $101 million (15.3%).
3.2 List of Supplementary Information Tables
All electronic supplementary information tables found in the 2009/2010 Departmental Performance Report can be found on the Treasury Board of Canada Secretariat's website at: http://www.tbs-sct.gc.ca/dpr-rmr/st-ts-eng.asp.
-
Sources of Respendable and Non-respendable Revenue
-
User Fees
-
Green Procurement
-
Response to Parliamentary Committees and External Audits
- Internal Audits and Evaluations