Common menu bar links
Breadcrumb Trail
ARCHIVED - Statistics Canada - Report
 This page has been archived.
Archived Content
Information identified as archived on the Web is for reference, research or recordkeeping purposes. It has not been altered or updated after the date of archiving. Web pages that are archived on the Web are not subject to the Government of Canada Web Standards. As per the Communications Policy of the Government of Canada, you can request alternate formats on the "Contact Us" page.
Section 3 Supplementary Information
3.1 Financial Highlights
The financial highlights presented within this DPR are intended to serve as a general overview of Statistics Canada's financial position and operations. Financial statements can be found at http://www.statcan.gc.ca/dpr-rmr/2009-2010/financ-eng.htm.
Table 30 Financial Highlights
| Condensed Statement of Financial Position For the year ended March 31, 2010 |
% change | 2010 | 20091 |
|---|---|---|---|
| Assets | |||
| Total assets | (5.0) | 206,706 | 217,605 |
| Total | (5.0) | 206,706 | 217,605 |
| Liabilities | |||
| Total liabilities | (19.1) | 159,559 | 197,226 |
| Equity | |||
| Total equity | 131.4 | 47,147 | 20,379 |
| Total | (5.0) | 206,706 | 217,605 |
| Condensed Statement of Operations For the year ended March 31, 2010 |
% change | 2010 | 20091 |
|---|---|---|---|
| Expenses | |||
| Total expenses | (2.0) | 657,497 | 670,680 |
| Revenues | |||
| Total revenues | (15.7) | 102,193 | 121,295 |
| Net cost of operations | 1.1 | 555,304 | 549,385 |
Notes: The departmental financial statements and associated highlights have been prepared on an accrual accounting basis and, therefore, differ from the figures presented in previous sections, which are based on authorities voted by Parliament on a modified cash basis. Note 3 of the financial statements provides a reconciliation of accrual-to-cash accounting methods.
Totals may differ within and between tables because of rounding.
1. To maintain consistency and comparability, the 2009 figures above have been restated to incorporate Treasury Board Accounting Standard (TBAS) 1.2, as used in the 2009/2010 financial statements. For this reason, the 2009 figures in this table differ from the figures in the 2009 Condensed Statement of Financial Position reported in the 2008/2009 Departmental
Performance Report.
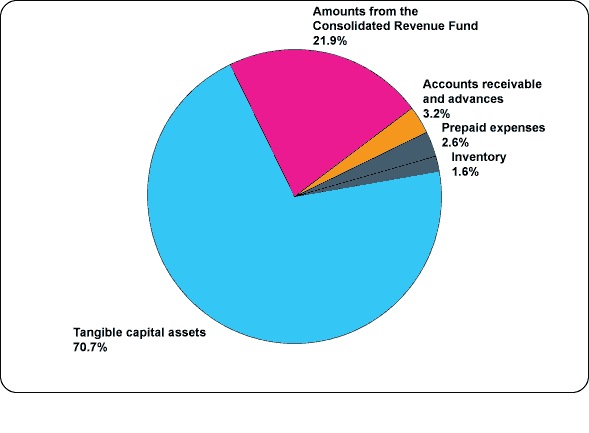
Figure 8 Assets by Type

[D]
Total assets were $207 million at the end of 2009/2010, a decrease of $11 million, or 5.0%, over the previous year's total of $218 million. Tangible capital assets, composed mainly of informatics hardware ($26 million), software ($54 million) and software under development ($53 million), represent the largest portion of assets at $146 million, or 70.7% of the total. The remaining 29.3% is composed of amounts from the consolidated Revenue Fund (21.9%), accounts receivable and advances (3.2%), prepaid expenses (2.6%) and inventory (1.6%).
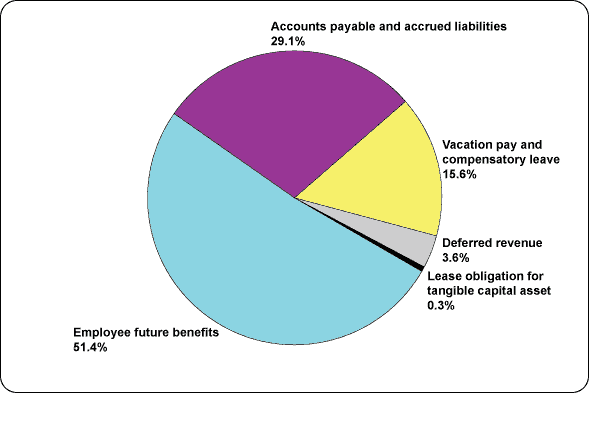
Figure 9 Liabilities by Type

[D]
Total liabilities were $160 million at the end of 2009/2010, down $37 million, or 19.1% from the previous year's total of $197 million. Employee future benefits represents the largest portion of the liabilities at $82 million, or 51.4% of the total (down by $33 million year over year because of timing of salary where no accrual was required in 2009/2010). Accounts payable and accrued liabilities is the next largest portion at $46 million or 29.1% of the total, and is composed of accrued salaries and wages ($5 million), accounts payable external parties ($25 million) and accounts payable to other federal government departments and agencies ($16 million).
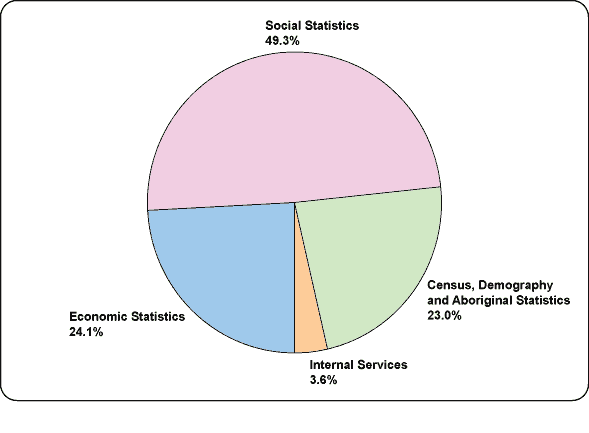
Figure 10 Revenues—Where Funds Come From

[D]
The agency's total revenues amounted to $102 million for 2009/2010, a decrease of $19 million, or 15.7%, from the previous year's revenue of $121 million, in large part because of a change in funding mechanism where $10 million previously received as cost-recovery revenue is now included in the base budget, and an $8 million reduction in requests for information from other government departments. The Social Statistics program generated $50 million (49.3%); the Economic Statistics program, $25 million (24.1%); the Census, Demography and Aboriginal Statistics program, $23 million (23.0%); and Internal Services, $4 million (3.6%).
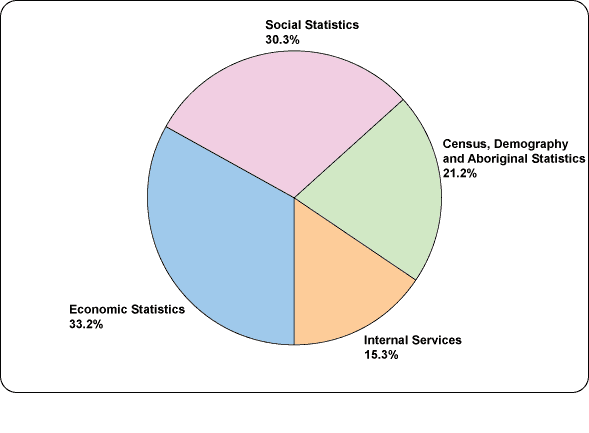
Figure 11 Expenses—Where Funds Go

[D]
Total expenses, including respendable revenue and services provided without charge by other government departments, were $657 million in 2009/2010, down $14 million, or 2.0%, from $671 million the previous year. The Economic Statistics program accounted for $218 million (33.2%); the Social Statistics program, $199 million (30.3%); the Census, Demography and Aboriginal Statistics program, $139 million (21.2%); and Internal Services, $101 million (15.3%).
3.2 List of Supplementary Information Tables
All electronic supplementary information tables found in the 2009/2010 Departmental Performance Report can be found on the Treasury Board of Canada Secretariat's website at: http://www.tbs-sct.gc.ca/dpr-rmr/st-ts-eng.asp.
-
Sources of Respendable and Non-respendable Revenue
-
User Fees
-
Green Procurement
-
Response to Parliamentary Committees and External Audits
- Internal Audits and Evaluations
