ARCHIVED - Public Service Commission of Canada - Report
 This page has been archived.
Archived Content
Information identified as archived on the Web is for reference, research or recordkeeping purposes. It has not been altered or updated after the date of archiving. Web pages that are archived on the Web are not subject to the Government of Canada Web Standards. As per the Communications Policy of the Government of Canada, you can request alternate formats on the "Contact Us" page.
2009-10
Departmental Performance Report
Public Service Commission of Canada
The original version was signed by
The Honourable James Moore, P.C., M.P.
Minister of Canadian Heritage and Official Languages
Table of Contents
Section I: Public Service Commission Overview
- Raison d’�tre and Responsibilities
- Public Service Commission's strategic outcome and Program Activity Architecture
- Performance summary
- Risk analysis
- Expenditure profile
Section II: Analysis of Program Activities by Strategic Outcome
- Program activity 1.1.0 – Appointment Integrity and Political Neutrality
- Program activity 1.2.0 – Oversight of Integrity of Staffing and Political Neutrality
- Program activity 1.3.0 – Staffing Services and Assessment
- Program activity 2.1.0 – Internal Service
Section III: Supplementary Information
President's Message

I am pleased to present the 2009-2010 Departmental Performance Report of the Public Service Commission (PSC) of Canada.
The PSC is an independent agency reporting to Parliament, mandated to safeguard the integrity of public service staffing and the political neutrality of the public service. We also recruit qualified Canadians from across the country. Under the delegated, values-based staffing system envisioned in the Public Service Employment Act, the PSC fulfills its mandate by providing clear policy direction, conducting effective oversight, delivering innovative staffing and assessment services and reporting to Parliament on the performance of the staffing systems.
After four and a half years of continuous effort by the PSC, by heads of departments and agencies and by managers and human resources specialists, a well-functioning and fully delegated system is in place. Formal delegation agreements are signed by deputy heads, and I personally review these agreements. We receive and analyze accountability reports and the results of our analysis are provided to deputy heads and presented in our Annual Reports to Parliament.
Our first priority, as set out in our Report on Plans and Priorities, was to continue to put in place a well-functioning delegated staffing model. Overall, we concluded that, for 2009-2010, the majority of departments and agencies have implemented the necessary infrastructure to manage their delegated staffing authorities.
Our second priority was to provide independent oversight and assurance to Parliament on the integrity of the staffing system and the non-partisanship of the federal public service. Work continues on improving our audit and monitoring activities in line with the recommendations of the Independent Oversight Review Committee. We enhanced the risk-based approach to our monitoring of the staffing system without increasing the reporting burden.
Our third priority was to enable organizations to manage their delegated responsibilities. Under the delegated system, the PSC maintains the authorities and accountabilities but also the obligation to resolve problems and support the efficient and effective operation of the staffing system. We have continued to provide guidance and support for organizations through our renewed policies, tools, systems and services.
We continued to move forward with our fourth priority, to provide integrated and modernized staffing and assessment services, by investing in modernizing those services and offering our expertise and efficiencies to departments and agencies. We also reached an agreement with departments and agencies on a permanent solution for the funding of the Public Service Staffing Modernization Project.
With respect to our fifth priority, to build on the model organization, we made further progress by starting to implement our Talent Management initiative and responding to the results of two on-line employee surveys.
During this period, we also continued to live within budget restraints resulting from the government’s 2009 horizontal strategic review of human resources management, through attrition and efficiencies. Our achievements across the organization are a testament to the strong dedication of our employees and their continuing commitment to excellence. Through their efforts, the PSC is able to perform its important work, on behalf of Parliament, to ensure that Canadians will continue to benefit from a professional, merit-based and non-partisan public service.
Maria Barrados, PhD
President
September 2, 2010
Section I – Public Service Commission overview
Raison d'être and responsibilities
Raison d’être
The Public Service Commission (PSC) is dedicated to building a public service that strives for excellence. We protect merit, non-partisanship and the use of both official languages while ensuring respect for the values of access, fairness, transparency and representativeness.
We recruit talented Canadians from across the country to the public service. We continually renew our recruitment services to meet the needs of a modern and innovative public service.
Responsibilities
On behalf of Parliament, the PSC safeguards the integrity of staffing and the non-partisan nature of the public service. In this respect, the PSC works closely with government and is accountable to Parliament yet is independent from ministerial direction.
The PSC’s mandate is threefold:
First, to appoint, or provide for the appointment of, persons to and from within the public service. This has been delegated to departments and agencies. The PSC provides staffing and assessment functions and services to support staffing in the public service.
Second, to oversee the integrity of the staffing system and ensure non-partisanship. This oversight role includes maintaining and interpreting data on the public service, carrying out audits that provide assurance and making recommendations for improvements and conducting investigations that can lead to corrective action in the case of errors or problems.
Third, to administer the provisions of the Public Service Employment Act (PSEA) related to the political activities of employees and deputy heads.
Public Service Commission's strategic outcome and Program Activity Architecture
The PSC’s Program Activity Architecture consists of one strategic outcome and four program activities.
Strategic Outcome
To provide Canadians with a highly competent, non-partisan and representative public service, able to provide service in both official languages, in which appointments are based on the values of access, fairness, transparency and representativeness
|
Program Activities |
Program Sub-Activities |
|---|---|
|
1.1.0 Appointment Integrity and Political Neutrality |
1.1.1 Policy, Regulation, and Exclusion Approval Orders and Guides |
|
1.2.0 Oversight of Integrity of Staffing and Political Neutrality |
1.2.1 Monitoring |
|
1.3.0 Staffing Services and Assessment |
|
|
2.1.0 Internal Services |
Information by sub-activity can be found in the publications section of the PSC’s Web site at www.psc-cfp.gc.ca.
Performance summary
| Planned Spending | Total Authorities* | Actual Spending |
|---|---|---|
| 95,120 | 112,918 | 106,768 |
*The increase in the Total Authorities from Planned Spending of $17,798 thousand is mainly attributable to funding received for the Public Service Staffing Modernization Project (PSSMP) and the operating budget carrying forward from the previous year, as well as from pay and compensation adjustments
| Planned | Actual | Difference |
|---|---|---|
| 989 | 995 | (6) |
Variance explanations
In 2009-2010, PSC expenditures were $106,768 thousand against total authorities of $112,918 thousand, resulting in a planned under-expenditure of $6,150 thousand appearing in the Public Accounts of Canada. The under-expenditure is due mainly to a frozen allotment of $2,733 thousand resulting from the Human Resources Horizontal Review reductions, which the PSC was not allowed to spend. The balance of the under-expenditure of $3,417 thousand is part of the carry-forward to 2010-2011.
Performance summary table
The following is a summary of expected results and financial resources associated with each program activity that contributes to the achievement of the PSC’s strategic outcome. The performance status of each expected result is indicated below. On the whole, the PSC achieved the results it planned in 2009-2010.
| Strategic Outcome: To provide Canadians with a highly competent, non-partisan and representative public service, able to provide service in both official languages, in which appointments are based on the values of access, fairness, transparency, and representativeness. | Alignment to Government of Canada Outcomes: Government Affairs - Safeguarding and fostering the integrity and political neutrality of public servants |
|
Program Activity Information by program activity is outlined in Section II. |
2008-2009 Actual Spending ($ thousands) |
2009-2010 ($ thousands) | Expected Result | Performance Status** | |||
|---|---|---|---|---|---|---|---|
| Main Estimates |
Planned Spending |
Total Authorities* |
Actual Spending |
||||
| 1.1.0 Appointment Integrity and Political Neutrality | 17,047 | 9,948 | 10,672 | 12,304 | 11,671 | Recruitment strategies, staffing practices and political activities consistent with the Public Service Employment Act (PSEA)and PSC strategic outcome, are implemented across the public service | Mostly met |
| 1.2.0 Oversight of Integrity of Staffing and Political Neutrality | 33,071 | 21,679 | 21,706 | 22,066 | 21,240 |
1. Organizations have implemented PSC monitoring and audit recommendations and corrective actions as a result of investigations that contribute to safeguarding the integrity of staffing and political neutrality 2. Enhanced risk-based oversight of the integrity of public service staffing |
1. Mostly Met 2. Met all |
| 1.3.0 Staffing Services and Assessment | 56,167 | 21,623 | 30,660 | 38,389 | 35,494 | Staffing and assessment services and products meet the needs of federal departments and agencies operating within a fully delegated staffing environment under the PSEA | Somewhat met |
| 2.1.0 Internal Services*** | n/a | 38,517 | 32,082 | 40,159 | 38,363 | ||
| Total | 106,285 | 91,767 | 95,120 | 112,918 | 106,768 | ||
| Less: Non-respendable revenues | 1,471 | 1,900 | n/a | n/a | 1,672 | ||
| Total PSC Spending | 104,814 | 89,867 | n/a | n/a | 105,096 | ||
| Full-time Equivalents | 1,009 | n/a | 989 | n/a | 995 | ||
* Total Authorities represent the PSC’s internal budget allocations.
** Performance Status is based on the following grid: Exceeded (completed more than 100% of the 2009-2010 target); Met all (completed 100% of the 2009-2010 target); Mostly met (completed 80-99% of the 2009-2010 target); Somewhat met (completed 60-79% of the 2009-2010 target); and Did not meet (completed less than 60% of the 2009-2010 target).
*** Commencing in the 2009-2010 Estimates cycle, the resources for the Internal Services program activity are displayed separately from other program activities. They are no longer distributed among the remaining program activities, as was the case in previous Main Estimates (consequently in the 2008-2009 actual spending column). This has affected the comparability of spending and full-time equivalent information by program activity between fiscal years.
Contribution of priorities to the Public Service Commission’s strategic outcome
The PSC has made significant progress in achieving its strategic outcome and meeting the five priorities identified in its 2009-2010 Report on Plans and Priorities (RPP).
Operational priorities
| Priority I | Type |
Linkages to Program Activities |
Performance Status |
|---|---|---|---|
|
Put in place a well-functioning delegated staffing model |
Previously committed, revised wording in RPP 2009-2010 |
1.1.0 Appointment Integrity and Political Neutrality 1.2.0 Oversight of Integrity of Staffing and Political Neutrality |
Met All |
|
The PSEA and the PSC’s Appointment Framework (AF) enable departments and agencies to design their staffing processes to address their own situations and needs. Progress in 2009-2010 against RPP planning highlights includes:
|
|||
| Priority II | Type |
Linkages to Program Activities |
Performance Status |
|---|---|---|---|
|
Provide independent oversight and assurance to Parliament on the integrity of the staffing system and the non-partisanship of the federal public service |
Previously committed |
1.1.0 Appointment Integrity and Political Neutrality 1.2.0 Oversight of Integrity of Staffing and Political Neutrality |
Mostly Met |
|
The PSC oversees the integrity of the staffing system and the political impartiality of the public service. The PSC developed and continued to refine a continuum of oversight mechanisms and tools. Progress in 2009-2010 against RPP planning highlights includes:
|
|||
| Priority III | Type |
Linkages to Program Activities |
Performance Status |
|---|---|---|---|
|
Enable organizations to manage their delegated responsibilities |
Previously committed |
1.1.0 Appointment Integrity and Political Neutrality 1.2.0 Oversight of Integrity of Staffing and Political Neutrality |
Somewhat Met |
|
While organizations have made progress in implementing the PSEA, ongoing efforts continue to fully transform the practices and processes for recruitment and staffing in the public service. Progress in 2009-2010 against RPP planning highlights includes:
|
|||
| Priority IV | Type |
Linkages to Program Activities |
Performance Status |
|---|---|---|---|
|
Provide integrated and modernized staffing and assessment services |
Previously committed |
1.3.0 Staffing Services and Assessment |
Somewhat Met |
|
Progress in 2009-2010 against RPP planning highlights includes:
|
|||
Management priority
|
Priority V |
Type |
Linkages to Program Activities |
Performance Status |
|---|---|---|---|
|
Build on the model organization |
Previously committed |
2.1.0 Internal Services |
Mostly Met |
|
Progress in 2009-2010 against RPP planning highlights includes:
|
|||
Risk analysis
Public Service Commission operating environment
The general economic downturn and government budgetary constraints impacted the public service and the PSC through the 2009-2010 reporting period, resulting in additional budgetary restraints and a search for further operating efficiencies.
In 2009-2010, costs recovered from billable assessment and staffing services rose to 81% ($11,300,000) of the Treasury Board’s cost recovery ceiling of $14,000,000. The demand for assessment products and services was comparable to 2008-2009 in some areas but declined in others. Test volumes for Second Language Evaluation and assessment services for executive counselling remained relatively stable. Use of occupational tests decreased for the second consecutive year. This is due to a range of factors, in particular, the transition of many occupational tests to cost recovery, the decline in public service staffing activity and the greater use of Public Service Employment Act (PSEA) flexibilities, such as asset criteria and other volume reduction strategies in place of standardized tests.
To respond to this challenge, the Personnel Psychology Center (PPC) has diversified its assessment products and services and focused on other forms of assessment developed from appropriations, such as unsupervised internet testing. Outreach to clients has also been enhanced to better inform them of the value-added of standardized testing.
Weakness in human resources capacity in departments and agencies
The combination of a new Act, new policies, retirements of experienced HR personnel and the required training of incoming HR specialists has created a vulnerability in HR capacity in the public service.
In order to address these challenges, the PSC has undertaken measures, such as the delivery of information sessions to newly appointed HR officers from various organizations across Canada, enabling the PSC to ensure that the advice and guidance provided by new HR staff to delegated managers are consistent with PSC expectations.
Strategic consultants and Direct Access Department (DAD) managers participated in 85 committees, councils, regional networks and in various other working groups, which enabled the PSC to provide additional updates and advice concerning the delegated appointment authorities and policy interpretations.
In 2009-2010, the PSC responded to 6234 calls and e-mails from organizations concerning staffing advice, to empower them to fully exercise their delegated authorities. Overall, queries dropped by 10.5% compared to the previous year. However, the number of complex queries increased by 9%.
Ongoing implementation of the values of the Public Service Employment Act
There remains a need for greater understanding, on the part of hiring managers and the HR community, of some of the key features and requirements of the values-based staffing regime, such as the concept of “right fit,” the use of non-advertised processes, investigations conducted by deputy heads and collective staffing.
Feedback received during consultations for the Appointment Policy Review highlighted the need for the PSC to continue to develop stronger ties with line managers and the HR community, to assist them as they undergo the cultural change required so that they can fully benefit from the flexibilities afforded by the new regime, as well as to ensure that the PSC’s policies remain current and pertinent.
Changing organizational plans to staff and renew
The federal public service faces significant challenges with respect to demographics. Departures of “baby boomers” combined with growth in the public service generated a high level of movement measured by appointments to the public service, promotions, lateral movements and acting appointments. The nature and level of mobility in the public service reinforces the need for HR planning to address organizational requirements. Mobility has impacted certain groups more than others, notably the Personnel Administration Group, the Economics, Sociology and Statistics Group and the Executive Group. Moreover, the increased staffing activity coupled with the ongoing implementation of the PSEA affects the workload of those in the HR community.
Departures, however, provide an opportunity to renew the public service. A corporate approach, such as the Post-Secondary Recruitment (PSR) campaign, is one way in which the public service can compete more effectively for the smaller cohort of new workers as well as develop targeted approaches to recruiting candidates who are representative of Canada’s diverse population.
Review of Public Service Commission Oversight
The recommendations of the Independent Review Committee1 were accepted as was the goal of auditing departments and agencies on a cyclical basis of five to seven years. The PSC has commenced the implementation of the 18-point action plan,2 and is currently building its capacity to meet the Independent Review Committee’s recommendations. Refinement in methodologies and increased communication with organizations about expectations will also allow for increased efficiency and understanding in the audit process.
Public Service Staffing Modernization Project (PSSMP)
The PSSMP has delivered a national e-recruitment system – the PSRS – used for external government hiring since the PSEA was introduced in 2005. Funding for the project will cease in March 2011.
The PSC has therefore implemented a business plan for the PSSMP to secure support in the form of cost-sharing from departments and agencies subject to the PSEA, in order to sustain operations and facilitate system enhancements. At a February 2010 meeting, deputy minister members of the Public Service Management Advisory Committee endorsed the PSC's proposed funding approach to cover the annual costs of the PSRS.
Corporate Risk Profile and mitigation strategies
The PSC’s Corporate Risk Profile and mitigation strategies are located in the publications section of the PSC Web site at www.psc-cfp.gc.ca.
Expenditure profile
Canada's Economic Action Plan
As part of Canada's Economic Action Plan, the PSC has received funding to enhance federal public service student employment in the amount of $70K (horizontal item as part of Budget 2009). The PSC spent the full amount in 2009-2010 and is planning to spend the same amount in 2010-2011.
Spending trend
The PSC’s spending trend from 2007-2008 through 2009-2010 is illustrated in Figure 1. Total spending consists of the net spending (appropriated) amount plus net voting revenues. The PSC has Treasury Board approval to use cost recovery for assessment services of up to $14 million.
Figure 1: Total Spending-Actuals by Fiscal Year
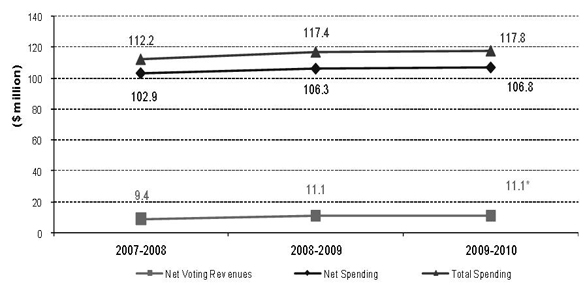
*Net voting revenues adjusted to include the refund of the previous year’s revenue ($126K). The difference in totals is due to rounding.
| Vote or Statutory Item | Truncated Vote or Statutory Wording | 2007-08 Actual Spending |
2008-09 Actual Spending |
2009-10 Main Estimates |
2009-10 Actual Spending |
|---|---|---|---|---|---|
| 95 | Program Expenditures | 90,692 | 93,601 | 79,815 | 92,810 |
| (S) | Contributions to Employee Benefit Plans | 12,189 | 12,680 | 11,952 | 13,957 |
| (S) | Spending of Proceeds from the Disposal of Surplus Crown Assets | - | 4 | - | 1 |
| Total Voted and Statutory Items | 102,881 | 106,285 | 91,767* | 106,768 | |
*Total authorities were $112.9 million. For detailed information, see the Performance summary table.
Section II – Analysis of program activities by strategic outcome
Strategic Outcome - To provide Canadians with a highly competent, non-partisan and representative public service, able to provide service in both official languages, in which appointments are based on the values of access, fairness, transparency and representativeness.
Benefits to Canadians
For more than a century, the Public Service Commission has provided protection of merit and non-partisanship in the public service on behalf of Parliament, key elements for ensuring a professional, permanent public service that supports a democratic government.
Performance information
The Public Service Commission’s (PSC) 2009-2010 Departmental Performance Report presents the results achieved against planned performance expectations as set out in our 2009-2010 Report on Plans and Priorities.
To ensure consistency, the indicators and performance measures for the PSC’s strategic outcome have been revised to reflect those of the PSC’s Annual Report. The progress towards each element of our strategic outcome is reported below. More information can be found in the PSC’s Annual Report at www.psc-cfp.gc.ca
|
INDICATOR - Flexibility and Efficiency |
PERFORMANCE INFORMATION |
|---|---|
|
Indicator 1: Managers’ satisfaction with flexibility to carry out staffing processes in an efficient manner Performance measure: Level of satisfaction compared to previous year |
In the PSC Survey of Staffing - Managers: 2008-2009,* 89% of managers were satisfied to some or to a great extent with their flexibility to carry out staffing processes in an efficient manner, compared to 86% in the previous year. |
|
Indicator 2: Length of time for hiring process Performance measure: Average time for hiring processes compared to previous year |
In the PSC Survey of Staffing – Managers: 2008-2009,* the average time to staff for advertised processes was 23 weeks, compared to 23.5 weeks in the previous year. In regard to non-advertised processes, the average time to staff in 2008-2009 was 13.1 weeks, compared to 13.5 weeks in the previous year. The average time to staff in the case of collective processes decreased to 24.7 weeks from 27.4 weeks in the previous year. |
|
Indicator 3: Candidates’ satisfaction regarding duration of appointment process Performance measure: Level of satisfaction compared to previous year |
In the PSC Survey of Staffing – Candidates: 2008-2009,* overall, 6 out of 10 candidates in advertised processes were either neutral, satisfied or very satisfied with the elapsed time taken to complete the process, consistent with the previous year’s survey results. |
|
INDICATOR - Merit |
PERFORMANCE INFORMATION |
|---|---|
|
Indicator 1: Managers’ satisfaction with quality of hires Performance measure: Level of satisfaction compared to previous year |
Of managers who indicated, in the PSC Survey of Staffing - Managers: 2008-2009,* that they had sufficient opportunity to observe the performance of the appointee, 97% were satisfied to a moderate or great extent with the quality of the hire for the last position that they staffed during the reporting period, compared to 98% in the previous year. |
|
Indicator 2: Official language qualifications in staffing (non-imperative appointments where the person does not meet the official language profile within the time periods prescribed by regulations) Performance measure: Number of non-compliant cases compared to previous year |
A total of 55 cases exceeded two years and are non-compliant with the Public Service Official Languages Exclusion Approval Order or its Regulations, down from 69 last year. |
|
Indicator 3: Candidates’ perceptions on whether they were assessed for the actual job requirements of the position Performance measure: Level of perception compared to previous year |
In the PSC Survey of Staffing – Candidates: 2008-2009,* 79% of candidates indicated that, within their work unit, advertised job requirements reflected the requirements of the position to be filled to a moderate or great extent, compared to 78% in the previous year.** |
|
Indicator 4: PSC founded investigations into staffing Performance measure: Number of investigations compared to previous year |
Of the 80 PSC investigations into appointment processes, 32 were founded. This compares to 15 founded investigations of 73 completed investigations into appointment processes in 2008-2009. |
|
Indicator 5: Deputy head investigations into staffing Performance measure: Number of investigations compared to previous year |
Of the 25 in-house investigations - into appointment processes by deputy heads, 10 were founded. |
|
INDICATOR - Non-partisanship |
PERFORMANCE INFORMATION |
|---|---|
|
Indicator 1: Managers’ perceptions of external pressure to select a particular candidate Performance measure: Level of perception compared to previous year |
Although the nature of external pressure was not identified in the PSC Survey of Staffing - Managers: 2008-2009,* 9% of managers indicated that they felt external pressure to select a particular candidate to some or to a great extent, compared to 10% in the previous year. |
|
Indicator 2: PSC investigations related to political influence in staffing Performance measure: Number of investigations compared to previous year |
Consistent with the previous year, no allegations of political influence in staffing were brought to the attention of the PSC. |
|
Indicator 3: PSC investigations related to the political activities of public servants Performance measure: Number of investigations compared to previous year |
In 2009-2010, the PSC received a total of 16 new requests to investigate allegations related to improper political activities, as compared to 22 such requests in the previous year. |
|
INDICATOR - Fairness |
PERFORMANCE INFORMATION |
|---|---|
|
Indicator 1: Candidates’ perceptions of the fairness of the assessment process Performance measure: Level of perception compared to previous year |
In the PSC Survey of Staffing – Candidates: 2008-2009,* 69% of candidates indicated that the areas on which they were assessed were evaluated fairly to a moderate or great extent, a proportion that has remained unchanged from the previous year**. |
|
Indicator 2: Percentage of acting appointments with subsequent indeterminate appointment at the same occupational group and level Performance measure: Monitor trends |
The rate of acting appointments with subsequent promotions dropped from 41.2% to 33.5% between the periods of 2004-2007 and 2007-2009 as revealed in the study Acting Appointments and Subsequent Promotions in the Federal Public Service (Update). |
|
Indicator 3: Percentage of indeterminate hires coming from (a) casual and (b) term positions Performance measure: Monitor trends |
Of the indeterminate hires in 2009-2010, 10% came from casual positions, 34.8% came from term positions. |
|
INDICATOR - Transparency |
PERFORMANCE INFORMATION |
|---|---|
|
Indicator 1: Organizational staffing priorities and strategies are communicated on organizations’ Web sites and contents are clearly communicated to managers, employees and employee representatives, where applicable Performance measure: Percentage of assessed organizations demonstrating acceptable or strong performance compared to the previous year |
Based on the 2009-2010 Departmental Staffing Accountability Report (DSAR) results, 71% of organizations were assessed with acceptable performance in ensuring transparency regarding their staffing priorities and strategies, the same as the previous year. |
|
Indicator 2: Candidates’ perceptions of openness and transparency in internal staffing Performance measure: Level of perception compared to previous year |
In the PSC Survey of Staffing – Candidates: 2008-2009,* 71% of candidates described staffing within their work unit as being conducted in a transparent manner, compared to 68% in the previous year.** |
|
INDICATOR - Access |
PERFORMANCE INFORMATION |
|---|---|
|
Indicator 1: Percentage of external appointments that are non-advertised Performance measure: Monitor trends |
In 2009-2010, 27% of external processes were non-advertised, compared to 26% in the previous year. |
|
Indicator 2: Percentage of external processes advertised nationally compared total external advertised processes Performance measure: Monitor trends |
In 2009-2010, 100% of external processes were advertised nationally or were not advertised nationally for appropriate reasons. This includes 95% advertised nationally and 5% using appropriate exclusion or exception requirements. |
|
Indicator 3: Percentage of internal appointments that are non-advertised Performance measure: Monitor trends |
In 2009-2010, 43% of internal processes were non-advertised, compared to 45% in the previous year. |
|
INDICATOR - Representativeness |
PERFORMANCE INFORMATION |
|---|---|
|
Indicator 1: Staffing-related provisions or initiatives to increase representativeness Performance measure: Percentage of assessed organizations demonstrating acceptable or strong performance compared to the previous year |
Based on 2009-2010 DSAR results, 80% of organizations demonstrated acceptable or higher performance in ensuring the use of provisions and initiatives to increase representation. |
* The data collection for the PSC Survey of Staffing – Managers: 2008-2009 and for the PSC Survey of Staffing – Candidates: 2008-2009 (both also referred to as Cycle 2) was conducted between January to March 2010.
** The Cycle 1 data related to the PSC Survey of Staffing – Candidates reported in the 2008-2009 DPR have been adjusted to reflect weighted data at the public service–wide level.
*** The 2006 workforce availability for the public service was provided by the Office of the Chief Human Resources Officer.
Program activity 1.1.0 – Appointment Integrity and Political Neutrality
The Appointment Integrity and Political Neutrality activity develops and maintains a policy and regulatory framework for safeguarding the integrity of public service staffing and ensuring political neutrality. This activity includes establishing policies and standards, providing advice, interpretation and guidance and administering delegated and non-delegated authorities.
Benefits to Canadians
Merit and non-partisanship in the federal public service – key elements for ensuring a professional, permanent public service that supports a democratic government – are safeguarded through policy and regulatory frameworks.
| 2009-10 Financial Resources ($ thousands) |
2009-10 Human Resources (FTEs) |
||||
|---|---|---|---|---|---|
| Planned Spending |
Total Authorities |
Actual Spending |
Planned | Actual | Difference |
| 10,672 | 12,304 | 11,671 | 101 | 100 | 1 |
Performance information
| Expected Results |
Performance Indicators |
Targets | Performance Status |
Performance Evidence |
|---|---|---|---|---|
|
Recruitment strategies and staffing practices and political activities consistent with the Public Service Employment Act (PSEA) and PSC strategic outcome are implemented across the public service Performance |
Performance indicator 1 (refined in 2009-2010 to include political activities): Level of success in implementing recruitment strategies and staffing practices consistent with the PSEA and the PSC strategic outcome across the public service |
Satisfactory evaluation findings on the implementation of the PSEA | Met All | The PSC continued its assessment of the PSEA and will be reporting its findings to Parliament in the spring of 2011. |
|
Performance indicator 2: Number of delegation instruments with limitations or conditions imposed by the PSC |
Zero | Somewhat Met | Four organizations were operating under imposed limitations or conditions: the Canadian Space Agency, Health Canada, the Office of Infrastructure Canada and the Royal Canadian Mounted Police. | |
|
Performance indicator 3: Level of success in creating employee awareness of their rights and responsibilities under Part 7 of the PSEA, as measured by the timeliness of their requests to participate in political processes
|
(refined during 2009-2010): 100% | Somewhat Met |
Communications initiatives undertaken to improve employees’ awareness of their rights and legal obligations regarding political activities included: information notices placed in various municipal and association publications; election reminders provided to deputy heads with an information communiqué for employees; a revised “Political Activities and You” brochure to incorporate social networking in support of, or in opposition to, a political party or candidate; and presentations made to various stakeholders. For the PSC to grant permission for a candidacy request, it must have both sufficient information and time to consider each candidacy request on its own merits. Over half (59%) of the new candidacy requests received by the PSC did not meet the 30-day deadline required under the Political Activities Regulations. Despite the number of late submissions, there were only two cases for which the PSC was unable to access the candidacy requests and render the decisions by the date required. |
Performance analysis
Following a commitment in its 2008-2009 Annual Report, the PSC introduced a streamlined approach for reviewing municipal candidacy requests, effective January 2010. Work continued improving employees’ awareness of their rights and legal obligations regarding political activities using a variety of communication approaches.
As part of the PSC’s assessment of the PSEA, the PSC continued its efforts to determine whether the PSEA has been implemented as intended and whether the expected results have been achieved, with a focus on merit, non-partisanship and recourse.
The PSC reviewed its appointment policies to ensure a values-based, harmonized suite of policies respecting the spirit of the legislation and supporting a well-functioning delegated appointment model, in which expectations of deputy heads and their delegates are clear with respect to their staffing responsibilities. Based on analysis conducted and feedback received over the past 4 years, including the most recent stakeholder consultations, the PSC proposed amendments to the 11 appointment policies and took these amendments to external consultation, where they have been generally well received. The guides for each policy have also been streamlined and reduced from 52 documents to 10, or 1 guide per policy.
In 2009-2010, a total of 740 of 2857 (26%) priority persons were appointed indeterminately into positions in the public service, in line with the previous fiscal year. The Priority Information Management System (PIMS) functionality was enhanced to improve and expand its reporting capacity. New features were introduced with the long-term goal of reducing the number of reports required from organizations.
The PSC provided policy advice, interpretation and guidance to hiring managers and the HR community. The PSC responded to 327 requests for policy advice and interpretation from both internal and external stakeholders; it processed 29 requests for exceptions to the Assessment Policy and 2 for the Area of Selection Policy.
The PSC reviewed 478 Public Service Staffing Tribunal (PSST) complaints, analyzed 28 decisions rendered by the Tribunal, conducted 38 policy risk assessments of complaints proceeding to hearings before the Tribunal and reviewed 12 written submissions and/or closing arguments. The PSC’s policy advisors also attended nine PSST hearings to provide strategic policy advice.
Lessons learned
Flexibilities – As evidenced by the consultation process for the policy review, there remains a need for greater understanding, on the part of hiring managers and the human resources (HR) community, of some of the key features and requirements of the new values-based staffing regime, such as the basis for the appointment decision, the use of non-advertised processes, investigations conducted by deputy heads and collective staffing. Feedback received during the consultations highlighted the need for the PSC to continue to develop stronger ties with line managers and the HR community to assist them as they undergo the cultural change that is required to fully benefit from the flexibilities afforded by the new regime and to ensure that the PSC’s policies remain current and pertinent.
Program activity 1.2.0 – Oversight of Integrity of Staffing and Political Neutrality
The Oversight of Integrity of Staffing and Political Neutrality activity provides an accountability regime for the implementation of the appointment policy and regulatory frameworks for safeguarding the integrity of public service staffing and ensuring political neutrality. This activity includes monitoring departments’ and agencies’ compliance with legislative requirements, conducting audits, studies and evaluations, carrying out investigations and reporting to Parliament on the integrity of public service staffing.
Benefits to Canadians
The policy and regulatory framework safeguarding merit and non-partisanship in the federal public service are implemented under an accountability regime, culminating in reporting to Parliament. Audits, studies, evaluations and investigations help to ensure access, fairness, transparency and representativeness in the federal public service staffing process.
| 2009-10 Financial Resources ($ thousands) |
2009-10 Human Resources (FTEs) |
||||
|---|---|---|---|---|---|
| Planned Spending |
Total Authorities |
Actual Spending |
Planned | Actual | Difference |
| 21,706 | 22,066 | 21,240 | 202 | 181 | 21 |
Performance information
| Expected Results |
Performance Indicators |
Targets | Performance Status |
Performance Evidence |
|---|---|---|---|---|
|
Expected result 1: Organizations have implemented PSC monitoring and audit recommendations and corrective action as a result of investigations that contribute to safeguarding the integrity of staffing and political neutrality |
Performance indicator (refined during 2009-2010): Percentage of PSC monitoring and audit recommendations and corrective action as a result of investigations implemented by organizations |
100 % | Mostly Met | During 2009-2010, all organizations were assessed against the Staffing Management Accountability Framework (SMAF) indicators. The 49 organizations that showed weakness received recommendations for improvements from the PSC. A total of 92% of organizations that received recommendations from ongoing monitoring or audit results have acted and showed improvement on all or at least 50% of the recommendations. Of these organizations, 49% were assessed as having acted on all recommendations and having demonstrated improvement in all recommended areas. Of the remaining organizations, 43% acted on at least half of the recommendations and demonstrated improvement. A total of 100% of organizations have implemented corrective actions stemming from investigations, where applicable. |
|
Expected result 2:Enhanced risk-based oversight of the integrity of public service staffing |
Percentage of coverage of oversight activities (monitoring, audits, studies and evaluations) |
(refined during 2009-2010) Conduct entity audits for all PSEA departments and agencies within an audit cycle of five to seven years. Assess 100% of PSEA organizations against the SMAF to produce a Departmental Staffing Accountability Report (DSAR). | Met All | A total of 100% of PSEA organizations, excluding the ones being audited, were assessed against the SMAF, and results were reported to deputy heads. Furthermore, 100% of planned audits and studies for 2009-2010 were completed within the reporting period and the PSC continued to gain audit efficiencies required to go to a five year cycle. |
Performance analysis
The SMAF and the DSAR processes and reporting tools were updated following consultation with key stakeholders. As a result, the number of performance indicators to be reported on was reduced from 37 to 29. A separate team was created to assess micro-organizations that use customized reporting and assessment tools. These initiatives reduced the reporting burden of delegated organizations and improved the monitoring of staffing.
The PSC completed four entity audits, one government-wide audit, one follow-up audit, two studies and four updates to previous statistical studies.
- Entity audits included Infrastructure Canada, the Canada Border Services Agency, the Immigration and Refugee Board of Canada and Health Canada.
- The government-wide audit focused on the Federal Student Work Experience Program (FSWEP) and subsequent appointments through bridging mechanisms.
- The follow-up audit focused on the Office of the Correctional Investigator.
- Studies included Data collection of non-advertised appointment processes and Career progression in the federal public service – Temporary versus permanent start-ups.
- The four updates to previous statistical studies included Time to Staff; To what extent do casuals become employed under the PSEA?; New indeterminate employees: Who are they?; and Acting appointments and subsequent promotions in the federal public service.
The DSAR process assessed all organizations against key success factors and used a risk-based approach for the assessment of appointment statistics and survey of staffing results. For each indicator, only those organizations whose results were in the fourth and fifth quintiles (weaker performers) were required to report on appointment statistics and survey results. They explained their operational context and reported on how they are managing the issues being assessed. As this was the first year of the use of survey of staffing results, organizations were required to comment on their communication of the results and their commitment to follow up and take action.
The results of the independent Oversight Review were accepted in 2009, thus setting the goal of auditing departments and agencies on a cyclical basis of five to seven years. The PSC continues to build its capacity to meet the Oversight Review’s recommendations.
Refinement in methodologies and increased communication with departments and agencies on expectations over the reporting period will allow for increased efficiency and understanding in the audit process.
The PSC is developing new strategies to share its methodologies and tools with the internal audit community. It provided methodological material and documents online in July 2010 and has planned presentations and meetings with internal audit representatives.
Compliance with service standards for investigations ensures that the vast majority of complaints related to appointment processes are resolved quickly and thoroughly. In 2009-2010, 84% of cases were completed within the standard of 215 days. The average completion time was 125 days.
Lessons learned
Reduced reporting burden – The reporting burden for the DSAR was reduced through the use of centrally generated statistics and Survey of Staffing results. These results were presented in quintiles; for each indicator, only those organizations in the fourth and fifth quintiles (bottom groups) were required to justify their performances. In addition, the PSC undertook a pilot project to assess the potential for collecting data on non-advertised appointment processes through the PIMS.
Program activity 1.3.0 – Staffing Services and Assessment
The Staffing Services and Assessment activity develops and maintains systems that link Canadians and public servants seeking employment opportunities in the federal public service with hiring departments and agencies. It provides assessment-related products and services in the form of research and development, consultation, assessment operations and counselling for use in recruitment, selection and development throughout the federal public service. This activity also includes delivering staffing services, programs and products to departments and agencies, to Canadians and public servants, through client service units located across Canada.
Benefits to Canadians
Staffing Services and Assessment help managers identify and hire qualified employees. Systems are in place to link Canadians (including public servants) seeking employment opportunities in the federal public service with hiring departments and agencies. Standardized assessment instruments, professional services and leading-edge techniques such as e-testing support efficient, merit-based appointments through the accurate and fair assessment of essential and asset qualifications, including second official language requirements.
| 2009-10 Financial Resources ($ thousands) |
2009-10 Human Resources (FTEs) |
||||
|---|---|---|---|---|---|
| Planned Spending |
Total Authorities |
Actual Spending |
Planned | Actual | Difference |
| 30,660 | 38,389 | 35,494 | 405 | 437 | (32) |
Performance information
| Expected Results |
Performance Indicators |
Targets | Performance Status |
Performance Evidence |
|---|---|---|---|---|
|
Expected result 1 (refined during 2009-2010): Staffing and assessment services and products that meet the needs of federal departments and agencies operating within a more fully delegated staffing environment under the PSEA Performance |
Performance indicator 1: Level of client satisfaction with PSC staffing and assessment services and products |
(refined during 2009-2010) High level of satisfaction following client feedback in terms of quality, timeliness and effectiveness |
Somewhat Met |
The PSC collected information/client feedback on current offerings and sought guidance in adapting products and services to better meet evolving client needs. Feedback was captured through both the client satisfaction survey and consultation groups. A new approach to the survey process was put in place in 2009-2010. Over 1300 surveys were sent to clients for whom work had been completed, 11% of clients responded. Results indicated that 86% of clients who responded to the survey were satisfied with the response time and 57% were satisfied with the quality of service received. Results also confirmed that 25% of respondents chose the PSC due to a lack of internal capacity. When asked whether they were satisfied with the costs associated with the services received, 70% responded ‘yes’. Clients who provided details on what they would like to see improved said that hiring managers should be involved in the outreach activities, that the clients wish to be consulted during the upcoming fee structure review process and that additional effort should be made to reduce delays experienced with the billing process. Enhancements to the client satisfaction survey, the survey process and reporting are planned in 2010-2011 in order to ensure a better response rate and improved analysis of results. |
|
Performance indicator 2: Degree of consistency of staffing and assessment services and products with the PSEA and the PSC’s strategic outcome |
Satisfactory audit and study findings | Mostly Met |
In 2009-2010, a formative evaluation of PSC-led pools and inventories was conducted. The evaluation confirmed the relevance of PSC-led pools and their consistency with government and PSC policies and priorities. Recommendations touched on the need to align these pools with other products and services, to develop tools to guide clients on the creation, management and monitoring of pools and to monitor client satisfaction. A program evaluation of the Post Secondary Recruitment (PSR) program was also undertaken, which confirmed the relevance of the program and its annual campaigns as an integral means of recruiting new graduates for entry-level positions in the public service. Concrete recommendations related to areas in need of improvement, such as communications and marketing, led to a re-design of the program in order to meet organizational manager needs. |
|
|
Expected result 2: To generate projected revenues for 2009-2010 while streamlining the business processes and continue the development of an enabling infrastructure to operate a successful cost recovery business Performance Status: Mostly Met
|
Amount of projected revenues earned
|
Generated projected revenues | Mostly Met |
More rigorous efforts were made to collect and analyse sales data (including client and product volumes), in order to identify trends and patterns and establish more reliable benchmarking. An Expenditure Management Model (EMM) was also developed, showing a split between appropriation and cost recovery for forecasts, budget and actual spending. In order to better focus our sales activity for 2010-2011, revenue targets were set, key performance indicators were developed and a tracking and reporting system was established. Together, these changes provide senior management with a fast and easy monthly assessment of performance in support of management decisions related to sales, service, billing and forecasted revenues and expenditures. The PSC completed the fiscal year with $11,300,000 in earned revenues. |
Performance analysis
The PSC continued to offer staffing and assessment services for the public service that complement services available within federal organizations and target economies of scale.
Demand for specialized recruitment programs such as FSWEP, PSR, and the Recruitment of Policy Leaders program continued, with many clients returning annually to access these time-saving targeted inventories.
A total of 51 PSC-led pools and targeted inventories were created and maintained, giving organizations time-saving access to partially or fully assessed candidates.
Demand for Executive (EX) Resourcing Services continued to decrease for the third year, due in part to the transitioning of this business line to cost recovery and organizations now having EX staffing delegation at the deputy head level. Clients continued to turn to the PSC for complex and/or sensitive files, volume management and collective staffing and for our centre of excellence.
In order to make searching faster and easier for job seekers, while providing more useful search results, new features were also introduced to the jobs.gc.ca Web site.
Promotional activities outlining the advantages of becoming a Direct Access Department continued in 2009-2010, resulting in a total of 32 organizations having direct access to the Public Service Resourcing System (PSRS), an e-staffing system for all external and student hiring for the Government of Canada on either a partial or national basis.
During 2009-2010, the PSC delivered a wide range of optional and mandatory assessment services, including 90554 occupational tests and over 7900 second language evaluation (SLE) reading and writing tests. An additional 26300 SLE oral proficiency tests were also delivered, with service standards met consistently throughout the fiscal year. Executive counselling and coaching services were also provided to a total of 1044 clients, over 800 of whom were new in 2009-2010.
The PSC continued to determine accommodation measures for both PSC and non-PSC tests and modified and updated PSC tests and related products, including 119 alternate formats for persons with disabilities.
Two studies for new and existing tools were also completed. This included research and pilot studies for two un-proctored Internet tests, along with a drop-off study that analyzed the performance of employment equity group members on key standardized PSC tests.
In 2009-2010, the PSC improved its billing process resulting in better control of commitments, expenses and volume management. It also introduced infrastructure changes that have enhanced product delivery. More rigorous efforts were made to collect and analyse sales data, including client and product volumes, in order to identify trends and patterns and establish more reliable benchmarking. Sales plans and key performance indicators were developed and an EMM was introduced, showing the split between appropriation and cost recovery for forecasts, budget and actual spending.
Together, these changes have enabled the PSC to improve its decision-making process and the accuracy of the cost recovery budgeting. Revenue of $11,300,000 was generated in 2009-2010.
Lessons learned
The PSC continues to examine its products and services to ensure their relevance and that they effectively meet the business needs of organizations across the federal public service.
In an effort to improve the client satisfaction survey response rate and the quality of survey responses, the PSC took a closer look at the existing client satisfaction survey and its process. Our findings show that the lag time between the completion of the work and the dissemination of the client satisfaction survey was, in many instances, too long and that the data system used to send the survey did not always have the appropriate client contact information.
A number of adjustments to the client satisfaction survey and survey process are planned for 2010-2011. For instance, an alternative method of triggering the delivery of the client survey will be piloted. This will include direct involvement by PSC service providers in identifying when work has been completed and the most recent client contact information. The survey content is also being reviewed, with the number of questions reduced and, an effort will be made to more clearly define business improvement opportunities. These, along with other enhancements to the survey content and process, are planned in an effort to ensure more frequent and timely dissemination of surveys along with improved reliability and analysis of results received.
Program activity 2.1.0 – Internal Services
The Internal Services program activity develops and monitors corporate management planning frameworks and policies related to the Management Accountability Framework (MAF), finance, HR management, information technology (IT), communications and other administrative and support services; provides central services and systems in support of all PSC programs, including the offices of the President and Commissioners; and formulates and implements policies, plans, guidelines, standards, processes and procedures to support the decision-making process of the Commission.
Benefits to Canadians
The PSC is committed to professional standards of modern comptrollership, including integrated business planning, strong financial management and effective oversight and evaluation. These results ensure that the PSC delivers meaningful results and good value for Canadians.
| 2009-10 Financial Resources ($ thousands) |
2009-10 Human Resources (FTEs) |
||||
|---|---|---|---|---|---|
| Planned Spending |
Total Authorities |
Actual Spending |
Planned | Actual | Difference |
| 32,082 | 40,159 | 38,363 | 281 | 277 | 4 |
Performance information
| Expected Results |
Performance Indicators |
Performance Status |
Performance Evidence |
|---|---|---|---|
|
Sound and effective management practices and support functions for the delivery of the PSC’s mandate Performance |
Performance indicator 1: Clean audit opinion from the Office of the Auditor General on the PSC’s financial statements |
Met All |
The PSC received a clean audit opinion in 2009-2010 for the fifth consecutive year. |
|
Performance indicator 2: Maintain acceptable MAF results for the PSC |
Met All |
The PSC received acceptable ratings from the Treasury Board of Canada Secretariat (TBS) during Round 7 of the MAF assessment. |
|
|
Performance indicator 3: Organizational performance measurement framework supports decision-making (i.e. monthly reports, quarterly reporting on operational plan and ongoing financial reporting)
|
Met All |
Reporting documents in support of decision making and performance measurement were produced in an efficient and timely manner during the reporting period and were adjusted to satisfy management’s changing requirements. |
|
|
Performance indicator 4: Successful implementation of key IT systems, including the Record, Document and Information Management System (RDIMS), the Public Service Resourcing System (PSRS) and PeopleSoft (an HR management tool)
|
Met All |
The implementation of the RDIMS and the PeopleSoft HR management system was completed during the reporting period. In addition, the PSRS 2009-2010 project objectives were implemented. |
|
|
Performance indicator 5: Meet or exceed corporate service standards
|
Mostly Met |
The PSC allocated its financial resources to programs three months before the beginning of the fiscal year and managed its financial resources very closely throughout the year. This resulted in re-allocation to emerging priorities and the PSC’s planned carry-forward (surplus) was within the 5% limit. The PSC fully met all its reporting requirements to central agencies and obtained a 100% rating in timeliness and accuracy of its reports to the Receiver General. The PSC initiated an early adoption of some of the new TBS policies, such as a policy on Internal controls and Future Oriented Financial Reporting; these are well within service standards. The PSC reviewed processes to ensure more accurate monitoring of planned versus actual staffing. The PSC implemented its new HR system to enhance HR reporting with regard to established service standards in the areas of classification, staffing and remuneration. Overall, the PSC is still working to improve its tracking and reporting on corporate service standards. |
Performance analysis
In 2009-2010, the PSC continued to build on the model organization that it has established over the past several years—an organization that ensures sound, effective and efficient management practices and employee engagement to support the delivery of the PSC’s mandate.
Robust financial and management controls were in place during the reporting period, as exemplified by the strong rating in financial management by TBS that the PSC received in the MAF assessment. We also obtained a clean audit opinion given by the Auditor General of Canada on the PSC’s 2009-2010 financial statements. In addition, improved integrated HR, information management/technology and communication planning contributed to the PSC’s overall strong performance and acceptable MAF rating.
During 2009-2010, a Web site was created to allow PSC employees to familiarize themselves with the Talent Management program and a questionnaire was created for employees at the EX minus 2 occupational level or higher.
Responses from the PSC Employee Engagement Survey indicated very positive results in terms of employee satisfaction and engagement. These results have been made available to all PSC employees and bargaining agents. A total of 97% of respondents agreed that they had productive working relationships with co-workers and 83% agreed that senior managers (President and Vice Presidents) are responsive to employees’ concerns—an increase of 4% from the previous survey. In addition, areas for improvement were identified and action plans were brought forward in the areas of career development (i.e. Talent Management and mid-year performance reviews) and communications.
Satisfaction with services from the Communications and Parliamentary Affairs Directorate is high. In May 2009, an internal survey showed an average satisfaction rate of 92% for the directorate's support of the PSC in communicating strategic and operational priorities to stakeholders and target audiences.
Finally, Internal Services continued to support the President in providing answers to Parliamentarians in bilateral meetings with members of Parliament and senators or at appearances before Parliamentary committees.
Section III – Supplementary Information
PSC Financial Statements
PUBLIC SERVICE COMMISSION
Statement of Management Responsibility Including Internal Control Over Financial Reporting
Responsibility for the integrity and objectivity of the accompanying financial statements of the Public Service Commission (PSC) for the year ended March 31, 2010 and all information contained in these statements rests with PSC’s management. These financial statements have been prepared by management in accordance with Treasury Board accounting policies which are consistent with Canadian generally accepted accounting principles for the public sector.
Management is responsible for the integrity and objectivity of the information in these financial statements. Some of the information in the financial statements is based on management's best estimates and judgment and gives due consideration to materiality. To fulfil its accounting and reporting responsibilities, management maintains a set of accounts that provides a centralized record of PSC's financial transactions. Financial information submitted to the Public Accounts of Canada and included in the PSC's Departmental Performance Report is consistent with these financial statements.
Management is also responsible for maintaining an effective system of internal control over financial reporting designed to provide reasonable assurance that financial information is reliable, that assets are safeguarded and that transactions are properly authorized and recorded in accordance with the Financial Administration Act and other applicable legislation, regulations, authorities and policies.
Management seeks to ensure the objectivity and integrity of data in its financial statements through careful selection, training, and development of qualified staff; through organizational arrangements that provide appropriate divisions of responsibility; through communication programs aimed at ensuring that regulations, policies, standards, and managerial authorities are understood throughout the PSC; and through conducting an annual assessment of the effectiveness of the system of internal control over financial reporting.
The system of internal control over financial reporting is designed to mitigate risk to a reasonable level and may not prevent or detect misstatements. It is based on an ongoing process designed to identify and prioritize risks and the controls to mitigate these risks.
The effectiveness and adequacy of the department’s system of internal control is reviewed by the work of internal audit staff, who conduct periodic audits of different areas of the department's operations, and by the Departmental Internal Audit Committee, which oversees management's responsibilities for maintaining adequate control systems and the quality of financial reporting, and which
recommends the financial statements to the President of the PSC.
The PSC’s financial statements have been audited by the Auditor General of Canada, the independent auditor for the Government of Canada.
Chief Financial Officer
Vice-President, Corporate Management
President, Public Service Commission
AUDITOR’S REPORT
To the Speaker of the House of Commons and the Speaker of the Senate
I have audited the statement of financial position of the Public Service Commission as at
31 March 2010 and the statements of operations, equity of Canada and cash flow for the year then ended. These financial statements are the responsibility of the Commission’s management. My responsibility is to express an opinion on these financial statements based on my audit.
I conducted my audit in accordance with Canadian generally accepted auditing standards. Those standards require that I plan and perform an audit to obtain reasonable assurance whether the financial statements are free of material misstatement. An audit includes examining, on a test basis, evidence supporting the amounts and disclosures in the financial statements. An audit also includes assessing the accounting principles used and significant estimates made by management, as well as evaluating the overall financial statement presentation.
In my opinion, these financial statements present fairly, in all material respects, the financial position of the Commission as at 31 March 2010 and the results of its operations and its cash flows for the year then ended in accordance with Canadian generally accepted accounting principles.
Further, in my opinion, the transactions of the Commission that have come to my notice during my audit of the financial statements have, in all significant respects, been in accordance with the Financial Administration Act and regulations and the Public Service Employment Act.
Sheila Fraser, FCA
Auditor General of Canada
Ottawa, Canada
16 July 2010
Statement of Financial Position
| Statement of Financial Position At March 31 (March 31, 2010) |
2010 | 2009 |
|---|---|---|
| Assets | ||
| Financial assets | ||
| Due from the Consolidated Revenue Fund | 5,163 | 10,057 |
| Accounts receivable and advances (Note 4) | 953 | 2,155 |
| Total - Financial assets | 6,116 | 12,212 |
| Non-financial assets | ||
| Prepaid expenses | 601 | 388 |
| Tangible capital assets (Note 5) | 17,449 | 21,352 |
| Total - Non-financial assets | 18,050 | 21,740 |
| Total Assets | 24,166 | 33,952 |
| Liabilities | ||
| Lease obligation for tangible capital assets (Note 6) | 18 | |
| Accrued salary | 1,837 | 6,234 |
| Accrued vacation leave | 3,847 | 3,630 |
| Accounts payable and accrued liabilities (Note 7) | 6,251 | 6,925 |
| Employee future benefits (Note 8) | 17,396 | 19,274 |
| Total - Liabilities | 29,349 | 36,063 |
| Equity of Canada (Note 9) | (5,183) | (2,111) |
| Total liabilities and Equity of Canada | 24,166 | 33,952 |
| Contingent liabilities (Note 10) | ||
| Contractual obligations (Note 11) |
The accompanying notes form an integral part of these financial statements.
Approved by:
Chief Financial Officer
Vice-President, Corporate Management
President, Public Service Commission
Statement of Operations
| Statement of Operations For the year ended March 31 |
2010 | 2009 |
|---|---|---|
| Expenses (Note 12) | ||
| Staffing services and assessment | ||
| Staffing services | 28,716 | 33,716 |
| Assessment services | 27,273 | 27,321 |
| Total | 55,989 | 61,037 |
| Oversight of integrity of staffing and political neutrality | ||
| Audits, studies and evaluations | 16,663 | 15,419 |
| Investigations and early intervention mechanisms | 4,351 | 4,784 |
| Monitoring | 3,428 | 3,401 |
| Total | 24,442 | 23,604 |
| Appointment integrity and political neutrality | ||
| Policy, regulation and exclusion approval orders | 6,695 | 6,166 |
| Delegated appointment authorities | 2,835 | 2,600 |
| Non-delegated appointment authorities | 2,601 | 2,606 |
| Political activity | 1,238 | 1,359 |
| Total | 13,369 | 12,731 |
| Internal Services | ||
| Governance & management support | 13,015 | 13,187 |
| Resource management services | 28,017 | 25,655 |
| Asset management services | 3,173 | 2,166 |
| Total | 44,205 | 41,008 |
| Total expenses | 138,005 | 138,380 |
| Revenues | ||
| Assessment and counselling services and products | 12,399 | 12,044 |
| Activities on behalf of: | ||
| Canada School of Public Service | 53 | 119 |
| Less: Costs recovered | (53) | (119) |
| Net cost of. operations | 125,606 | 126,336 |
The accompanying notes form an integral part of these financial statements.
Statement of Equity of Canada
| Statement of Equity of Canada For the year ended March 31 |
2010 | 2009 |
|---|---|---|
| Equity of Canada, beginning of year | (2,111) | 5,438 |
| Net cost of operations | (125,606) | (126,336) |
| Net cash provided by Government of Canada | 108,698 | 98,138 |
| Change in Due from the Consolidated Revenue Fund | (4,894) | 2,593 |
| Services received without charge from other government departments and agencies (Note 14) | 18,730 | 18,056 |
| Equity of Canada, end of year | (5,183) | (2,111) |
The accompanying notes form an integral part of these financial statements.
Statement of Cash Flow
| Statement of Cash Flow For the year ended March 31 |
2010 | 2009 |
|---|---|---|
| Operating activities | ||
| Cash received from: | ||
| Assessment and counselling services and products | 13,091 | 15,498 |
| Cash paid for: | ||
| Salaries and employee benefits | 95,980 | 85,860 |
| Professional and special services | 13,491 | 13,193 |
| Transportation and telecommunications | 2,784 | 2,865 |
| Informatics, office equipment, furniture and fixtures | 2,573 | 1,990 |
| Repair and maintenance | 1,565 | 1,924 |
| Utilities, materials and supplies, and other payments | 537 | 941 |
| Printing and publications services | 721 | 797 |
| Rentals | 830 | 777 |
| 118,481 | 108,347 | |
| Cash used by operating activities | 105,390 | 92,849 |
| Capital investment activities | ||
| Acquisitions of tangible capital assets | 3,304 | 5,293 |
| Proceeds from disposal of tangible capital assets | - | (4) |
| Cash used by capital investment activities | 3,304 | 5,289 |
| Financing Activities | ||
| Decrease in lease obligations for tangible capital assets | 4 | - |
| Cash used in financing activities | 4 | - |
| Net cash provided by Government of Canada | 108,698 | 98,138 |
The accompanying notes form an integral part of these financial statements.
Notes to the Financial Statements
For the year ended March 31, 2010
1. Authority and objectives
The Public Service Commission (PSC) is an independent agency established under the Public Service Employment Act (PSEA) and listed in schedules 1.1 and IV of the Financial Administration Act (FAA). The PSC was originally established in 1908 under the Civil Service Amendment Act. It is dedicated to building a public service that strives for excellence by protecting merit, non-partisanship, representativeness of Canadian society and the use of both official languages. This responsibility is performed in the best interests of the public service as part of Canada’s governance system, by administering and applying the provisions of the PSEA and by carrying out responsibilities as provided for in the Employment Equity Act and the Official Languages Act. The current PSEA came into force in December 2005. This legislation emphasizes the PSC’s accountability to Parliament and delegates staffing authority to deputy heads who in turn are accountable to the PSC for exercising this power. The Commission also carries out audits and investigations and administers measures under the PSEA regarding political activities of public servants.
The PSC, from its offices in Ottawa and its seven regional offices, offers recruitment services that allow talented Canadians, drawn from across the country, to join the public service and continually renews staffing services to meet the needs of a modern and innovative public service. The PSC has three program activities that contribute to the achievement of its objectives:
The Appointment Integrity and Political Neutrality activity develops and maintains a policy and regulatory framework for safeguarding the integrity of public service staffing and ensuring political neutrality. This activity includes establishing policies and standards, providing advice, interpretation and guidance and administering delegated and non-delegated appointment authorities.
The Oversight of Integrity of Staffing and Political Neutrality activity provides an accountability regime for the implementation of the appointment policy and regulatory framework for safeguarding the integrity of public service staffing and ensuring political neutrality. This activity includes monitoring departments’ and agencies’ compliance with legislative requirements, conducting audits, studies and evaluations, carrying out investigations, and reporting to Parliament on the integrity of public service staffing.
The Staffing Services and Assessment activity develops and maintains systems that link Canadians and public servants seeking employment opportunities in the federal public service with hiring departments and agencies. It provides assessment-related products and services in the form of research and development, consultation, assessment operations and counselling for use in recruitment, selection and development throughout the federal public service. A portion of these assessment-related and counselling services are provided on a cost recovery basis. This activity also includes delivering staffing services, programs and products to departments and agencies, to Canadians and public servants, through client service units located across Canada.
2. Summary of significant accounting policies
- Basis of presentation
These financial statements have been prepared in accordance with the Treasury Board
accounting policies stated below, which are based on Canadian generally accepted accounting principles for the public sector. - Parliamentary appropriations
The PSC is financed by the Government of Canada through Parliamentary appropriations. Appropriations provided to the PSC do not parallel financial reporting according to Canadian generally accepted accounting principles for the public sector since appropriations are primarily based on cash flow requirements. Consequently, items recognized in the Statement of Operations and the Statement of Financial Position are not necessarily the same as those provided through appropriations from Parliament. Note 3 provides a high-level reconciliation between the basis of reporting. - Due from the Consolidated Revenue Fund
The PSC operates within the Consolidated Revenue Fund (CRF), which is administered by the Receiver General for Canada. All cash received by the PSC is deposited to the CRF and all cash disbursements made by the PSC are paid from the CRF. Due from the CRF represents amounts of cash that the PSC is entitled to draw from the CRF, without further appropriations, in order to discharge its liabilities. - Accounts receivable
Accounts receivable are stated at amounts expected to be ultimately realized; a provision is made for receivables where recovery is considered uncertain. -
Tangible capital assets
All tangible capital assets and leasehold improvements having an initial cost of $5,000 or more are recorded as capital assets at their acquisition cost. Similar items under $5,000 are expensed in the Statement of Operations. The PSC does not capitalize intangibles. The cost of assets under development by the PSC includes material, direct labour and related overhead. Amounts included in assets under development are transferred to the appropriate class of asset upon completion, and are then amortized. Amortization of tangible capital assets is done on a straight-line basis.Asset class Amortization period Office equipment
3 and 10 years
Informatics hardware and infrastructure
4 and 5 years
Computer software
3 years
In-house developed software
Lesser of 12 years or useful life
Furniture and fixtures
15 years
Vehicles
6 years
Leasehold improvements
Lesser of 10 years or term of lease
Leased tangible capital assets
Lesser of term of lease/useful life
- Salaries and benefits, and vacation leave
Salaries and vacation leave are expensed as the salary and leave accrue to employees under their respective terms of employment. The employee’s accrued salaries and benefits liability is calculated based on the respective terms of employment using the employees' salary levels at year end, and the number of days remaining unpaid at the end of the year. The liability for vacation leave is calculated at the salary levels in effect at March 31st for all unused vacation leave benefits accruing to employees. Employee vacation pay liabilities payable on cessation of employment represent obligations of the PSC that are normally funded through future years’ appropriations. -
Employee future benefits
- Pension benefits
The PSC’s eligible employees participate in the Public Service Pension Plan administered by the Government of Canada. The PSC’s contributions to the Plan are charged to expenses in the year incurred and represent the total pension obligation of the PSC. The PSC is not required under current legislation to make contributions with respect to any actuarial deficiencies of the Plan. - Severance benefits
Employees are entitled to severance benefits under labour contracts or conditions of employment. These benefits are accrued as employees render the services necessary to earn them. The obligation relating to the benefits earned by employees is calculated using information derived from the results of the actuarially determined liability for employee severance benefits for the Government as a whole. - Other benefits
The Government of Canada sponsors a variety of other benefit plans, which cover the employees of the PSC. These include health care, dental and insurance plans for which no costs are charged to the PSC. In these cases, an estimated cost is recorded as an operating expense under the item “Services provided without charge”. The Government of Canada also sponsors workers’ compensation benefits available across Canada. The PSC is charged for its share of the annual benefit payments incurred under this Plan. These amounts represent the PSC’s contribution to the Plan and they are recorded by the PSC as an expense in the period incurred. As a participant, the PSC has no other obligation to any of these plans in addition to its annual contributions.
- Pension benefits
- Revenues
Revenues are accounted for in the period in which the underlying transaction or event that gave rise to the revenues takes place. - Services provided without charge
Services provided without charge from other federal government departments and agencies are recorded as operating expenses at their estimated cost. A corresponding amount is reported directly in the Statement of Equity of Canada. - Measurement uncertainty
The preparation of these financial statements in accordance with Treasury Board accounting policies requires management to make estimates and assumptions that affect amounts of assets, liabilities, revenues and expenses reported in the financial statements. At the time of preparation of these statements, management believes the estimates and assumptions to be reasonable. The most significant items where estimates are used are contingent liabilities, the liability for employee severance benefits and the estimated useful life of tangible capital assets. Actual results could significantly differ from those estimated. Management's estimates are reviewed periodically and, as adjustments become necessary, they are recorded in the financial statements in the year they become known.
3. Parliamentary appropriations
The PSC receives most of its funding through annual Parliamentary appropriations. Items recognized in the Statement of Operations and the Statement of Financial Position in one year may be funded through Parliamentary appropriations in prior, current or future years. Accordingly, the PSC has different net results of operations for the year on a government funding basis than on an accrual accounting basis. The differences are reconciled in the following tables:
(a) Reconciliation of net cost of operations to current year appropriations used:
| 2010 | 2009 | |
|---|---|---|
| Net cost of operations | 125,606 | 126,336 |
| Adjustments for items affecting net cost of operations but not affecting appropriations: | ||
| Services received without charge | (18,730) | (18,056) |
| Amortization of tangible capital assets | (7,178) | (6,203) |
| Revenue not available for spending | 1,671 | 1,471 |
| Decrease in Employee future benefits | 1,878 | (3,182) |
| Increase in Vacation leave | (217) | 94 |
| Other | 217 | 507 |
| Total | 103,247 | 100,967 |
| Adjustments for items not affecting net cost of operations but affecting appropriations: | ||
| Acquisitions of tangible capital assets | 3,304 | 5,293 |
| Decrease in lease obligations for tangible capital assets | 4 | - |
| Prepaid expenses | 213 | 25 |
| Total | 3,521 | 5,318 |
| Current year appropriations used | 106,768 | 106,285 |
(b) Appropriations provided and used:
| 2010 | 2009 | |
|---|---|---|
| Parliamentary appropriations provided: | ||
| Voted - Operating expenditures | 98,833 | 99,103 |
| Statutory contributions to employee benefit plans | 13,958 | 12,680 |
| Spending of proceeds from disposal of surplus assets | 1 | 4 |
| Refund of previous year revenue | 126 | 19 |
| Total | 112,918 | 111,806 |
| Less: Lapsed appropriations - operating expenditures | (6,150) | (5,521) |
| Current year appropriations used | 106,768 | 106,285 |
4. Accounts receivable and advances
| 2010 | 2009 | |
|---|---|---|
| Receivables - Federal Government departments, agencies and Crown corporations | 910 | 2,146 |
| Receivables - External parties | 37 | 3 |
| Advances to PSC's Employees | 6 | 6 |
| Total | 953 | 2,155 |
5. Tangible capital assets
| Cost | 2010 | 2009 | |||||
|---|---|---|---|---|---|---|---|
| March 31, 2009 | Acquisitions | Disposals, write-offs | Transfers | March 31, 2010 | Net book value | Net book value | |
| Office equipment | 649 | 56 | 6 | - | 699 | 298 | 290 |
| Informatics hardware and infrastructure | 9,103 | 507 | 594 | - | 9,016 | 2,571 | 3,231 |
| Software | 23,450 | 779 | 4 | 5,741 | 29,966 | 11,595 | 10,851 |
| Furniture and fixtures | 1,470 | - | 5 | - | 1,465 | 1,129 | 1,204 |
| Vehicles | 30 | - | - | - | 30 | 24 | 27 |
| Leasehold improvements | 1,077 | 80 | - | - | 1,157 | 757 | 785 |
| Assets under development | 4,964 | 1,882 | 50 | (5,741) | 1,055 | 1,055 | 4,964 |
| Sub-Total | 40,743 | 3,304 | 659 | - | 43,388 | 17,429 | 21,352 |
| Leased equipment | - | 22 | - | - | 22 | 20 | - |
| Total | 40,743 | 3,326 | 659 | - | 43,410 | 17,449 | 21,352 |
| 2010 Accumulated amortization |
||||
|---|---|---|---|---|
| March 31, 2009 | Amortization | Disposals, write-offs | March 31, 2010 | |
| Office equipment | 359 | 46 | 4 | 401 |
| Informatics hardware and infrastructure | 5,872 | 1,167 | 594 | 6,445 |
| Software | 12,599 | 5,776 | 4 | 18,371 |
| Furniture and fixtures | 266 | 76 | 6 | 336 |
| Vehicles | 3 | 3 | - | 6 |
| Leasehold improvements | 292 | 108 | - | 400 |
| Sub-Total | 19,391 | 7,176 | 608 | 25,959 |
| Leased equipment | - | 2 | - | 2 |
| Total | 19,391 | 7,178 | 608 | 25,961 |
Amortization expense for the year ended March 31, 2010 is $7,178,000 ($6,203,000 in
2008-2009).
6. Lease obligation for Tangible capital assets
The department has entered into agreements for photocopier rentals under capital lease with a cost of $22,000 and accumulated amortization of $2,000 as at March 31, 2010. The obligations for the upcoming years include the following:
| 2010 | 2009 | |
|---|---|---|
| 2011 | 4 | - |
| 2012 | 5 | - |
| 2013 | 5 | - |
| 2014 and thereafter | 5 | - |
| Total future minimum lease payment | 19 | - |
| Imputed interest (0.68% to 2.28%) | 1 | - |
| Balance of obligations under leased tangible capital assets | 18 | - |
7. Accounts payable and accrued liabilities
| 2010 | 2009 | |
|---|---|---|
| Payables - Federal Government departments, agencies and Crown corporations | 3,057 | 1,832 |
| Payables - External parties | 3,194 | 5,093 |
| Total | 6,251 | 6,925 |
8. Employee future benefits
(a) Pension benefits
The PSC eligible employees participate in the Public Service Pension Plan, which is sponsored and administered by the Government of Canada. Pension benefits accrue up to a maximum period of 35 years at a rate of 2 percent per year of pensionable service, times the average of the best five consecutive years of earnings. The benefits are integrated with the Canada and Quebec Pension Plan benefits and they are indexed to inflation.
Both the employees and the PSC contribute to the cost of the Plan. The 2009-2010 expense amounts to $10,077,000 ($9,493,000 in 2008-2009), which represents approximately 1.9 times the employees’ contributions.
The PSC's responsibility with regard to the Plan is limited to its contributions. Actuarial surpluses or deficiencies are recognized in the financial statements of the Government of Canada, as the Plan's sponsor.
(b) Employee severance benefits
The PSC provides severance benefits to its employees based on eligibility, years of service and final salary. These severance benefits are not pre-funded. Benefits will be paid from future appropriations. Information about the severance benefits, measured as at March 31, is as follows:
| 2010 | 2009 | |
|---|---|---|
| Accrued benefit obligation, beginning of year | 19,274 | 16,092 |
| Expense for the year | 140 | 5,087 |
| Benefits paid during the year | (2,018) | (1,905) |
| Accrued benefit obligation, end of year | 17,396 | 19,274 |
9. Equity of Canada
The deficit represents liabilities incurred by the PSC, net of assets, that have not yet been funded through appropriations. Significant components of this amount are employee future benefits and vacation pay liabilities. These amounts are expected to be funded by appropriations in future years as they are paid.
10. Contingent liabilities
Claims are made against the PSC in the normal course of operations. There are currently claims outstanding at March 31, 2010, none of which are expected to result in payment. ($0 at March 31, 2009)
11. Contractual obligations
The nature of the PSC's activities can result in some large multi-year obligations whereby the PSC will be obligated to make future payments when the services are received. Significant contractual obligations other than lease obligation for tangible capital assets that can be reasonably estimated are summarized as follows:
| 2011 | 2012 | 2013 | 2014 and thereafter | Total | |
|---|---|---|---|---|---|
| Service contracts | 1,212 | 9 | - | - | 1,221 |
| Operating leases | 163 | 60 | 26 | 18 | 267 |
| Total | 1,375 | 69 | 26 | 18 | 1,488 |
12. Expenses by major classification
| Staffing services and assessment | Oversight of integrity of staffing and political neutrality | Appointment integrity and political neutrality | Internal Services | 2010 Total |
2009 Total |
|
|---|---|---|---|---|---|---|
| Salaries and employee benefits |
39,209 |
20,099 |
11,521 |
27,233 |
98,062 |
99,273 |
| Professional and special services |
4,720 |
1,820 |
508 |
6,508 |
13,556 |
14,567 |
| Accommodation |
4,278 |
1,868 |
1,022 |
3,378 |
10,546 |
10,409 |
| Amortization of tangible capital assets |
4,686 |
176 |
36 |
2,280 |
7,178 |
6,203 |
| Transportation and telecommunications |
1,375 |
364 |
161 |
829 |
2,729 |
2,740 |
| Repair and maintenance |
477 |
1 |
3 |
1,556 |
2,037 |
1,668 |
| Informatics, office equipment, furniture and fixtures |
265 |
45 |
5 |
1,383 |
1,698 |
1,308 |
| Utilities, materials and supplies, and other |
332 |
30 |
55 |
434 |
851 |
774 |
| Rentals |
400 |
21 |
25 |
379 |
825 |
730 |
| Printing and publications services |
247 |
18 |
33 |
225 |
523 |
708 |
| Total |
55,989 |
24,442 |
13,369 |
44,205 |
138,005 |
138,380 |
13. Related party transactions
The PSC is related in terms of common ownership to all Government of Canada departments, agencies and Crown corporations. The PSC enters into transactions with these entities in the normal course of business and on normal trade terms.
During 2009-2010, the PSC incurred expenses of $39,274,000 ($35,772,000 in 2008-2009) and earned revenues of $12,385,000 ($12,037,000 in 2008-2009) from transactions in the normal course of business with other federal government departments, agencies and Crown corporations. These expenses include services received without charge as described
in
Note 14.
14. Services provided without charge
During the year, the PSC received services that were obtained without charge from other government departments and agencies. These services without charge have been recognized in the PSC's Statement of Operations as follows:
| 2010 | 2009 | |
|---|---|---|
| Public Works and Government Services Canada - accommodation |
10,547 |
10,409 |
| Treasury Board Secretariat - employer's share of insurance premiums |
6,904 |
6,401 |
| Justice Canada - legal services |
1,039 |
997 |
| Human Resources and Social Development Canada - employer's portion of Worker's compensation payments |
133 |
137 |
| Office of the Auditor General of Canada - audit services |
107 |
112 |
| Total |
18,730 |
18,056 |
15. Change in estimate
During fiscal year 2009-2010, management revised the estimate on the expected useful life of its Public Service Recruitment System (PSRS), an in-house developed software. The estimated useful life for PSRS was revised to March 31, 2016 (originally March 31, 2011) given Management’s intention to continue using and maintaining the system for the foreseeable future. This change came as a result of new information available this year and is applied prospectively. The depreciation expense is therefore $1,305,000 lower than it would have been under the previous useful life and net book value would be higher by the same amount as at November 30, 2009.
16. Comparative information
Comparative figures have been reclassified to conform to the current year's presentation.
List of Supplementary Information Tables
Supplementary information on the following tables can be found on the Treasury Board of Canada Secretariat’s Web site at http://www.tbs-sct.gc.ca/dpr-rmr/st-ts-eng.asp.
- Source of Respendable and Non-respendable Revenues
- User Fees Reporting
- Status Report on Projects Operating with Specific Treasury Board Approval
- Green Procurement
- Response to Parliamentary Committees, to the Auditor General and to the Public Service Commission on External Audits
- Internal Audits and Evaluations
Other Items of Interest
Supplementary information on the following subjects can be found in the publications section of the PSC’s Web site at http://www.psc-cfp.gc.ca.
- Information by sub-activities
- Assessment of Internal Control over Financial Reporting for the fiscal year ended March 31, 2010
This document is available on the Treasury Board of Secretariat’s Web site at http://www.tbs-sct.gc.ca and on the publications section of the PSC’s Web site at http://www.psc-cfp.gc.ca.
Footnotes
www.psc-cfp.gc.ca/abt-aps/rprt/ovr-srv/index-eng.htm [Return]
The Public Service Commission Action Plan to Respond to the Recommendations of the Public Service Commission’s Independent Oversight Review Committee www.psc-cfp.gc.ca/spch-disc/2009/2009-05-12-1a-eng.htm [Return]