ARCHIVED - Canada Revenue Agency - Report
 This page has been archived.
Archived Content
Information identified as archived on the Web is for reference, research or recordkeeping purposes. It has not been altered or updated after the date of archiving. Web pages that are archived on the Web are not subject to the Government of Canada Web Standards. As per the Communications Policy of the Government of Canada, you can request alternate formats on the "Contact Us" page.
2009-10
Departmental Performance Report
Canada Revenue Agency
The original version was signed by
The Honourable Keith Ashfield, P.C., M.P.
Minister of National Revenue and Minister of the Atlantic Canada Opportunities Agency and Minister for the Atlantic Gateway
Section I: Agency Overview
Message from the Minister

The Canada Revenue Agency (CRA) administers a fair, and responsive tax and benefit system that contributes to the economic and social well being of our nation. The support the CRA provided during the difficult economic climate that dominated 2009-2010 was especially important. By being flexible in how it delivered key aspects of Canada’s Economic Action Plan, the CRA helped secure stability and future prosperity for Canadians.
The CRA is committed to protecting Canada’s revenue base by making sure everyone complies with tax laws. To do this, during 2009-2010, the CRA actively pursued individuals and businesses, including participants in the underground economy and those avoiding taxes by hiding funds offshore, who were not paying the taxes that they owed to Canadians. This document highlights many of the CRA’s achievements over the last year and describes the CRA’s role in supporting individuals, businesses, and families across Canada.
As Minister of National Revenue, I am pleased to present the Departmental Performance Report 2009-2010 for tabling.
The Honourable Keith Ashfield, P.C., M.P.
Minister of National Revenue and
Minister of the Atlantic Canada Opportunities Agency and
Minister for the Atlantic Gateway
Message from the Commissioner and Chief Executive Officer

As Commissioner and Chief Executive Officer, I am accountable to the Minister of National Revenue for all program matters, and to our Board of Management for administrative matters. I am proud to report that the Canada Revenue Agency (CRA) has once again demonstrated its capacity to achieve meaningful and measurable results for Canadians. While we recognize that we have more to do in some areas, our achievements during this past year provide further evidence of the strength of our core business expertise: administering taxes, collecting revenues, and delivering benefits.
The CRA touches the lives of more Canadians than any other single department or agency in the country. In 2009-2010, we processed about $358 billion in taxes and duties and delivered over $17 billion in benefits and credits to millions of individuals and businesses on behalf of Canada’s provinces, territories, other federal departments, and First Nations.
Our 2009-2010 results
During 2009-2010, the CRA placed significant emphasis on ensuring the integrity of Canada’s tax and benefits system. We encouraged compliance with tax legislation by designing initiatives that make it harder for individuals and business to not comply. For example, over the past year we successfully targeted areas like aggressive tax planning and tax havens through partnerships with provinces and international tax administrations, and further refined our risk assessment and management tools. Overall, individuals, corporations, business that collect GST/HST, and employers continued to demonstrate strong levels of voluntary compliance with their registration, filing, and remittance obligations. Our robust system of checks and balances, coupled with the legislative and other compliance tools available to us, provide assurance that Canada’s revenue base is being protected.
We continued to strengthen service as a means of increasing levels of voluntary compliance. In 2009-2010, we took further steps to make it easier for Canadians to comply with legislation by improving access to tax and benefit information and interactive tools.
In our day-to-day activities, we met most of our performance targets for 2009-2010. For those that we did not meet, we sought to understand the factors involved—such as the recent economic downturn—to identify the steps we can take to improve performance in the future.
One particular challenge that we face, which is shared by tax administrations worldwide, is the measurement of the impact of our activities to detect and address non-compliance. Although we continue to achieve strong ratings overall for our performance management framework, we recognize the need to further refine this area.
Moving forward
November 2009 marked the end of our first decade as an agency. The programs and services that we provided over the last 10 years made an important difference in the lives of Canadians. We took on new business, developed and adapted how we worked, built on our management initiatives, and ensured that we continued to deliver on the expectations and needs of taxpayers, businesses, and our government clients. None of this would have been possible without the dedication and hard work of our skilled employees. Their collective knowledge will continue to help us provide innovative and efficient services to individuals and businesses on behalf of the Government of Canada, other levels of government, and First Nations communities.
Our reputation as a world-class tax administration is well-earned and we are proud of our accomplishments over the past year. In submitting this report, I would like to extend my sincere thanks to all of my coworkers, managers, and union leaders who have made the CRA’s successes possible. As we move forward, I remain confident in the dedication, knowledge, and professionalism of our employees as they deliver quality results that matter to Canadians.
Linda Lizotte-MacPherson
Commissioner and Chief Executive Officer
Canada Revenue Agency
Our Raison d’�tre
Canada’s tax system is based on voluntary compliance and self-assessment. A well-functioning tax system is critical to the ability of federal, provincial, territorial, and First Nation governments to deliver programs and services that are important to Canadians and Canadian businesses.
The Canada Revenue Agency (CRA) has the mandate to administer tax, benefit, and other programs on behalf of the Government of Canada and provincial, territorial, and First Nations governments.
Parliament created the CRA so we could meet the mandate by:
- providing better service to Canadians;
- offering more efficient and more effective delivery of government programs; and
- fostering closer relationships with provinces and other levels of government for which the CRA delivers programs, and providing better accountability.
The CRA’s mandate reflects the broad role that the CRA plays in the lives of Canadians. The CRA contributes to three of the Government of Canada’s outcome areas:
- A transparent, accountable and responsive federal government;
- Well-managed and efficient government operations; and
- Income security and employment for Canadians.
In 2009-2010 we processed about $358 billion in taxes and duties ($8 billion less than in 2008-2009) on behalf of Canada, the provinces (except Quebec) and territories, and First Nations.We also delivered over $17 billion in benefits and credits, and provided other services that contributed directly to the economic and social well-being of Canadians.
Benefit to Canadians
No other public organization touches the lives of more Canadians on a daily basis than the CRA does. Each year we administer billions of dollars in tax revenue and distribute timely and accurate benefit payments to millions of Canadians. We deliver income-based benefits, credits, and other services that assist families and children, low- and moderate-income households, and persons with disabilities–programs that contribute directly to the economic and social well-being of Canadians.
Our ability to deliver efficient, timely, and accurate high-volume programs and services makes us a valuable partner for government clients.
The following two strategic outcomes summarize the CRA’s contribution to Canadian society.
- Taxpayers meet their obligations and Canada’s revenue base is protected; and
- Eligible families and individuals receive timely and correct benefit payments.
In addition to administering tax and benefit programs, we administered harmonized sales tax for three provinces and verified taxpayer income levels in support of a wide variety of federal, provincial, and territorial programs, ranging from student loans to health care initiatives. We also provided other services, such as our Refund Set-Off Program, through which we helped other federal departments and agencies, as well as provincial and territorial governments, collect debts that might otherwise become uncollectable.
This Performance Report assesses the extent to which we achieved these outcomes during the 2009-2010 fiscal year. On balance, our results show that we met both our strategic outcomes.
Risk Analysis
Our Enterprise Risk Management Program was created to ensure that we develop and implement a systematic and comprehensive approach to managing risks that is fully integrated into our strategic, operational, and financial decision-making processes and mechanisms.
To keep abreast of the risks the CRA faces as an organization, during the planning period, we completed our Corporate Risk Inventory 2009, an integral part our annual strategic planning exercise. The five key priorities of the Corporate Business Plan 2010-2011 to 2012-2013 were based on the highest CRA risks identified in the 2009 inventory (related to payment compliance and the underground economy). A CRA risk action plan was also developed to ensure that we have appropriate response strategies for all the risks identified in the inventory. In this way, the 2009 risk inventory guided the strategic and operational business priorities for the 2010-2011 planning period and led us to integrate risk management in our day-to-day business.
An update to the Corporate Risk Inventory 2009 was also initiated in early 2010. The update indicated that the overall risk profile of the CRA remains generally unchanged from 2009.
We believe that our approach to risk management will help us maintain services to the Canadian public and protect their interests.
Rating our Results
We use qualitative and quantitative indicators, also called measures, to determine the results achieved in terms of our strategic outcomes and expected results. We gather operational data, statistical samples, and survey results that form the basis for our assessments. We continue to face challenges in strengthening our indicators; in particular, ones that are concrete and allow us to make clear links between our achievements and our strategic outcomes and expected results. To this end, we share information with other tax administrations on results measurement through various international forums. In addition, the CRA participates in international initiatives to benchmark key aspects of tax administration with jurisdictions from around the world.
We also rate our strategic results and those of our program activities in terms of whether the targets identified in our Corporate Business Plan 2009-2010 to 2011-2012 were met, mostly met, or not met.
Our targets identify the percentage or degree we expect to attain for a performance level. Where targets are numeric, they are listed beside each indicator. Our management teams establish performance targets by analyzing affordability constraints, historical performance, the complexity of the work involved, and the expectations of Canadians.
Our Program Activity Architecture
The Program Activity Architecture depicted below identifies our program activities and demonstrates how they link to our strategic outcomes. Program activities are groups of related activities that are designed and managed to meet a specific public need and reflect how we allocate and manage our resources to achieve intended results.
Performance Summary
|
2008-2009 Actual[Footnote 1]
|
||||||
|---|---|---|---|---|---|---|
|
Taxpayer and Business Assistance[Footnote 2]
|
||||||
|
Assessment of Returns and Payment Processing[Footnote 3]
|
||||||
|
Accounts Receivable and Returns Compliance[Footnote 4]
|
||||||
|
Benefit Programs[Footnote 5]
|
||||||
|
Internal Services1
|
||||||
|
Taxpayers’ Ombudsman1
|
||||||
2009-2010 Financial Resources (in thousands of dollars)
2009-2010 Human Resources
Contribution of Priorities to Strategic Outcomes
As identified in our 2009-2010 Report on Plans and Priorities, our tax and benefit focus over the planning period was on tax integrity, strengthening service, benefits validation, effective relationships, and business sustainability.
The following table identifies the strategic priorities we pursued in 2009-2010, our results, and how these priorities support our Strategic Outcomes. Additional details concerning individual program activity achievements related to these strategic priorities are provided in Section II: Analysis of Program Activities by Strategic Outcome.
Our Strategic Outcome Measures
We use our strategic outcome measures to gauge the compliance behaviour of Canadian taxpayers. Using data from internal and external sources as a baseline of compliance information, we group our indicators into the following four broad categories of taxpayer obligations to help us measure and assess our results against our Tax Services strategic outcome. These four categories are: registration compliance, filing compliance, remittance compliance, and reporting compliance.
To facilitate further research and discussion of compliance, we analyze the following segments of the population: individuals, self-employed individuals, corporations, GST/HST registrants, and employers. Our discussion of compliance includes macro-indicators which help us evaluate reporting compliance trends and to determine if the economic data provides an early indication of a change in the levels of compliance
Registration compliance
Registration Compliance estimates the proportion of Canadian businesses that have registered as required by law to collect the GST/ HST.
|
Our Indicator[Footnote 1]
|
|||||||
|---|---|---|---|---|---|---|---|
Our estimates of the rate of registration compliance have remained consistently above our target over the past several years.
Our assessment is also supported by the results from our non-registrant program which seeks to ensure that all businesses that are required to register for the GST/HST meet their obligations. Each year, this program identifies several thousand small businesses that are required to register, mostly those that are new or that recently exceeded the registration threshold. We are persuaded, therefore, that there is a very low risk that medium-sized or large enterprises are carrying on business without being registered to collect the GST/HST.
Filing compliance
Filing Compliance indicators estimate the proportion of the Canadian population who file their returns on time.
|
Corporations – taxable incorporated businesses that filed their returns on time[Footnote 1]
|
|||||||
To gauge the compliance of individual taxpayers with their obligation to file a timely return, we compare our data for individual filers 18 years of age and older with Statistics Canada’s Census of Population data for this population. In fact, these estimates have consistently remained above the 92.5% level for every year since the 2001-2002 reporting year, providing a reliable trend for the high degree of voluntary filing compliance that we observe.
Our research on filing behaviour shows that, of the remaining individuals who were not compliant (7.2% in both 2005-2006 and 2009-2010), a large majority file their return within five years. For instance, although 92.6% of individuals filed their returns on time for the 2003 tax year, this percentage rose to 97.4% in less than five years. Filing for the following tax year (2004) showed exactly the same pattern, reaching 97.4% in less than five years, and filing behaviour for subsequent years follows a similar trajectory. We have learned from this research that the majority of non-compliant individual filers comply within about five years, indicating a long-term non-filing rate of about 2.6% for the 18-year-and-older population. Over the last six tax years, more than two thirds of the returns filed late owed no taxes for any tax year at the time of filing, with the remaining third owing taxes for at least one tax year.
Remittance compliance
Remittance compliance indicators estimate the proportion of taxpayers who owed taxes and paid the full amount on time.
|
Trend in ratio of outstanding tax debt to gross cash receipts[Footnote 1]
|
We measure how various taxpayer segments comply with their remittance requirements by the degree to which they paid all taxes, based on their self-assessment, on or before the due date. When monies owed are not paid at the time of filing, we take steps to obtain payment.
For employers who remit at-source deductions on behalf of their employees, the rate of timely remittance has been below our target of 90% for several years. This year, however, our estimate indicates, that employers have remitted in a more timely fashion compared to previous years. On this basis, we are inclined to conclude that we mostly met our target for this compliance measure.
Reporting compliance
We conduct various reviews and audits to identify areas where reporting by individuals and corporations may not be consistent with their obligations to report complete and accurate information.
In 2009-2010, our review programs estimated that 15.4% of claims or deductions made by individuals were non-compliant, meaning they would be disallowed following a review[Footnote 1] . It should be noted that the number and type of credits and deductions have changed over the 2007-2008 to 2009-2010 period, so that the non-compliance rate shown in the above table represents both changes in compliance and in the scope of the study.
For large businesses, we detect and address non-compliance through a combination of corporate audits and risk assessment, which includes research and monitoring. The process involves an annual risk assessment of large taxpayers that uses expertise from across CRA to assess the risk levels using information related to the nature of the taxpayer’s business, their current and past behaviour including aggressive tax planning, transparency, as well as information available from our tax treaty partners that indicate potential risk of non compliant behaviour. We have increased our use of research relating to risk based targeting of large business in response to the evolution of large businesses as a result of globalization and electronic commerce that have made certain complex business structures more prone to risks of non-compliance.
For small businesses, including self-employed individuals, we rely more on risk assessment in selecting businesses for audit. Our Small and Medium-sized Enterprise (SME) audit program selects its audits based on a range of risk information that includes past risk history and business condition indicators that are associated with non-compliance risk.
We also monitor and analyze a number of macro indicators that gauge trends in taxpayer behaviour with respect to reporting compliance.
Macro indicators
Figure 1 The trend in personal income reported to the CRA compared to personal income estimated by Statistics Canada
Figures for the years 2005, 2006, and 2007 have been restated as a result of improved data.
Figure 2 The trend in corporate income taxes that we have assessed compared to corporate profits before tax reported to Statistics Canada
Figures for the years 2001 and 2002 have been restated as a result of improved data.
Figure 3 The trend in net income of unincorporated businesses reported to us compared to Statistics Canada’s estimate for its National Accounts
Figures for the years 2005, 2006, and 2007 have been restated as a result of improved data
Figure 4 The trend in CRA’s net GST/HST revenue compared with retail sales and personal expenditure estimated by Statistics Canada
Conclusion
Our strategic outcome measures provide estimates of filing, registration, remittance, and reporting compliance to gauge the levels of voluntary compliance with Canada’s tax laws. Our review of these estimates for 2009-2010 indicates that voluntary compliance remained generally high, although the dollar value of identified non-compliance is financially significant. Our assessment of our results indicators is that they are consistent with a high level of taxpayer compliance.
It is our assessment that we met our Tax Services strategic outcome in 2009-2010. We draw our overall conclusion largely from the significant proportion of Canada’s revenue base originating from personal income that is subject to third-party reporting, and that a major proportion of the remainder originates from large corporations that are subject to a high rate of audit coverage. In addition, much of our assurance that we are achieving our strategic outcome is based on our robust system of checks and balances, which includes both preventive and detective activities. These activities incorporate a mix of compliance tools to protect Canada’s revenue base from non-compliance.
Our Benefit Programs Strategic Outcome Measures
|
Not Applicable[Footnote 1]
|
|||||||
It is our assessment that we met our Benefit Programs strategic outcome. Through our efforts in administering benefit programs, eligible families and individuals received timely and correct benefit payments, and our government clients were afforded reliable services, enjoyed lower administration costs and more effective compliance. Benefit recipients can rely on the CRA to administer a better-integrated benefits system of high integrity and be assured that the CRA contributes to reducing the overall cost of government in Canada.
For more discussion on our performance against our Strategic Outcomes, please visit:
www.cra.gc.ca/annualreport
Expenditure Profile
For the 2005-2006 to 2009-2010 period, total spending includes all Parliamentary appropriations and revenue sources: Main Estimates, Supplementary Estimates, Treasury Board Vote 5 – Government Contingencies, Vote 15 – Compensation Adjustments and Vote 23 – Paylist Requirements as well as carry forward adjustments. It also includes spending of revenues received through the conduct of the Canada Revenue Agency’s (CRA) operations pursuant to Section 60 of the Canada Revenue Agency Act, Children’s Special Allowance payments, payments to private collection agencies pursuant to Section 17.1 of the Financial Administration Act and statutory disbursements to the provinces under the Softwood Lumber Products Export Charge Act, 2006.
Since 2005-2006, the Canada Revenue Agency’s Vote 1 reference levels have increased primarily as a result of: collective agreements/contract awards; legislative, enhanced audit and enforcement measures, including policy and operational initiatives arising from various Federal Budgets and Economic Statements; the transfer from the Department of Public Works and Government Services Canada for accommodations and real property services; and the assumption of the responsibilities related to the Corporate Tax Administration for Ontario, the Softwood Lumber Agreement and Inter-Provincial Compliance.
The increases to Vote 1 have been offset by a number of reduction exercises including: the 2005 Expenditure Review and Procurement reductions, the 2006 Expenditure Restraint Program, the 2007 Federal Budget Cost Efficiency Savings and the 2008 Federal Budget Strategic Review reductions
The Agency’s Statutory Authorities have fluctuated over the course of the 2005-2006 to 2009-2010 period as a result of: adjustments to the Children’s Special Allowance payments for eligible children in the care of specialized institutions; adjustments to the rates for the contributions to employee benefit plans; increases to the spending of revenues received through the conduct of operations pursuant to Section 60 of the Canada Revenue Agency Act; the introduction from 2007-2008 to 2009-2010 of payments to private collection agencies pursuant to Section 17.1 of the Financial Administration Act; and the statutory disbursements to the provinces under the Softwood Lumber Products Export Charge Act, 2006.
In 2009-2010, of the $4,586.2 million total authority, CRA’s actual spending totalled $4,406.5 million resulting in $179.6 million remaining unexpended at year-end. After deducting unused resources related to the proposed Offshore Trusts initiative, Accommodation and Real Property Services, and costs for the Employee Benefits Plan associated with the conversion of Other Operating to Personnel costs, the remaining $150.3 million is available for use by the Agency in 2010-2011. This amount represents 3.3% of the total authority.
Voted and Statutory Items
Authorities approved after tabled Main Estimates
The following table details the authorities approved for the Agency after the Main Estimates and reconciles with the Total Authorities shown on  .
.
[Footnote 1] Credits and deductions for the random sample in 2009-2010 included an additional credit compared to the previous year with a rate of non-compliance lower than the average. Excluding this item would result in a non-compliance rate of 17%. Similarly, the study that produced the 2008-2009 results included an item that was not part of the key credits and deductions of the prior year. Excluding the latter from both 2008-2009 and 2009-2010 would result in non-compliance rates of 16.2% and 16.7%.
Section II: Analysis of Program Activities by Strategic Outcome
Taxpayer and Business Assistance (PA1)

Benefit to Canadians
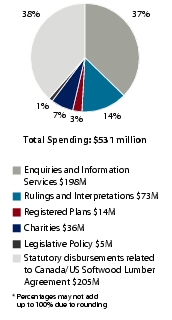
Our Taxpayer and Business Assistance area helps taxpayers, businesses, and registrants meet their obligations under Canada’s self-assessment system by providing access to timely and accurate information. Taxpayers have access to the information they need through a variety of channels (e.g., our Web site, telephones, paper publications, in person, and outreach). It also provides rulings and interpretations to clarify and interpret tax laws, as well as for CPP/EI purposes, and administers federal tax legislation governing registered plans and charities.
Our expected results are the criteria we use to measure our activities and report to Canadians on their effectiveness. We carry out this program activity to achieve the following:
Taxpayers, businesses, and registrants have access to timely and accurate tax information products and services; and non-compliance with applicable legislation by organizations and businesses administering and/or producing registered plans, charities, and excise dutiable products is detected and addressed.
Key Volumetrics
Enquiries and Information Services – We handled more than 17.7 million public enquiries and over 35.6 million tax-related visits to the CRA Web site.
Excise and GST/HST Rulings and Interpretations – We processed over 3,700 written enquiries for rulings and interpretations and handled over 101,000 -related telephone enquiries.
CPP/EI Rulings – We processed over 73,000 requests for rulings.
Registered Plans – We administered approximately 33,000 plans (e.g., registered pension plans, deferred profit sharing plans, supplementary unemployment benefit plans, registered investments), reviewed related returns, and conducted 470 audits.
Charities – We processed over 80,000 annual information returns for registered charities, and conducted 719 audits.
Contribution to CRA Priorities
In support of this priority, in 2009-2010 we accomplished the following:
Lessons Learned
What worked well: We improved the quality of our services to taxpayers by making them more timely, accessible, and easier to use. We maintained our high caller accessibility levels on all of our enquiries lines. Compliance efforts within the tobacco industry were enhanced by developing and testing a prototype tobacco excise stamp. We also implemented initiatives for retroactive refunds and collecting increased charges under the Softwood Lumber Agreement, 2006 (SLA 2006).
What could be improved: In 2009-2010, our challenge was to continue the transformation of all service channels, allowing us to meet client needs in order to encourage voluntary compliance. We must continue to improve our diverse service offerings to address legislative change and increase our responsiveness to the evolving information needs of taxpayers. One way of ensuring that we continue these improvements is to capitalize on emerging technologies.
Performance Report Card
|
87%[Footnote 1]
|
|||||||
|
Percentage of general callers who reach our telephone service[Footnote 2]
|
|||||||
|
Percentage of business callers who reach our telephone serviceFootnote 2
|
|||||||
|
92%[Footnote 3]
|
Assessment of Returns and Payment Processing (PA2)

Benefit to Canadians
Our programs contribute to individuals and businesses meeting their filing, reporting, and payment obligations. We undertake a wide range of activities to assess and process individual and business tax returns and payments. We use risk assessment, third-party data matching, and information validation to detect and address non-compliance.
Our expected results are the criteria we use to measure our activities and report to Canadians on their effectiveness. We carry out this program activity to achieve the following:
Individuals, businesses and registrants are provided timely and accurate tax assessment notices and tax payment processing while targeted reviews detect and address non-compliance by individuals with applicable tax laws.
Key Volumetrics
Individual Returns Processing – We processed more than 26.7 million individual returns, over 11 million of which were paper; refunded almost $26.6 billion to more than 17 million individual taxpayers and processed over 229,000 trust returns. There were more than 338,000 additional individuals enrolled and over 4.5 million visits to My Account.
Business Returns Processing – We processed almost 1.6 million information returns. We also processed more than 1.9 million corporate returns and 7 million GST/HST returns.
We handled more than 34.4 million payments, totalling just over $357.9 billion.
Contribution to CRA Priorities
|
In a continuing effort to expand the population that is eligible to file electronically, we increased the threshold for e-filing a credit return. This allowed registrants to Netfile their return rather than having to send in a paper return for periods with a credit balance greater than $10,000 and less than $50,000.
|
|
|
Over the years, we have improved our ability to conduct post-assessment activities for individual returns. We also recognize the need to put in place equally effective measures to improve the risk assessment capabilities of our compliance programs as they relate to T2 Corporation returns.
With that in mind, we launched the Corporation Assessing Review Program. The goal of this new program is to enhance the CRA’s overall compliance coverage and help to quickly detect non-compliant activity in corporation returns. It is important to note that we are currently in the development stages of this program and,
therefore, we did not produce measurable data for 2009-2010.
|
|
|
In the fall of 2009, the CRA introduced a new online feature called My Payment. This service lets individuals and businesses make payments electronically through a secure link with participating Canadian financial institutions that offer the Interac�[Footnote
1] Online payment service. My Payment should simplify accounting because the transfer is immediate; there is no need for taxpayers to pay early to make sure their payment arrives on time or to monitor their account because of an outstanding cheque.
|
|
|
Our Represent a Client service, which gives authorized representatives a secure, single point of access to multiple clients’ information, continues to attract considerable interest in the representative community. In 2009-2010, the CRA made it possible for business owners and senior
administrators to view transactions completed by representatives on individual accounts and for representatives to download client lists.
|
|
|
We continued to expand the use of the Business Number as a common client identifier for businesses to securely and efficiently interact with various levels of government. In the fall of 2009, we replaced the Filer Identification Number with the Business Number. The former Filer Identification Number was used as the account number by
financial institutions and trust administrators to file T5 information returns. This latest conversion may reduce the administrative burden on clients as there will be fewer accounts for clients to maintain. It also contributes to the ongoing efforts in the broader public sector to simplify and streamline the way businesses deal
with the federal government
|
Lessons Learned
What worked well: We expanded our electronic service options to make it easier for taxpayers to interact with us. We processed individual and business tax and information returns and payments accurately and on time. We carried out pre-assessment and post-assessment activities to detect and address instances of non-compliance.
What could be improved: This program activity plays a key role as Canadians make use of measures introduced through budget announcements and economic updates at the federal, provincial, and territorial levels of government. Under tight timeframes, our challenge is to ensure that these measures are in place and that we are positioned to maintain effective delivery of our programs while continuing to focus on long-term sustainability with respect to modernization, integration, financial limitations and public expectations.
Performance Report Card
|
Service Standards[Footnote 1]
|
|||||||
|
Processing T1 individual income tax returns (electronic): within an average of 2 weeks [Footnote 2]
|
|||||||
|
Not Available[Footnote 3]
|
|||||||
Accounts Receivable and Returns Compliance (PA3)

Benefit to Canadians
Our Accounts Receivable and Returns Compliance area manages the largest debt collection service in Canada. It collects receivables arising from taxes (income tax,GST/HST) and programs such as the Canada Pension Plan, Employment Insurance, and defaulted Canada student loans. In addition, this area promotes compliance with Canada’s tax legislation covering employers, payroll, and GST/HST.
Our expected results are the criteria we use to measure our activities and report to Canadians on their effectiveness. We carry out this program activity to achieve the following:
Non-compliance by individuals, businesses and registrants with the filing, registration, and remitting requirements of applicable tax laws is detected and addressed to protect Canada’s revenue base.
Accounts Receivable – TSO cash collections totalled $12.4 billion of which the National Pools actions contributed $1.1 billion. We resolved over 95% of the dollar value of new debt intake.
Returns Compliance – More than 728,000 returns were obtained from individuals and corporate taxpayers who had not filed their returns, over 7,600 non-registrants were identified and 552,000 payroll non-compliance occurrences were completed. Our Contract Payment Reporting Initiative secured a total of 43,425 additional individual and corporate tax returns.
Contribution to CRA Priority
Lessons Learned
What worked well: In 2009-2010, we mostly met the targeted level of resolving our tax debt and government programs’ (non-tax) debt on a timely basis. Our tax debt and government programs’ (non-tax) debt were within targeted levels. Non-compliance was detected and addressed within targets.
What could be improved: Our challenge is to identify, address, and prevent non-compliance, and to ensure we continue to resolve tax debt on a timely basis and keep it within targeted levels
Performance Report Card
|
Dollar value of TSO tax accounts receivable older than five years ($ billions)[Footnote 1]
|
|||||||
|
$1.4[Footnote 2]
|
Reporting Compliance (PA4)

Benefit to Canadians
We undertake examinations, audits, and investigations to ensure compliance with Canada’s tax laws. This includes verification and enforcement activities at the domestic and international level, as well as the administration of international tax agreements. We also provide information to taxpayers to help them comply. We conduct research to improve identification of non-compliance and develop strategies to address it.
Our expected result is the criteria we use to measure our activities and report to Canadians on their effectiveness. We carry out this program activity to achieve the following:
Non-compliance by individuals, businesses and registrants with the reporting requirements of the legislation the CRA administers is identified and addressed to protect Canada’s revenue base.
Key Volumetrics
International and Large Businesses – We conducted 51,600 audits, resulting in a fiscal impact of $7.2 billion.
Small and Medium Enterprises – We conducted 380,373 audits and examinations, resulting in a fiscal impact of almost $2.1 billion.
Enforcements and disclosures – We conducted 928 audits under the Special Enforcement Program, identifying $78 million in additional tax owing. We also referred 149 income tax and GST/HST cases to the Public Prosecution Services of Canada.
Scientific Research and Experimental Development Program – This program provided almost $3.3 billion in tax credits to over 21,000 claimants.
Contribution to CRA Priorities
Lessons Learned
What worked well: In 2009-2010, we continued our strong enforcement record, promoted public messaging to deter non-compliance, and enhanced the administration of the Voluntary Disclosures Program and the Scientific Research and Experimental Development program. We completed our second Compliance Review, identifying five major compliance
priorities, and worked to improve our understanding of compliance risks that challenge the Canadian tax system. Over the last few years, our assessment of having met our expected result for reporting compliance activities has been based on a variety of performance indicators as we try to find those that most effectively measure achievement of the result. This year, we have introduced several new
indicators into the performance report card, on , that focus on the extent to which our compliance activities resulted in a change to the amount of tax owed, and the revenue recovered through those changes. We see an ongoing challenge in measuring how effective our verification, audit and enforcement activities are
in addressing and detecting overall reporting non-compliance
What could be improved: In 2009-2010, as in previous years, the increasing complexity of the Canadian economies presents ongoing challenges to detecting and deterring non-compliance. Although we continue to achieve strong ratings overall for our performance management framework, we recognize the need to further strengthen this area. This challenge is common to tax administrations internationally, but we will continue to work towards using the best measures available to assess that we are achieving the desired result for reporting compliance.
Performance Report Card
|
Financial recoveries[Footnote 1] as a percentage of estimate:
|
|||||||
|
Percentage of cases[Footnote 2] resulting in a change:
|
|||||||
Appeals (PA5)

Benefit to Canadians
Taxpayers can dispute assessments and determinations pertaining to income tax and commodity taxes, and Canada Pension Plan/Employment Insurance (CPP/EI) assessments and rulings.
Our Service Complaints process provides taxpayers with a formal avenue of recourse to the service rights contained in the Taxpayer Bill of Rights. If taxpayers disagree with a decision resulting from our Service Complaints process, they can file recourse actions with the Taxpayers’ Ombudsman.
Our expected results are the criteria we use to measure our activities and report to Canadians on their effectiveness. We carry out this program activity to achieve the following:
Taxpayers receive a timely and impartial review of contested decisions made under legislation administered by the CRA and the handling of service complaints is timely and consistent.
Key Volumetrics
Disputes – We resolved more than 67,000 disputes. The total taxes in dispute amount to more than $13.7 billion (the value of workable files is $4.7 billion, and the value of non-workable files is almost $9.0 billion.
Taxpayer Relief Provisions – A total of 82,911 requests for relief from interest and penalties were processed by the CRA; 51,218 of these requests were allowed in favour of the taxpayer. The total value of all cancellations and waivers was more than $478 million for 332,141 taxpayers.
Contribution to CRA Priorities
Lessons Learned
What worked well: In 2009-2010, we demonstrated fairness in our review of taxpayers’ contested decisions. However, it has taken us more time to provide decisions due to a sharp increase in disputes related to aggressive tax planning schemes. Service complaints and the taxpayer relief provisions were administered consistently, in support of our commitment to fairness.
What could be improved: Our challenge is to manage CRA business processes to effectively respond to the increased volume of income tax disputes resulting from targeted compliance activities that focus on questionable tax planning and other schemes.
Performance Report Card
|
Workable days to complete a case[Footnote 1]
|
|||||||
Benefit Programs (PA6)

Benefit to Canadians
We contribute directly to the economic and social well-being of Canadians by delivering benefits, credits, and services to eligible recipients. We administer the Canada Child Tax Benefit, the goods and services tax/harmonized sales tax credit, and the Children’s Special Allowances, which are core federal programs that issue benefit payments. We also deliver the Universal Child Care Benefit on behalf of Human Resources and Skills Development Canada, the Disability Tax Credit, as well as other benefit and credit programs and services on behalf of provincial, territorial, and other federal government clients.
Our expected results are the criteria we use to measure our activities and report to Canadians on their effectiveness. We carry out this program activity to achieve the following:
Benefit recipients are provided timely and accurate eligibility determinations and payments, and have access to timely and accurate information.
Key Volumetrics
Benefit Programs Client Services – We handled almost 6.5 million telephone enquiries.
Benefit Programs Administration – We issued 88.5 million benefit payments totalling over $17.6 billion[Footnote 1] to almost 11.5 million recipients. We determined $816 million in Disability Tax Credit (DTC) for 547,000 individuals. We processed 729,000 applications and elections, 726,000 account maintenance adjustments, and 1,023,000 in-year GST/HST credit account redeterminations.
Direct transfer payments under statutory programs – We issued $215 million under the Children’s Special Allowances (CSA) program.
Contribution to CRA Priorities
Lessons Learned
What worked well: In 2009-2010, we met each challenge we encountered. We maintained exceptional performance in delivering programs while incorporating important additions and changes to our programs and services. Our results show that we consistently administered reliable, high-quality programs and services to benefit recipients and client governments during one of the most difficult economic periods that Canadians have faced in many years.
What could be improved: We understand the importance that Canadians place on our reliable and accurate delivery of payments and credits on behalf of our government clients. We are challenged each year to ensure that increased needs and limited resources do not have a negative effect on our delivery of essential benefits and services.
Performance Report Card
|
Percentage of CCTB callers who reach our telephone service[Footnote 1]
|
|||||||
Internal Services (PA7)

Benefit to Canadians
The CRA delivers high-quality tax, benefit, and related services on behalf of governments across Canada. Providing internal services is an integral part of the overall effectiveness of our program delivery. We set the business conditions that foster excellence in program delivery through responsible management practices, such as effective accountability and oversight measures, as well as sound management of enterprise risk, human resources, information technology, business knowledge, information, and growth. In support of our two strategic themes, our internal services must be fully integrated to ensure that our tax and benefit services have the guidance, infrastructure, and resources needed for successful delivery.
Contribution to CRA Priorities
Lessons Learned
What worked well: In 2009-2010, we delivered on our management priorities through timely and responsive decision-making, a fully accountable senior management culture, streamlined management policies and practices, and improved planning and reporting.
What could be improved: In 2009-2010, our challenge was to make the best use of all available resources, from human resources capacity and capability to information technology sustainability and responsiveness to support new and ongoing business needs, and cope with the shifting landscape in which the CRA operates.
Our efforts over the past year in implementing the action plan initiatives demonstrate our commitment to make sure that Canadians have all of the information they need, not only to meet their tax obligations but also to take full advantage of the tax savings to which they may be entitled.
Canada’s Economic Action Plan Initiatives
Through Canada’s Economic Action Plan, the federal government provided significant new personal income tax relief. The measures were effective as of January 1, 2009, and provided benefits particularly for low- and middle-income Canadians.
The CRA implemented many of the action plan initiatives, like personal income tax relief and an increased Working Income Tax Benefit, as well as other measures to help families, seniors, workers, and persons with disabilities. We also administered corporate income tax reductions that were put in place to help Canadian businesses weather the effects of the global economic challenges, to maintain and create jobs, and to emerge from the economic downturn even stronger.
The CRA was provided with $12.3 million in action plan funding, related to the Home Renovation Tax Credit, Home Buyers Tax Credit, late filing and incorrect format penalties and simplification of GST/HST for the direct selling industry. This amount represents only 0.25% of the CRA’s 2009-2010 authorities.
In February of 2009, shortly after the introduction of the Economic Action Plan, our minister announced the launch of the “You’ve earned it. Claim it” advertising campaign to inform Canadians of the tax credits and benefits available to them.
The action plan highlighted the following programs that we administered and delivered on behalf of Canadians.
The Working Income Tax Benefit Program provided a refundable tax credit for eligible working low-income individuals and families who are already in the workforce and encouraged Canadians to enter the workforce.
For the 2009 tax year, the Home Renovation Tax Credit Program provided a non-refundable tax credit for eligible expenses incurred for work performed or goods acquired for an eligible dwelling.
The Canada Child Tax Benefit Program provided a tax-free monthly payment to eligible families to help them with the cost of raising children under the age of 18. Through the Economic Action Plan, the federal government raised the level at which the National Child Benefit Supplement amount for low-income families and the Canada Child Tax Benefit are phased out, so that eligible families with two children received an additional benefit of up to $436 starting in July 2009.
[Footnote 1] Including the $816 million in entitlements to the DTC program, which are delivered through the T1 assessing process rather than as direct cash payments, the total amount of benefits and credits issued is $18.4 billion.
Section III: Supplementary Information
Statement of Management Responsibility
We have prepared the accompanying financial statements of the Canada Revenue Agency according to accounting principles consistent with those applied in preparing the financial statements of the Government of Canada. Significant accounting policies are set out in note 2 to the financial statements. Some of the information included in the financial statements, such as accruals and the allowance for doubtful accounts, is based on management’s best estimates and judgments, with due consideration to materiality. The Agency’s management is responsible for the integrity and objectivity of data in these financial statements. Financial information submitted to the Public Accounts of Canada and included in the Agency’s Annual Report is consistent with these financial statements.
To fulfill its accounting and reporting responsibilities, management maintains sets of accounts which provide records of the Agency’s financial transactions. Management also maintains financial management and internal control systems that take into account costs, benefits, and risks. They are designed to provide reasonable assurance that transactions are within the authorities provided by Parliament, and by others such as provinces and territories, are executed in accordance with prescribed regulations and the Financial Administration Act, and are properly recorded to maintain the accountability of funds and safeguarding of assets. Financial management and internal control systems are reinforced by the maintenance of internal audit programs. The Agency also seeks to assure the objectivity and integrity of data in its financial statements by the careful selection, training, and development of qualified staff, by organizational arrangements that provide appropriate divisions of responsibility, and by communication programs aimed at ensuring that its regulations, policies, standards, and managerial authorities are understood throughout the organization.
The Board of Management is responsible for ensuring that management fulfills its responsibilities for financial reporting and internal control and exercises this responsibility through the Audit Committee of the Board of Management. To assure objectivity and freedom from bias, these financial statements have been reviewed by the Audit Committee and approved by the Board of Management. The Audit Committee is independent of management and meets with management, the internal auditors, and the Auditor General of Canada on a regular basis. The auditors have full and free access to the Audit Committee.
The Auditor General of Canada conducts an independent audit and expresses opinions on the accompanying financial statements.
Linda Lizotte-MacPherson
Commissioner and Chief Executive Officer
Stephen O’Connor
Chief Financial Officer and Assistant Commissioner, Finance and Administration
Ottawa, Ontario
August 23, 2010
Financial Performance Information – Parliamentary Appropriations
Introduction
This section of the CRA Performance Report 2009-2010 provides the details of the Agency’s resource management performance for the purpose of reporting to Parliament on the use of appropriations in 2009-2010. This complements the information provided in the spending profile sections under each Program Activity and satisfies the reporting requirements set for departmental performance reports.
Financial reporting methodologies
The CRA’s funding is provided by Parliament through annual appropriations (modified cash accounting basis) and, in this section, the CRA reports its expenditures and performance to Parliament, together with details on the management of Parliamentary appropriations on the same basis. In addition to the above reporting requirements, the CRA is also required to prepare its annual financial statements in accordance with the accounting principles applied in preparing the financial statements of the Government of Canada (full accrual accounting basis). Accordingly, the audited Statement of Operations – Agency Activities in our 2009-2010 Annual Report includes certain items such as services received without charge from other government departments and federal agencies. A reconciliation can be found in note 3b in the same report.
The CRA is participating in a Treasury Board Secretariat (TBS) pilot project to extend accrual accounting to the budgeting and appropriations process. As such, CRA prepared and included future oriented financial statements (FOFS) in the 2009-2010 Report on Plans and Priorities (RPP). This future-oriented financial information was prepared on an accrual basis to strengthen accountability and improve transparency and financial management. As part of the analysis of Net Cost of Operations, this DPR compares actual results to the initial future oriented financial statements contained in the 2009-2010 RPP.
CRA financial information
Activities of the Agency
|
Main Estimates[Footnote 1]
|
|
|
Planned Spending[Footnote 2]
|
|
|
Total Authorities[Footnote 3]
|
|
The Financial Statements – Agency Activities reports $3,985.2 million as total Parliamentary appropriations used (note 3b in our 2009-2010 Annual Report shows the reconciliation to the net cost of operations). The difference from the $4,406.5 million reported in this section is explained by three items reported in the Financial Statements – Administered Activities: the statutory disbursements to provinces under the Softwood Lumber Products Export Charge Act, 2006, $205.5 million; the Children’s Special Allowance, $215.3 million; and the Relief for Heating Expenses, $0.5 million (part of Vote 1, Program Expenditures).
Overview
For 2009-2010, Parliament approved $4,388 million through the Main Estimates, as shown in CRA’s 2009-2010 Report on Plans and Priorities.
The 2009-2010 Main Estimates were adjusted to include:
- $147.1 million for the carryforward from 2008-2009;
- $70.9 million for maternity and severance payments;
- $9.1 million for increased Respendable Revenue mainly to provide services to Service Canada;
- $56.6 million for Collective Agreements;
- $12.3 million for measures arising from the 2009 Federal Budget in support of Canada’s Economic Action Plan;
- $18.6 million transferred from Public Works and Government Services Canada for accommodation services;
- $11.0 million for the Government advertising programs;
- $1.6 million for Court Awards and Crown Assets Disposal;
- $0.9 million to increase Federal Public Service Student Employment;
- $6.3 million for the Financial Interoperability and Stewardship Initiative in support of the Corporate Administrative Systems;
- $40.0 million for the Provincial Sales Tax Administration Reform; and
- $56.0 million for the employee benefits plan costs.
These increases were offset by the following reductions:
- $223.5 million for the statutory disbursements to Provinces under the Softwood Lumber Products Export Charge Act, 2006;
- $2.0 million for private collection agencies;
- $5.7 million for statutory Children’s Special Allowance payments;
- $0.6 million for the Public Opinion Research;
- $0.2 million transferred to the Treasury Board Secretariat to support the National Managers’ Community; and
- $0.2 million transferred to Foreign Affairs and International Trade to support the CRA staff located at missions abroad.
This resulted in total approved authorities of $4,586.2 million for 2009-2010, representing an in-year increase of 4.5% over the Main Estimates.
Of the $4,586.2 million total authority, CRA’s actual spending totalled $4,406.5 million resulting in $179.6 million remaining unexpended at year-end. After deducting unused resources related to the proposed Offshore Trusts initiative, Accommodation and Real Property Services as well as costs for the Employee Benefits Plan associated with the conversion of Other Operating to Personnel costs, the remaining $150.3 million is available for use by the Agency in 2010-2011. This amount represents 3.3% of the total authority.
The $150.3 million carry forward to 2010-2011 will be directed primarily to selected priority investments related to:
- Major project and infrastructure spending (e.g., Compliance Systems Redesign, Tax Free Savings Account, Major Tenant Services and Information Technology Infrastructure);
- Special purpose funding (e.g., Provincial Sales Tax Administration Reform, Charities Partnership and Outreach Program, Minist�re du Revenu du Qu�bec for the Administration of the GST);
- Various other operational and workload pressures.
Revenues administrated by the Agency
Total revenues administered by the CRA amount to some $279 billion in 2009-2010, a decrease of 3% from the $287.5 billion administered in 2008-2009.
Financial Highlights
For the period ending March 31, 2010
Statement of Financial Position
For the period ending March 31, 2010
Statement of Operations
There are three significant program administration changes which have influenced the results in the Financial Statements.
1. Provincial Sales Tax Administration Reform
In 2009, the provinces of Ontario and British Columbia entered into Memoranda of Agreement with the Government of Canada to harmonize their provincial sales taxes with the federal Goods and Services Tax (GST) effective July 1, 2010.
The CRA received incremental funding of $47.5 million (including employee benefit plan contributions) in 2009-2010 to ensure that necessary systems and processes were in place for the implementation of HST in Ontario and British Columbia, to communicate the necessary information to businesses and individual taxpayers, and to prepare for the integration of the affected provincial employees into the Agency's workforce. The level of funding to be provided in subsequent years is expected to be confirmed by the Treasury Board in the near future.
The implementation of a harmonized administration and the successful transition of provincial employees will continue to be a priority for the CRA in 2010-2011.
2. Corporate Tax Administration for Ontario
The CRA has commenced processing Ontario T2 harmonized corporate income tax returns and is also providing related services, including audits, rulings, interpretations, objections and appeals. As such the administration of Ontario corporate tax is now fully integrated into the CRA’s base operations.
The CRA received $210.5 million of Federal Government funding over four years (2006-2007 to 2009-2010) for developmental and transitional costs relating to this initiative. Of this amount $83.2M was expended in 2009-2010. Under the Memorandum of Agreement Concerning a Single Administration of Ontario Corporate Tax, signed on October 6, 2006, the Governments of Canada and Ontario agreed to transfer the administration of Ontario corporate income tax from the Ontario Ministry of Revenue to the CRA starting in the 2009 taxation year. The Corporate Tax Administration for Ontario initiative has now met its key milestones, and all necessary agreements and systems changes have been in place since April 2009.
3. Investment in Information Technology systems
In fiscal year 2010, the CRA continued to invest in information technology (IT) systems in order to ensure modern and efficient program delivery. The Agency had several large-scale projects that required substantial investments in the development of IT systems. Combined with the acquisition of IT hardware, the Agency invested $137 million in IT related capital assets this fiscal year. The value of these new capital assets has been offset by amortization expenses of $87 million in 2009-10.
The following figure outlines investments in information technology that have been accounted for as capital assets in the last four years.
Figure 13 Information Technology Investment in Capital Assets
Analysis of Net Cost of Operations
The Agency’s 2009-2010 net cost of operations decreased by $24 million from 2008-2009. Agency expenses totalled $4,441 million in 2009-2010 (2008-2009 – $4,434 million) (see Note 9 of the Financial Statements – Agency Activities for the breakdown of expenses by type). When adjusting for non-tax revenue of $569 million (2008-2009 – $538 million), the net cost of operations amounts to $3,872 million, as illustrated below:
Table 1 Details on the net cost of operations
The Agency’s expenses are composed of 73% in personnel expenses (salaries, other allowances and benefits) and 27% in non-personnel expenses, as illustrated in the figure below
Personnel expenses are the primary drivers for the Agency. A number of factors contributed to the net decrease of $10 million for this type of expenses in 2009-2010. Additional costs were incurred for salary revisions pursuant to collective agreements provisions and in the staff complement due to new initiatives such as the Provincial Sales Tax Administration Reform, the Corporate Tax Administration for Ontario, Ontario Aggressive International Tax Planning and others announced in recent Federal Budgets but were offset by a decrease in the cost of severance benefits.
In total, non-personnel expenses increased by $18 million. Significant elements of non-personnel expenses are composed of accommodation, transportation and communication expenses. The reduction of $33 million in information technology costs is attributable to decreases in the purchase of computer equipment and software as well as decreases in loss on disposals and write offs of capital assets. Federal Goods and Services Tax administration costs by the Province of Qu�bec have increased due to higher salary costs.
Figure 14 Total Expenses by Type
Comparison of Future-oriented Financial Information and Actual Results
The Agency’s final net cost of operations for 2009-2010 was $124 million greater than was anticipated in the future-oriented financial statements included in the 2009-2010 RPP ($3,872 million – $3,748 million). This represents a 3.3% variance and is explained as follows:
- The future-oriented financial statements were prepared based on Parliamentary appropriations received as of the 2009-2010 Main Estimates and did not consider expenditures as a result of resources received for the remainder of the year for such items as:
- These incremental resources are offset by decreases arising mainly from statutory disbursements to the provinces under the Softwood Lumber Products Export Charge Act, 2006.
- Other explanations for the variance relate to accrual adjustments as a result of changes in asset acquisitions, amortization, loss on disposal /write-off of capital assets and personnel related costs for collective agreements; maternity and severance payments, and employee benefits plan.
Audited and Unaudited Financial Statements
For supplementary information on the CRA’s audited and unaudited financial statements, please visit www.cra.gc.ca/annualreport.
Comparison of future-oriented financial information can be found on CRA’s Web site at: www.cra.gc.ca.
Electronic Tables
The following tables can be found on the Treasury Board Secretariat Web site at
http://www.tbs-sct.gc.ca/dpr-rmr/2009-2010/index-eng.asp.
Sources of Respendable and Non-Respendable Non-Tax Revenue
Non-Respendable Non-Tax Revenue
User Fees Act – Advance Income Tax Ruling Fee
Policy on Service Standards for External Fees – Advance Income Tax Ruling Fee
User Fees Act – Taxation Statistical Analyses and Data Processing Fee
Policy on Service Standards for External Fees – Taxation Statistical Analyses and Data Processing Fee
User Fees Act – Access to Information Processing Fee
Policy on Service Standards for External Fees – Access to Information Processing Fee
Details on Transfer Payment Programs
Children’s Special Allowance Payments (Statutory)
Disbursements to Provinces under the Softwood Lumber Products Export Charge Act, 2006 (Statutory)
Reconciliation to the Statement of Operations
Response to Parliamentary Committees and External Audits
Internal Audits and Evaluations
Other Items of Interest
Rating Our Data Quality
In conjunction with the performance results ratings, we also assign each indicator a data quality rating.
For each indicator, we use consistent approaches in evaluating the information derived from our data collections systems and all other sources. We rely upon CRA managers to vouch for the completeness of the records for data integrity purposes (i.e., data belongs to the same category, is collected for the same period, and by the same method). We examine data for relevance, formulas for accuracy, and other factors that must be considered. We also use comparable information from prior years for the purpose of historical comparison, which often appears in the Canada Revenue Agency Departmental Performance Report. To ensure consistency, we perform the following tasks to verify that the information reported in our numerous reports is valid, reliable, and is accompanied by appropriate evidence:
- Validation: This is a process of verification to ensure that the data meets the requirements for its intended purposes. We review and evaluate data for completeness and plausibility (accuracy, timeliness, interpretability, coherence). We also identify contact information, check calculations, confirm system reliability (verifying the source of information), and note and correct any errors.
- Data quality assessment: We apply a data quality checklist and review prior years’ data to assess the quality of data for each indicator.
- Electronic filing system: We store data in a database for easy reference and further analysis for other purposes.
- Physical filing system: We maintain physical files of the evidence collected from all sources to provide validation and assurance that our data quality ratings are accurate and supported.
We always endeavour to use the most appropriate and reliable data when evaluating our results. There are two main data sources for the Canada Revenue Agency Departmental Performance Report: administrative data (normally communicated in aggregate or after some simple calculations are performed on them) and survey data. All data sources are validated for accuracy and a data quality rating of good, reasonable, or weak, as categorized below, is applied to each indicator.
We believe that these three levels of data quality ratings provide a reasonable assessment of the reliability of the data. Generally, our data sources provide reliable information. In situations where the supporting data is too imprecise to draw firm conclusions, it is reflected in the data quality rating.
Service Standards at the CRA
Our service standards regime is a vital and integral part of our planning, reporting, and performance management processes. Meeting our service standard targets demonstrates that we are responsive to the needs of taxpayers and benefit recipients. This helps establish credibility in our operations and contributes to increasing the level of confidence that Canadians can place in government.
For more information on CRA’s service standards, please visit
www.cra.gc.ca/servicestandards
Sustainable Development
Through the CRA Sustainable Development Strategy 2007-2010, we continued to modernize the way we acquire, use, and dispose of assets. Consistent with the strategy, we realized efficiencies, while reducing the environmental impacts of our operations and programs.
During 2009-2010, about 28% of the total spending on products was identified as green procurement in Synergy, the CRA’s Web-based purchasing system. Eighty percent of new vehicles bought were alternative transportation fuel capable or hybrids, increasing the overall proportion of the CRA vehicle fleet considered green from 43% in 2008-2009 to 47% in 2009-2010 (see figure below).
We reduced our use of office paper by an additional 4.4% to 5,147 sheets per employee, exceeding our sustainable development target of 5,643 sheets (see figure below). This resulted in savings of about $48,000 in office paper costs.
By expanding the No Waste program to six additional CRA facilities, we have now enabled 90% of CRA employees to reduce the amount of solid waste they generate in the workplace. Audits conducted in selected facilities showed that this program helped the CRA divert 84% of solid waste from landfill. To support sustainable service delivery, we also integrated sustainable development criteria into 85% of Memorandums of Understanding and Letters of Intent between the CRA and other organizations.
Strong senior management support and effective communications encouraged employees to apply sustainable development practices in their jobs. For example, 99% of the Executive Cadre had sustainable development commitments in their performance agreements. The Sustainable Development Innovation Fund, which supports employee-driven innovations, funded an additional six initiatives across the CRA. In modernizing the systems that support sustainable development, we enhanced its Web-based performance reporting tool and updated the nine programs that manage the CRA’s key environmental areas (e.g., paper, solid waste).
Figure 16 Sheets of Paper Purchased per CRA Employee
For more information on our sustainable development performance, please visit www.cra.gc.ca/sds.
Board Membership
The Board of Management of the Canada Revenue Agency (CRA) comprises 15 members appointed by the Governor in Council. They include the Chair, the Commissioner and Chief Executive Officer, a director nominated by each province, one director nominated by the territories, and two directors nominated by the federal government. Members of the Board bring a private-sector perspective and business approach to management and, in this regard, champion a significant agenda for change within the CRA.
The following list shows the Board membership as of March 31, 2010.[Footnote 1]

Organizational Structure (as of March 2010)
[Footnote 1] As of March 31, 2010, two positions on the Board were vacant.