
Common menu bar links
Breadcrumb Trail
ARCHIVED - Department of Justice Canada - Report
 This page has been archived.
Archived Content
Information identified as archived on the Web is for reference, research or recordkeeping purposes. It has not been altered or updated after the date of archiving. Web pages that are archived on the Web are not subject to the Government of Canada Web Standards. As per the Communications Policy of the Government of Canada, you can request alternate formats on the "Contact Us" page.
SECTION III: SUPPLEMENTARY INFORMATION
Financial Highlights
The financial highlights presented within this DPR are intended to serve as a general overview of Department of Justice financial positions and operations. The Department's financial statements are available on the web site at: http://canada.justice.gc.ca/eng/dept-min/pub/dpr-rr/index.html
| Condensed Statement of Financial Position At end of Fiscal Year (March 31, 2010) | % Change | 2008-09 | 2009-10 |
|---|---|---|---|
| Financial assets | 11.1% | 417,708 | 464,066 |
| Non-financial assets | 9.4% | 36,914 | 40,367 |
| Total Assets | 454,622 | 504,433 | |
| Total | 11.0% | 454,622 | 504,433 |
| Liabilities | |||
| Total Liabilities | 4.1% | 562,536 | 585,355 |
| Equity | |||
| Total Equity | -25.0% | -107,914 | -80,922 |
| Total | 11.0% | 454,622 | 504,433 |
| Condensed Statement of Operations.At end of Fiscal Year (March 31, 2010) | % Change | 2008-09 | 2009-10 |
|---|---|---|---|
| Expenses | 5.5% | 1,018,965 | 1,075,361 |
| Total Expenses | 5.5% | 1,018,965 | 1,075,361 |
| Revenues | 11.8% | 242,345 | 270,948 |
| Total Revenues | 11.8% | 242,345 | 270,948 |
| NET COST OF OPERATIONS | 3.6% | 776,620 | 804,413 |
Financial Highlights Charts/Graphs
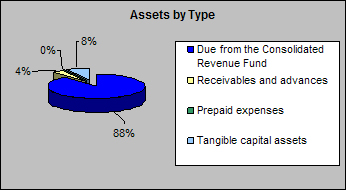
Total assets were approximately $504 million at the end of 2009-10, an 11% increase over the previous year's total. This is due to an increase in the Consolidated Revenue Fund of 10.5%. The Consolidated Revenue Fund represents 88% of total assets at approximately $445 million. Tangible capital assets represented approximately $40 million or 8% of total assets while receivables and advances represented approximately $19M or 4% of total assets.
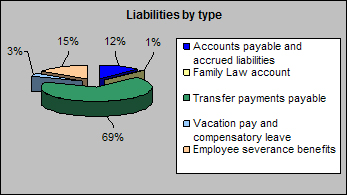
Total liabilities were $585 million at the end of 2009-10, a 4.1% increase from the previous year's total. Transfer payments payable represents the largest portion of liabilities at $400 millions or 69% of total liabilities and increased by 14.1% over the previous year.
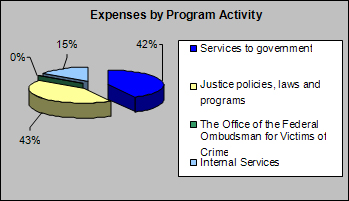
Total expenses for the Department were $1,075 million in 2009-10, a 5.2% increase from the previous year's total. Of this amount $449.6M or 42% of funds were spent on Services to Government while Justice policies, laws and programs represented $462.5M or 43% of total expenses. The Justice policies, laws and programs represent the largest increase of 10.5% over the previous year.
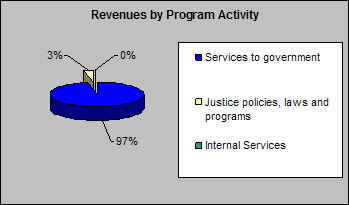
The Department's total revenues amounted to approximately $271 million for 2009-10; an 11.8% increase from 2008-09. Ninety seven percent of the Department's revenue was derived from Services to government, a 12% increase over the previous year.
Financial Statements
The Department's financial statements are available on the web site at: http://canada.justice.gc.ca/eng/dept-min/pub/dpr-rr/index.html
List of Supplementary Information Tables
All electronic supplementary information tables found in the 2009-10 Departmental Performance Report can be found on the Treasury Board of Canada Secretariat's website at: http://www.tbs-sct.gc.ca/dpr-rmr/st-ts-eng.asp.
- Sources of Respendable and Non-respendable Revenue
- User Fees/External Fees
- Details on Transfer Payments Programs
- Horizontal Initiatives
- Green Procurement
- Response to Parliamentary Committees and External Audits
- Internal Audits and Evaluations