
Common menu bar links
Breadcrumb Trail
ARCHIVED - Environment Canada - Report
 This page has been archived.
Archived Content
Information identified as archived on the Web is for reference, research or recordkeeping purposes. It has not been altered or updated after the date of archiving. Web pages that are archived on the Web are not subject to the Government of Canada Web Standards. As per the Communications Policy of the Government of Canada, you can request alternate formats on the "Contact Us" page.
Section III: Supplementary Information
Financial Highlights
The financial highlights presented on the following pages offer an overview of Environment Canada’s financial position and operations. The detailed unaudited departmental financial statements can be found on Environment Canada’s website.
Environment Canada’s unaudited financial statements are prepared in accordance with accrual accounting principles and, therefore, are different from appropriation-based reporting, which is reflected in Sections I and II of this report. Sections I and II are prepared on a modified cash basis, and not an accrual basis. A reconciliation between Parliamentary Appropriations used (modified cash basis) and the Net Cost of Operations (accrual basis) is set out in Notes 2 and 3 of Environment Canada’s unaudited financial statement at http://www.ec.gc.ca/default.asp?lang=En&n=31D9FF32-1.
| Condensed Statement of Operations At End of Year (March 31, 2010) (000s) |
% Change | 2010 | 2009 |
|---|---|---|---|
| Expenses | |||
| Total Expenses | -1.0% | 1,225,291 | 1,237,755 |
| Revenues | |||
| Total Revenues | 7.6% | (87,425) | (81,239) |
| NET COST OF OPERATIONS | -1.6% | 1,137,866 | 1,156,516 |
| Condensed Statement of Financial Position At End of Year (March 31, 2010) (000s) |
% Change | 2010 | 2009 |
|---|---|---|---|
| Assets | |||
| Total Assets | -1.4% | 625,225 | 634,018 |
| Total | -1.4% | 625,225 | 634,018 |
| Liabilities | |||
| Total Liabilities | -2.0% | 493,639 | 503,719 |
| Equity | |||
| Total Equity of Canada | 1.0% | 131,586 | 130,299 |
| Total | -1.4% | 625,225 | 634,018 |
A change in Treasury Board accounting policy for 2009–2010 requires the presentation of amounts due from the Consolidated Revenue Fund as an asset in the Statement of Financial Position. The amounts for Assets and Equity of Canada for 2008–2009 have been re-stated to reflect this change and allow for appropriate comparison with the previous year.
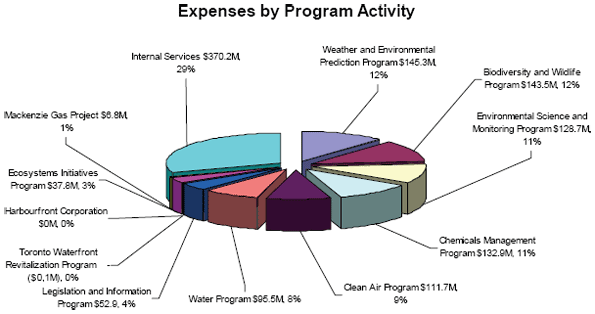
Total departmental expenses by Program Activity have decreased by $13 million or 1 percent, from $1,238 million in 2008–2009 to $1,225 million in the current year. The major elements contributing to this overall decrease are Transfer Payments, with a $82.6 million decrease offset by a $33.7 million increase in salary expenses and a $30.7 million increase in Environmental Liabilities. In addition, the 2009–2010 variances can also be explained in part by the fact that the Internal Services were not re-allocated to the programs but are reported on their own, as required by the Receiver General for Canada.
See note 13 – Segmented information to the departmental financial statements at http://www.ec.gc.ca/default.asp?lang=En&n=31D9FF32-1
The $6.8 million for the Mackenzie Gas Project reflects both Mackenzie Gas Project Office and Program spending
Total revenues amounted to $87.4 million for 2009–2010. The majority of the revenue was derived from Environment Canada’s activities under the "Weather and Environmental Prediction Program."
Other revenue items include ocean disposal permit applications, meteorological services, hydraulics laboratory, and ocean disposal monitoring fees. Environment Canada has had a significant increase in revenues in 2009–2010 ($6.2 million).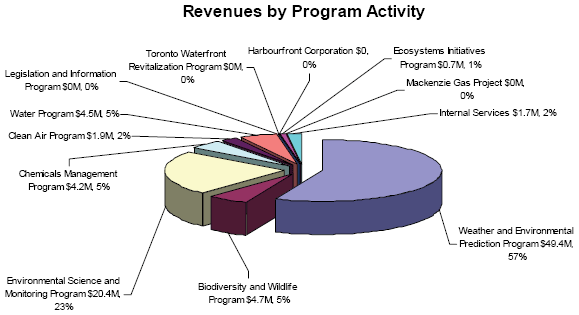
See note 13 – Segmented information to the departmental financial statements at http://www.ec.gc.ca/default.asp?lang=En&n=31D9FF32-1
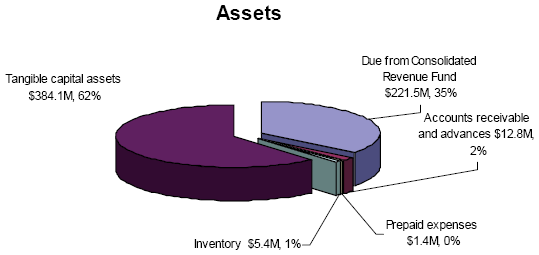
Total assets, valued at $625 million, have decreased by $8.8 million. This decrease in Environment Canada’s total asset valuation is mainly attributable to a decrease in amounts due from the Consolidated Revenue Fund with a decrease of $37.8 million (from $259.3 million in 2008–2009 to $221.5 million in 2009–2010) offset by an increase in tangible capital assets of $26.9 million (from $357.2 million in 2008–2009 to $384.1 million in 2009–2010).
This increase in Tangible Capital Assets is the result of classifying and recording the supercomputer lease agreement as a capital lease ($13 million additional net book value), in combination with a net increase of $21 million attributable to Assets under Construction that were put into service. Both of these increases are offset by a net decrease of $7 million (net value book) across all other capital assets categories.
See notes 4 and 5 – Accounts receivable and advances; Tangible Capital Assets to the departmental financial statements at http://www.ec.gc.ca/default.asp?lang=En&n=31D9FF32-1
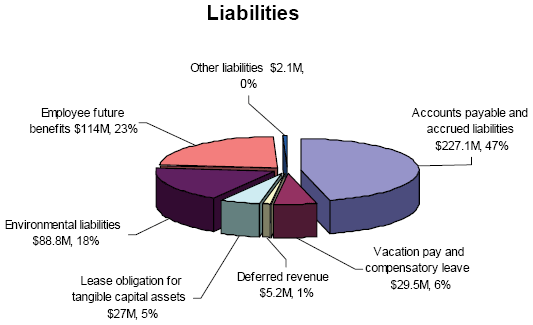
Total liabilities were $493.6 million at the end of 2009–2010. This represents a decrease of $10 million (2 percent) from the previous year’s total liabilities of $503.7 million. The Accounts Payable and Accrued Liabilities continue to represent the largest component of liabilities at $227.1 million or 47 percent of total liabilities, showing a decrease of 15 percent from the previous year mainly due to a decrease of $29.3 million related to a liability with Nature Conservancy of Canada. Lease obligations for tangible capital assets increased by $12.5 million. This is mainly due to the conversion of the lease for the super computer now being recorded as a capital lease where previously it was reported as an operating lease.
See notes 6 to 11 – to the departmental financial statements at http://www.ec.gc.ca/default.asp?lang=En&n=31D9FF32-1
Supplementary Information Tables
All electronic supplementary information tables found in the 2009–2010 Departmental Performance Report can be found on the Treasury Board of Canada Secretariat’s website at www.tbs-sct.gc.ca/dpr-rmr/st-ts-eng.asp.
- Details on Transfer Payment Programs
- Up-Front Multi-Year Funding
- Green Procurement
- Horizontal Initiatives
- Response to Parliamentary Committees and External Audits
- Internal Audits and Evaluations
- Sources of Respendable and Non-Respendable Revenue
- User Fees and External Fees
- Status Report on Projects Operating with Specific Treasury Board Approval
Other Items of Interest
The following information is part of Environment Canada’s Supplementary Information to the 2009–2010 Departmental Performance Report (DPR). Official Languages, Management Accountability Framework and Indicators of Environmental Sustainability are introduced as Other Items of Interest.
Official LanguagesUnder the Official Languages Act (OLA), Environment Canada’s (EC) obligations include providing bilingual services to the public and ensuring that the language of work provisions are respected at all times.
Environment Canada is committed to ensuring that members of the public can exercise their right to communicate with the Department and obtain services in the official language (OL) of their choice. To this effect, Environment Canada has revised and communicated the guidelines on the provision of bilingual service and active offer via the Intranet. Reminders on OL obligations related to service to the public and active offer were also sent to managers and employees across the country. Furthermore, to measure Environment Canada's compliance with Part IV of the OLA, a monitoring strategy to assess the Department's efficiency in providing bilingual service and active offer to the public was developed in 2009–2010. The results of this assessment, conducted twice a year, will be reported back to Branch Heads for the implementation of corrective measures. With respect to language of work, the new internal Guidelines on Language of Work will be communicated in 2010–2011. A monitoring strategy will also be developed to assess the Department's capacity to create and maintain a work environment that is conducive to the use of both official languages for its employees. Furthermore, the progress of all employees who require language training to meet the language requirements of their position and their access to and completion of such training within the timeframe prescribed by the Public Service Official Languages Exclusion Approval Order is tracked on an ongoing basis at a departmental level. The Department also encourages employees to acquire or improve second official language skills in order to advance their careers and possibly fill bilingual positions in the future as part of their personal development plans and in accordance with the revised Departmental Guidelines for the Learning of a Second Official Language, approved in 2009–2010.
The Department ensures that the workforce reflects the presence of both official languages communities in Canada.
Management Accountability Framework (MAF)In the Round VII (2009–2010) MAF Assessment, Environment Canada significantly improved its overall performance compared to the previous year, receiving two “strong”, fifteen “acceptable”, two “opportunity for improvement” and no “attention required” ratings. The Department has built upon this success and developed a renewed MAF Action Plan. Produced annually, the Action Plan is based on departmental priorities as well as those identified by the Treasury Board of Canada Secretariat, and outlines actions to maintain or improve management performance. Progress against the Action Plan will be monitored periodically to help ensure that management performance meets expectations in MAF Round VIII.
Indicators of Environmental SustainabilityEnvironment Canada, Statistics Canada and Health Canada are working together to further develop and communicate national environmental indicators of air quality, greenhouse gas emissions, freshwater quality and protected areas. These indicators are reported in the Canadian Environmental Sustainability Indicators (CESI).
While some trends are declining in the context of the subject areas in which they apply, determining the overall status of these areas based solely on current and limited indicators is inherently difficult. These indicators provide instead a proxy of overall status with respect to these areas, as can best be determined at this time. The indicators are, however, continually being refined and updated so that they better represent what they are intended to measure for use by both policy makers and the public.
In addition, CESI brings together environmental information from federal, provincial and territorial governments, which share responsibility for environmental management in Canada. Consequently, the trends and values of these indicators are not solely attributable to Environment Canada's actions, but indicative of the environmental results achieved collectively by various levels of government as per their responsibilities for the environment.
The table below provides an overview of CESI and other measurements for key indicators of environmental sustainability.
| Trend | Indicator | Overview |
|---|---|---|
| No trend | Air quality | Ground-level ozone and fine particulates (PM2.5), two key component of smog, can cause harm to human health, including lung and respiratory problems. Nationally, our exposure to ground-level ozone has increased by 11% between 1990 and 2008, with a 3% decrease from 2007 to 2008. No trend was identified for PM2.5 for the years 2000
to 2008 but we registered a 3% decrease from 2007 to 2008. Source: Environment Canada, Canadian Environmental Sustainability Indicators |
| No trend | Greenhouse gas emissions | Greenhouse gas emissions trap heat in the atmosphere and warm the planet, resulting in rising sea levels and more severe storms and heat waves. Canada's greenhouse gas emissions had grown rapidly from 1990 (592 megatonnes of carbon dioxide equivalent) to 2003 (741 megatonnes). The growth trend has slowed in recent years - emissions since 2003 have
decreased by 0.8%. GHG emissions from 2007 to 2008 (734 megatonnes) decreased 2.1%. Source: Environment Canada, Canadian Environmental Sustainability Indicators |
| No trend | Freshwater quality | The ability of Canada's lakes, rivers, and streams to support aquatic life is a way of measuring water quality and the impact of water pollution. Of the 86 representative sites monitored across Canada from 2005 to 2008, and at 81 representative sites between 2004 and 200745,
fresh water quality was rated as “excellent” at 6% of the sites. It was rated as “good” at 29%, “fair” at 46%, “marginal” at 16%, and “poor” at 3%. Source: Environment Canada, Canadian Environmental Sustainability Indicators |
| Improving performance | Protected Areas | Protected areas are lands or waters set aside to preserve habitats and natural landscapes and where human activity is limited. As of the end of December 2009, 9.72% (98,251,652.5 ha of Canada’s landmass) was under protection. There has been a 14% increase in the overall area protected since 2004 and roughly an 80% increase since 1990. Source: Environment Canada, Canadian Environmental Sustainability Indicators |
| Declining performance | Biodiversity | The Committee on the Status of Endangered Wildlife in Canada (COSEWIC) is a group of experts responsible for identifying and assessing wildlife species considered to be at risk in Canada. As of June 2010, the status of 259 of the 602 at-risk species has been
reassessed. Of those species, 35 (13%) have improved status and are either no longer at risk or are in a lower risk category, 67 species (26%) were placed in a higher risk category and 157 species (61%) did not change in status. Source: Committee on the Status of Endangered Wildlife in Canada |
[Footnotes]
1 Note that the Environment Canada’s PAA for 2010–2011 has been changed significantly from that used for 2009–2010.
2 Includes other federal departmental funding as well.
3 The Strategic Outcome "Sustainable urban development and infrastructure renewal in The Toronto Waterfront area" has been eliminated in 2009–2010 given the transfer of this function to Industry Canada. The 2008–2009 Actual Spending for that Strategic Outcome was $84.5M.
4 Internal Services are displayed separately from other program activities which is consistent with both the Program Activity Architecture and the 2009-2010 Report on Plans and Priorities. Please refer to page 5 for further information.
5 Internal Services are displayed separately from other program activities which is consistent with both the Program Activity Architecture and the 2009-2010 Report on Plans and Priorities. Please refer to page 5 for further information.
6 For further information, please see http://www.chemicalsubstanceschimiques.gc.ca/plan/index_e.html.
7 Internal Services are displayed separately from other program activities which is consistent with both the Program Activity Architecture and the 2009-2010 Report on Plans and Priorities. Please refer to page 5 for further information.
8 For further details on the transfer of the Mackenzie Gas Project Office to Environment Canada, please see page 6.
9 Please refer to Environment Canada’s 2009–2010 RPP: Section I - Contribution of Department’s Priorities to Strategic Outcomes.
10 Every five years, the Department will track and report on the percentage of Canadian ecosystems where ecosystem health has been assessed as good.
11 Canada’s 4th National Report to the United Nations Convention on Biological Diversity, p. 122.
12 Terrestrial area refers only to land area and excludes marine and freshwater protected areas.
13 Canada’s 4th National Report to the United Nations Convention on Biological Diversity, p. 122.
14 Of the 107 species that have been reassessed by COSEWIC since they were first added to Schedule 1, COSEWIC has reassessed 9 species as being at a lower risk category (4 downlisted, 5 eligible for downlisting), 13 species were reassessed at a higher risk category (10 have been uplisted, another 3 are eligible for uplisting); 84 species were reassessed at the same level, and 1 species was determined to be no longer at risk.
15 Page 24 of the 2009–2010 RPP includes the following detail: “The current goal is 3.44 million hectares, which is established in the 2004 Update to the North American Waterfowl Management Plan. This goal will be reviewed in 2010.”.
16 Hectares reported are the period hectares secured only. The areas do not include contributions of the Canadian Intermountain Joint Venture or the Western Boreal Forest Program Area, as these were not part of the 2004 NAWMP goal.
17 Draft thematic technical chapters of Canadian Biodiversity: Ecosystem Status and Trends 2010 have been completed and key findings developed, along with draft summary reports providing evidence for the key findings. Although slightly delayed, the full series of products, including a summary for decision-makers, will be released in 2010–2011 as a major deliverable for the 2010 International Year of Biodiversity.
18 Canada’s 4th National Report to the CBD was submitted to the Secretariat of the Convention on Biological Diversity (CBD) in 2009. A supplementary report, “Caring for Canada’s Biodiversity - Highlights of Canada’s Fourth National Report,” will be published in the 2010–2011 fiscal year.
19 In support of the 2010 Engagement Strategy, new or enhanced education and communication tools were developed and promoted on the Canadian Biodiversity Information Network web site.
20 Hectares reported are the period hectares secured only. The areas do not include contributions of the Canadian Intermountain Joint Venture or the Western Boreal Forest Program Area, as these were not part of the 2004 NAWMP goal.
21 Canada’s 4th National Report to the Convention on Biological Diversity, p. 122.
22 Water quality data was provided for the 2009 CESI Water Quality Indicator report and Environment Canada made progress on the development of a Water Demand and Availability indicator, which will improve our ability to report to Canadians on the availability of water resources in Canada and the effectiveness of management approaches.
23 Proposed legislation was introduced in Parliament in May 2010.
24 Each of Environment Canada’s priority ecosystem initiatives have set out near-term objectives related to reducing the impact of harmful substances and improving environmental quality.
25 The performance indicator was adjusted in September 2009 to reflect that only three Ecosystem Initiatives were implemented in 2009–2010 and not six.
26 Details on meaning of “100” can be found on page 30 of the 2009–2010 Reports on Plans and Priorities.
27 An approach that seeks to integrate science, regulatory and outreach activities to improve ecosystem health.
28 Partner sectors include: municipal, provincial or federal governments, private sector, industry associations, non-governmental organizations, academic institutions, charitable foundations, and individuals.
29 This recommendation and the Department's response appear in paragraph 2.36 on page 13 (pdf version) of the Report.
30 The term Cryosphere refers to frozen surfaces: ice, snow and permafrost.
31 Office of the Commissioner of Official Languages, Audit of the Bilingual Weather and Environmental Services Provided on the Environment Canada Automated Telephone Network, November 2008.
32 In January 2010, the Government of Canada revised its national target to reduce GHG emissions to 17 percent below 2005 levels by 2020, to align with the U.S. target, and has inscribed this target in the Copenhagen Accord.
33 Canadian Environmental Sustainability Indicators – Greenhouse Gas Emissions: http://www.ec.gc.ca/indicateurs-indicators/default.asp?lang=En&n=FBF8455E-1.
34 Canadian Environmental Sustainability Indicators – Air Quality: http://www.ec.gc.ca/indicateurs-indicators/default.asp?lang=En&n=4B5631F9-1.
35 Data for 2009–2010 data are not yet available.
36 Canada’s 2008 Greenhouse Gas Inventory: A Summary of Trends: 1990–2008: p. 1. http://www.ec.gc.ca/ges-ghg/0590640B-87F7-449A-AA8F-D5674A7BAC57/2010 Annual Summary of Trends.pdf.
37 Canadian Environmental Sustainability Indicators (CESI) 2008: http://www.ec.gc.ca/indicateurs-indicators/default.asp?lang=En&n=4B5631F9-1.
38 2009–2010 data is not yet available.
39 CESI 2008: http://www.ec.gc.ca/indicateurs-indicators/default.asp?lang=En&n=4B5631F9-1.
40 This is no longer the current target. The Government of Canada announced an economy-wide mid-term commitment to reduce GHG emissions by 17 percent, relative to 2005 levels, by 2020. http://www.climatechange.gc.ca/cdp-cop/default.asp?lang=En&n=C4BD2547-1#p3
41 Figures are 2007 levels.
42 Figures are 2007 levels.
43 http://www.tbs-sct.gc.ca/est-pre/20092010/me-bd/EC-eng.asp#bm01, or page 8-4 in the 2009–2010 Main Estimates document.
44 CEAP figures exclude contributions to Employee Benefits Plans (EBP).
45 Data for the period between 2004 and 2007 were used for stations where data was not available at the time of publication (Quebec, Manitoba, B.C., Alberta, Saskatchewan, PEI, and Yukon).