Common menu bar links
Breadcrumb Trail
ARCHIVED - Canadian Food Inspection Agency - Report
 This page has been archived.
Archived Content
Information identified as archived on the Web is for reference, research or recordkeeping purposes. It has not been altered or updated after the date of archiving. Web pages that are archived on the Web are not subject to the Government of Canada Web Standards. As per the Communications Policy of the Government of Canada, you can request alternate formats on the "Contact Us" page.
Section III – Supplementary Information
3.1 Financial Information
3.1.1 Financial Highlights
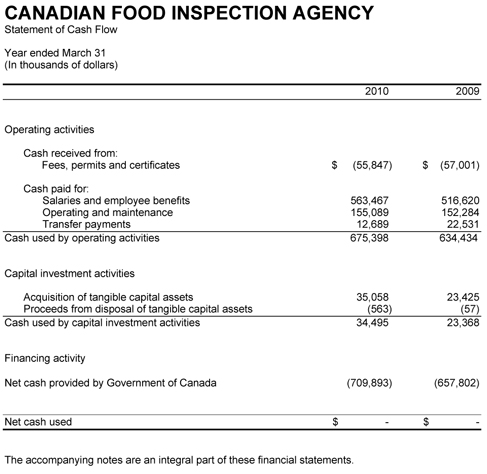
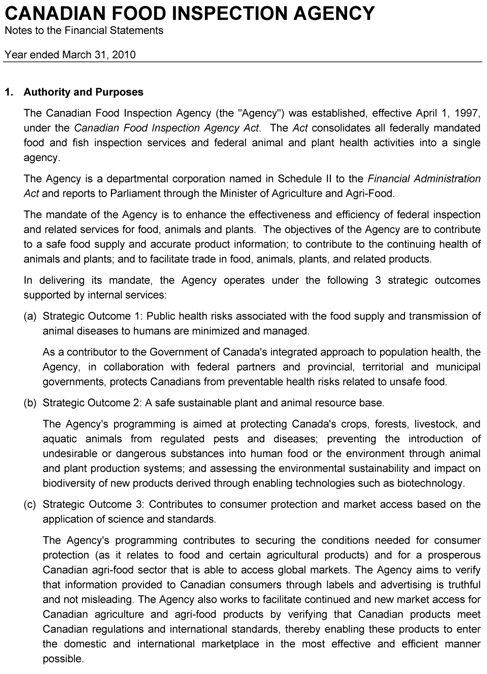
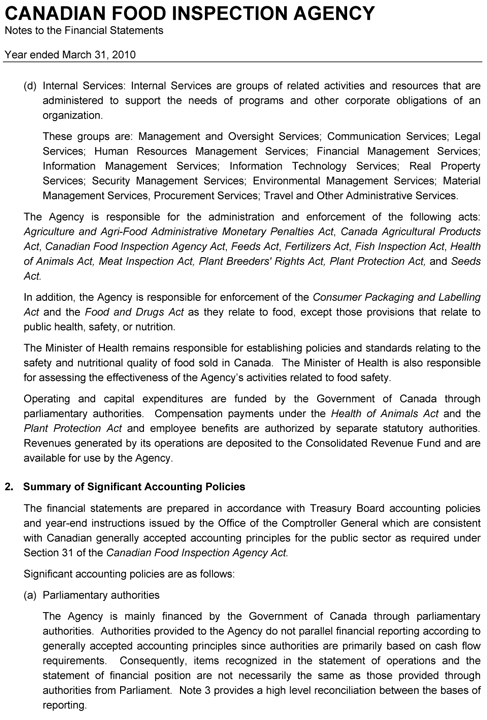
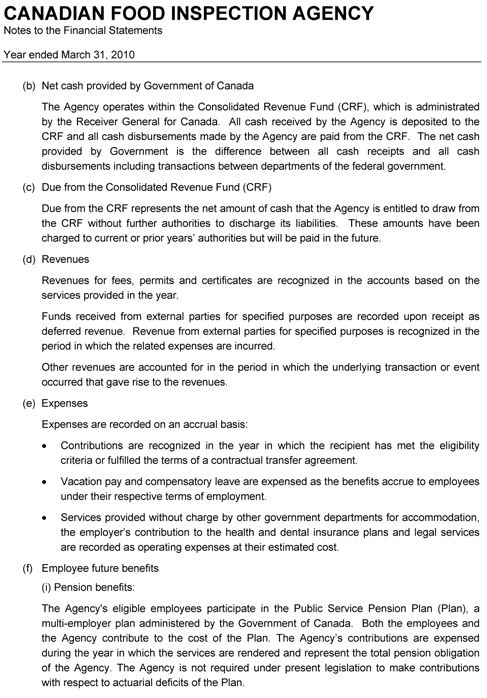
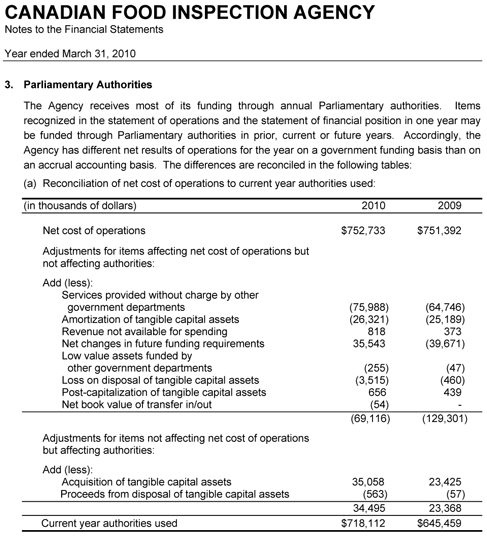
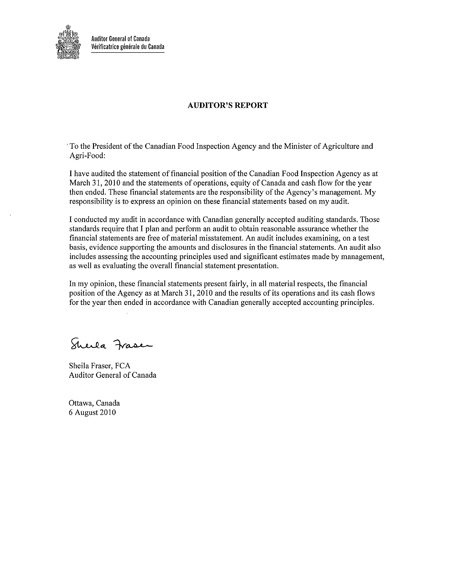
The financial highlights presented within the Agency's Performance Report are intended to serve as a general overview of the CFIA's financial position and operations. Financial statements are prepared in accordance with accrual accounting principles, Treasury Board accounting policies and year-end instructions issued by the Office of the Comptroller General which are consistent with Canadian generally accepted accounting principles for the public sector as required under Section 31 of the Canadian Food Inspection Agency Act. The Agency has been audited since its creation and has always received an unqualified opinion.
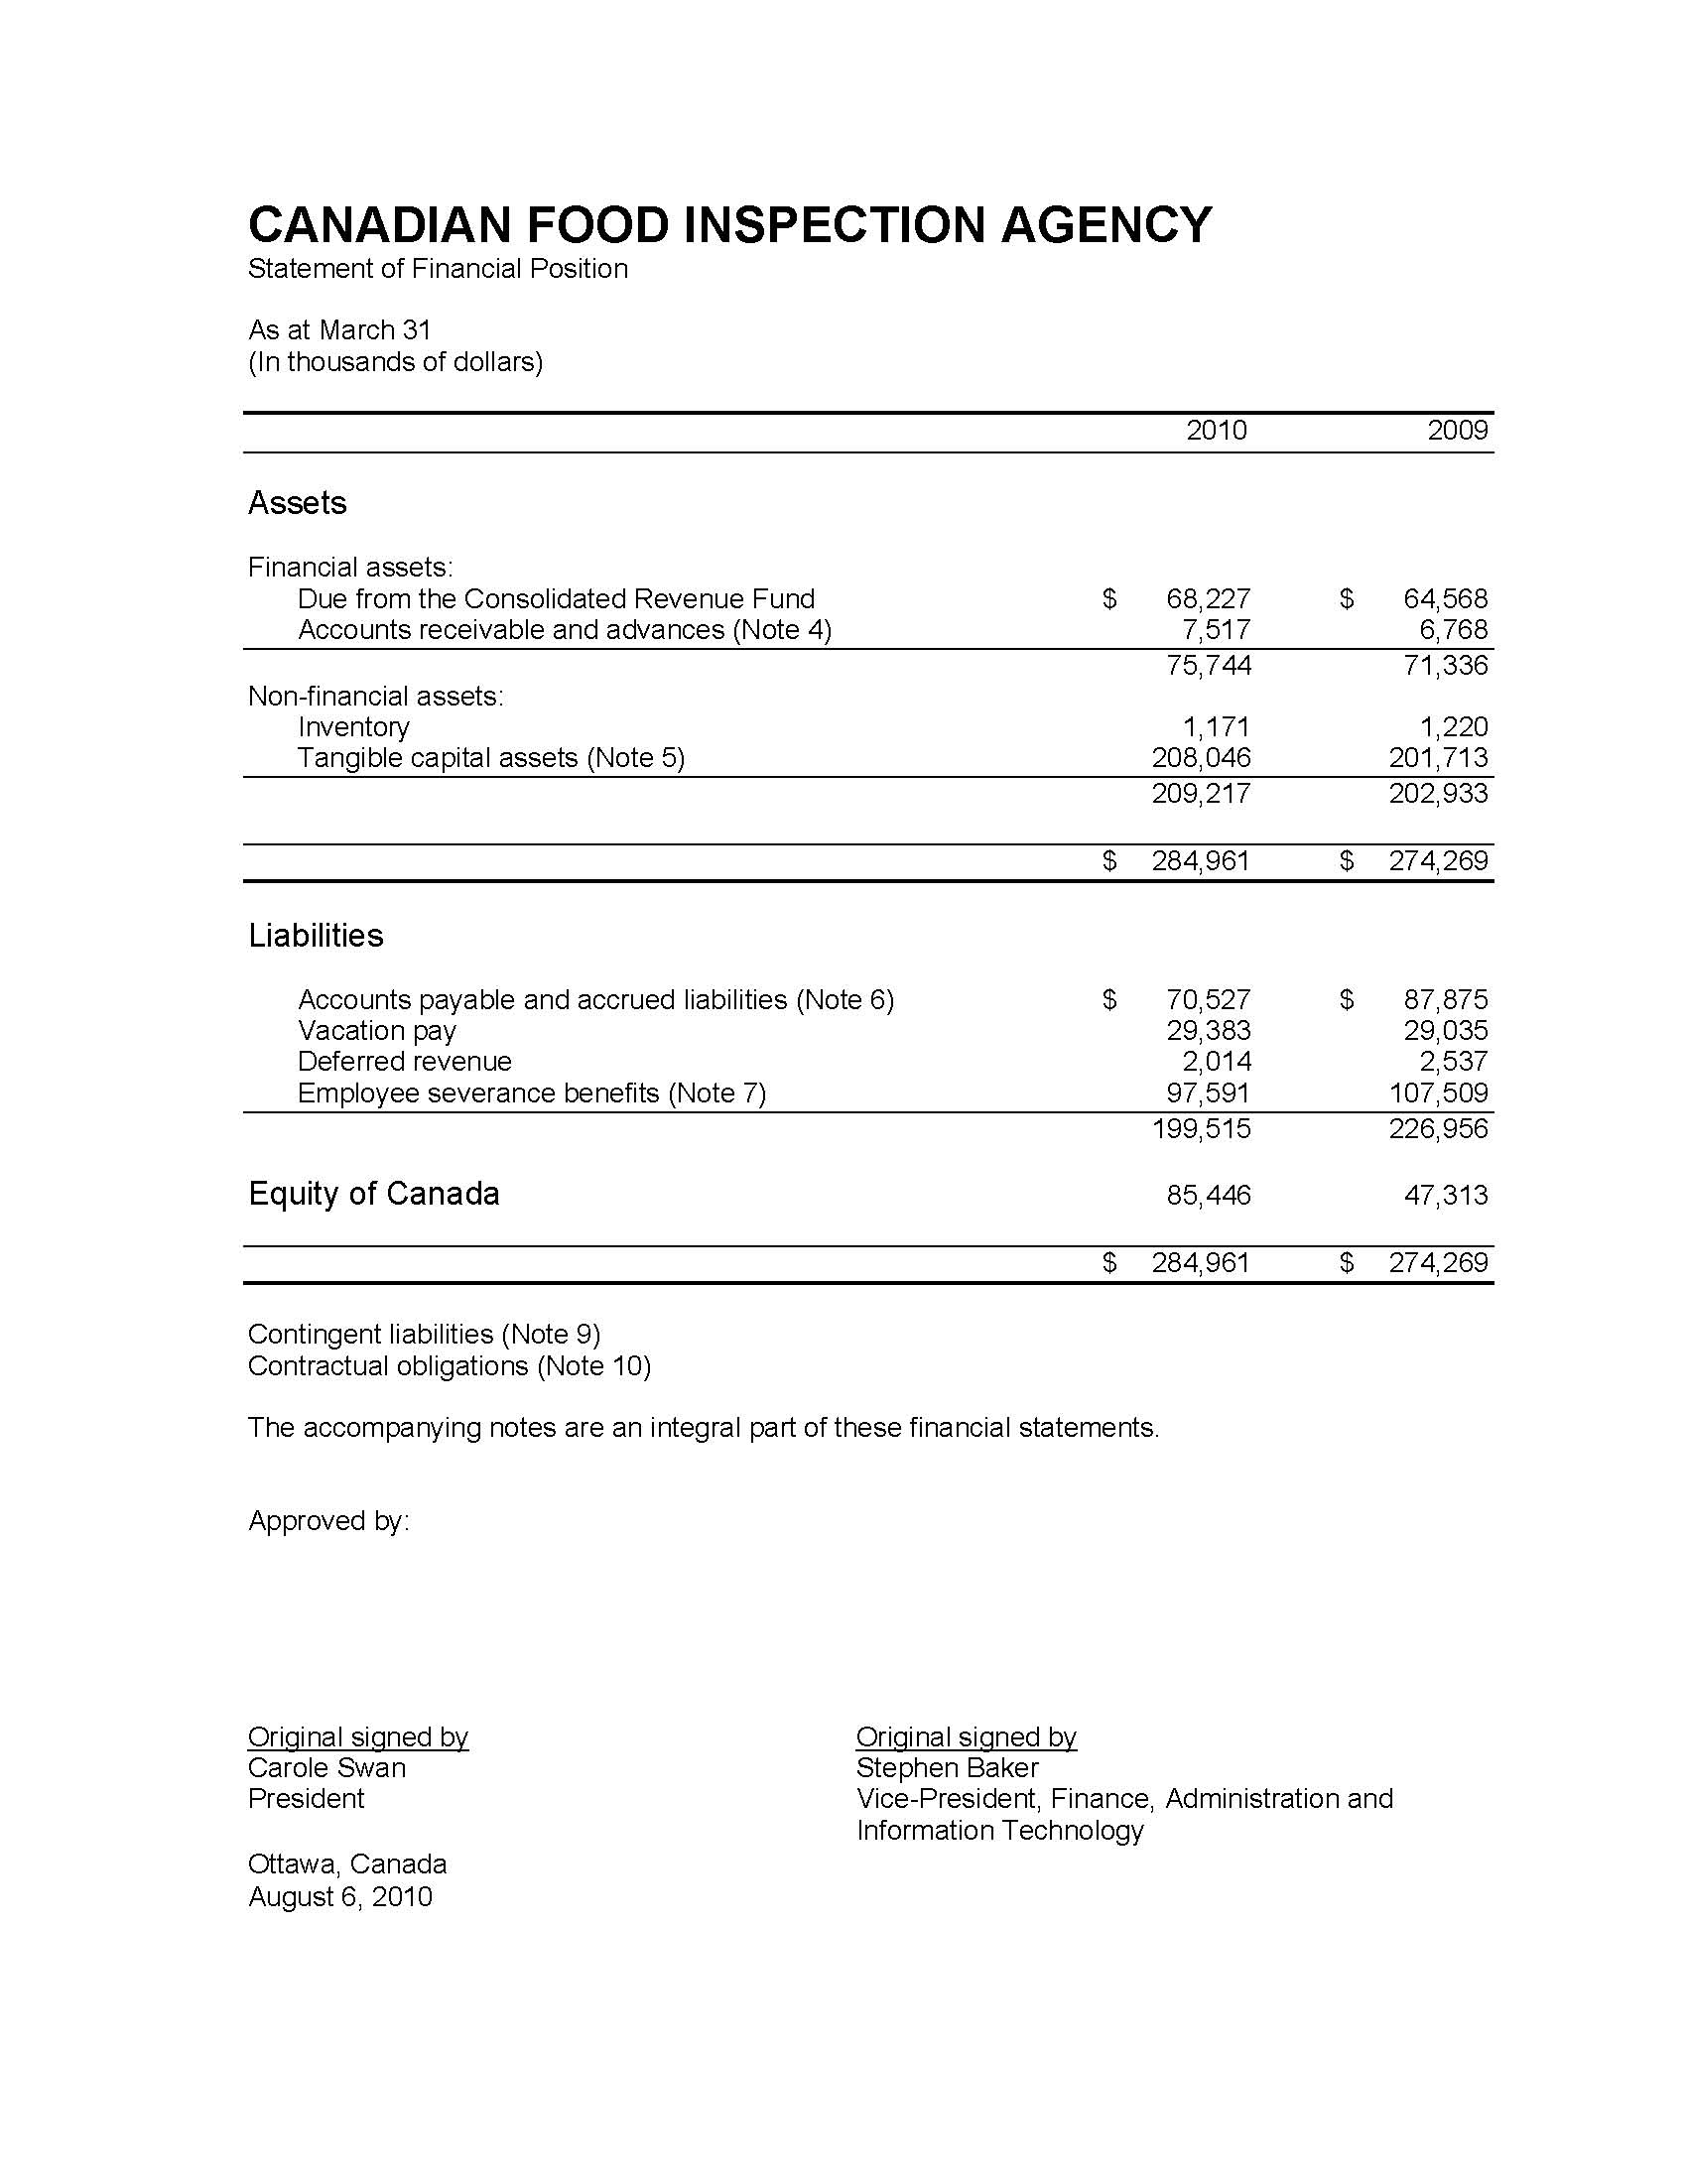
| Condensed Statement of Financial Position As at March 31 |
% Change | 2010 | 2009 |
|---|---|---|---|
| Assets | |||
| Total Assets | 3.90% | 284,961 | 274,269 |
| Total | 3.90% | 284,961 | 274,269 |
| Liabilities | |||
| Total Liabilities | (12.09%) | 199,515 | 226,956 |
| Equity | |||
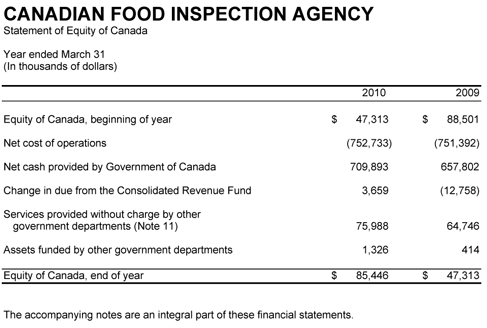
| Total Equity | 80.60% | 85,446 | 47,313 |
| Total | 3.90% | 284,961 | 274,269 |
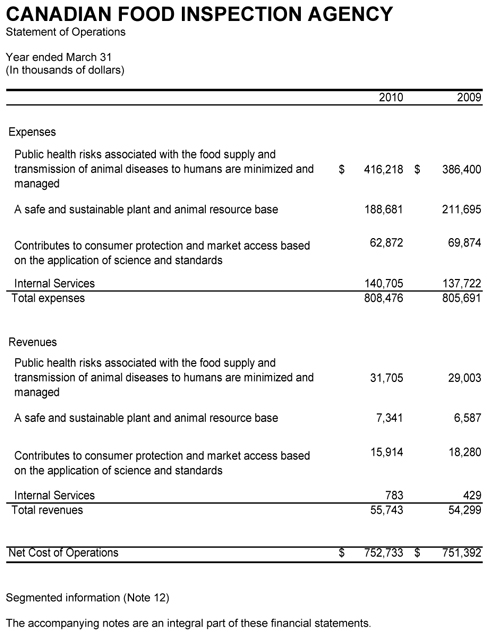
| Condensed Statement of Operations Year ended March 31 |
% Change | 2010 | 2009 |
|---|---|---|---|
| EXPENSES | |||
| Total Expenses | 0.35% | 808,476 | 805,691 |
| REVENUES | |||
| Total Revenues | 2.66% | 55,743 | 54,299 |
| Net Cost of Operations | 0.18% | 752,733 | 751,392 |
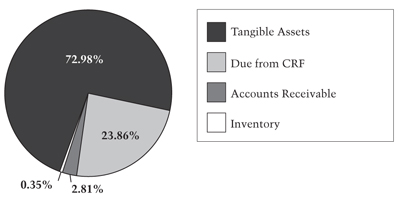
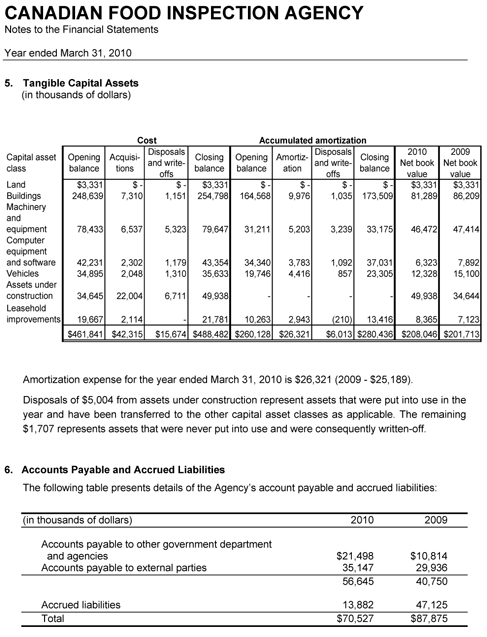
Total assets at the end of 2009–2010 were $285 million, an increase of $11 million (4%) over previous year's total assets of $274 million. The $11 million increase in total assets was caused by a $6 million increase in financial assets from major acquisitions that included the Burbaby laboratory consolidation ($4.4 million). The amount of Due from Consolidated Revenue Fund (CRF) also increased by 4 million from last year, which is in line with the increase in payables at year end. Tangible assets represented the largest portion of total assets, at $208 million (73%) of total assets, while Due from CRF represented 24% at $68 million. Accounts receivable only represented 3%, followed by inventory which represented less than 1% of total assets
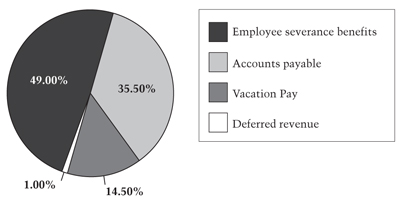
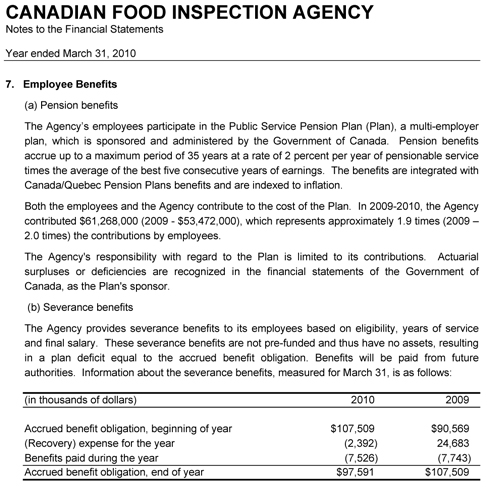
Total liabilities at the end of 2009–2010 were $200 million, a decrease of $27 million (12%) over the previous year's total liabilities of $227 million. The $27 million decrease is explained by the removal of the allowance for expired collective agreements of $14 million, the removal of the allowance for contingent liability of $9 millions, a reduction of $10 million in employee severance benefits in 2010 due to the reduction in the Treasury Board employee base rate, and offset by an increase of 6 millions in accounts payables at year end. Employee severance benefits represented 49% of total liabilities, at $98 million, followed by the accounts payable which represented 36% of total liabilities, at $71 million. Vacation pay represented $29 million (15%), while deferred revenue only represented 1% of total liabilities
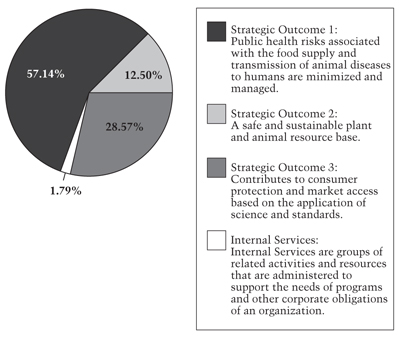
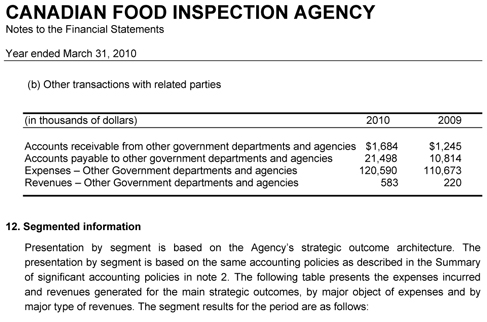
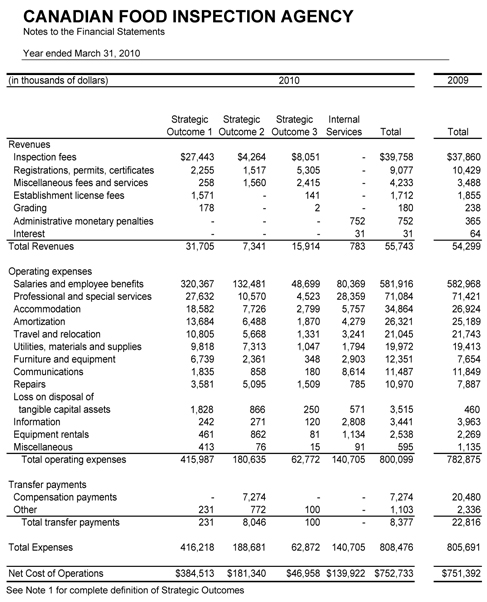
The Agency's total revenues amounted to $56 million for 2009–2010. Revenues for 2009–2010 remained fairly constant with the revenues earned in 2008-2009 with a slight increase of $2 million (3%) from the previous year. More than half of the revenue was derived from the Strategic Outcome 1. Strategic Outcome 3 represented 29% of all revenues ($16 million), where 13% ($7 million) were derived from Strategic Outcome 2. Less than 2% of all revenues were from Internal Services.
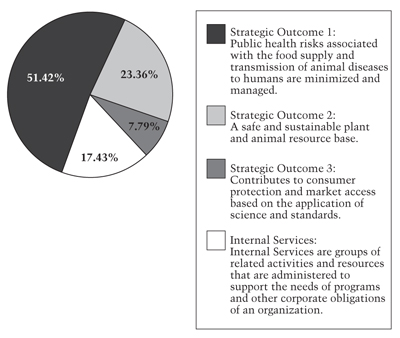
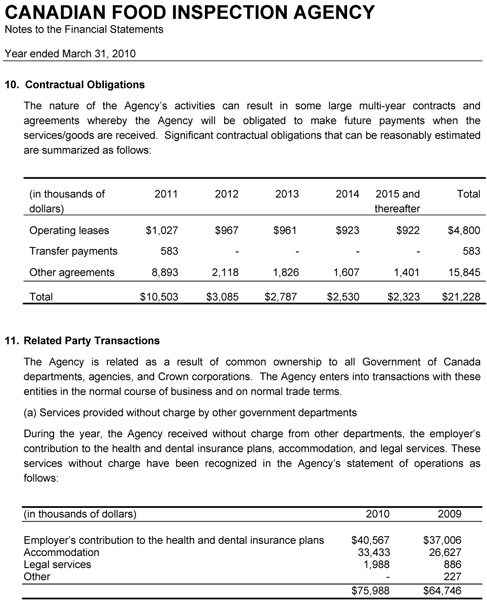
The total expenses for CFIA were $808 million in 2009–2010, a small increase of $3 million (less than 1%) compare to last year. Note that CFIA increase in budgetary expenses for 2010 was for the most part offset by reductions in accrual expenses. The majority of the expenses, $416 million (51%), were under Strategic Outcome 1. Strategic Outcome 2 represented $189 million (24%) of total expenses, while Internal Services expenses represented $141 million (17%) of total expenses. Approximately 8% of all expenses were derived from Strategic Outcome 3.
3.1.2 Auditor General's Audit Opinion on Financial Statements and Audited Financial Statements
3.2 List of Supplementary Information Tables
- Sources of Respendable and Non-Respendable Revenue
- Sources of Respendable Revenue
- Sources of Non-Respendable Revenue
- 2009-10 User Fee Reporting - User Fees Act
- Table A: User Fee
- Table B: External Fee
- Status Report on Projects operating with specific Treasury Board Approval
- Details on Transfer Payment Programs (TPPs)
- Horizontal Initiatives
- Table A: Bovine Spongiform Encephalopathy
- Table B: National Aquatic Animal Health Program
- Table C: Listeria
- Green Procurement
- Response to Parliamentary Committees and External Audits
- Internal Audits and Evaluations
- Table A: Audits
- Table B: Evaluations
All electronic supplementary information tables listed in the 2009-10 Departmental Performance Report can be found on the Treasury Board of Canada Secretariat's website at
http://www .tbs-sct.gc.ca/dpr-rmr/st-ts-eng.asp
3.3 Other Items of Interest
- 3.3.1 Summary of Performance Indicators
- 3.3.2 Performance Indicators by Operational Priority
- 3.3.3 Further Information on the Assessment of Compliance
1 This number also includes active, leave without pay, paid leave, and suspended employees.
2 Strategic outcome: Long-term and enduring benefit to Canadians that stems from the Agency's vision and mission. It represents the difference the Agency intends to make for Canadians.
3 Full-Time Equivalent (FTE): A measure of human resource consumption. It calculates the number of assigned hours of work over the total hours of regularly scheduled work (37.5 hours per week over 12 months). For example, an employee who works half-time (18.75 hours per week) over a 12-month period is equivalent to a 0.5 FTE.
4 This includes active, on leave without pay, on paid leave, and suspended employees.
5 For detailed performance information on CFIA, CEAP Projects, please refer to Section 2.2.4 Internal Services.
6 The performance summaries in Tables 1-1, 1-2 and 1-3 represent performance at the Program Activity levels.
7 For more information on Government of Canada outcome areas, please refer to www.tbs-sct.gc.ca/ppg-cpr/framework-cadre-eng.aspx?Rt=1039
8 Zoonotic diseases are diseases transmissible from animals to humans.
9 Risk areas have been derived from the CFIA's Corporate Risk Profile (CRP). For more information on the CRP and its risk areas, please refer to Section 1.5.
10 In 2009–10 the Fish and Seafood sub-indicator calculation was changed to harmonize with other sub-indicators by calculating compliance by the number of establishments versus the number of inspections.
11 Monitoring approach: Establishments are inspected, sampled and tested in such a way that the resulting compliance rates are representative of the CFIA-regulated population. Monitoring programs provide an adequate overview of industry compliance in general.
12 In 2009–10 the Fish and Seafood sub-indicator calculation was changed to harmonize with other sub-indicators by adding import inspection data to the compliance calculation. Reports also include data that is processed manually or using stand alone tools.
13 Monitoring approach: products are inspected, sampled and tested in such a way that the resulting compliance rates are representative of the CFIA-regulated population. Monitoring programs provide an adequate overview of compliance in the industry in general.
14 Targeted approach: In cases where monitoring has identified specific compliance problems, the CFIA takes a targeted approach to inspections, sampling and testing by focusing on the problem area and areas of highest risk. Non-compliant establishments or products are often sought out for the targeted approach to better define problem areas and reasons for non-compliance. For this reason, compliance rates of targeted programs are typically lower. Improved compliance is promoted through enforcement actions.
15 Investigative approach: Compliance is assessed for the purposes of prosecution for non-compliance. Investigations involve gathering evidence and information from a variety of sources considered relevant to a suspected violation or offence.
16 Wording of this indicator changed in 2009–10 to reflect that the indicator only measures non–federally registered food products.
17 For more information visit: http://www.inspection.gc.ca/english/fssa/proge.shtml
18 The expected result was changed from “Risks of the transmission of federally controlled zoonotic diseases to humans are successfully managed” to simplify the wording and clarify the desired outcome.
19 In the 2009–10 RPP, the indicator was changed to “Number of Canadians who become infected with federally controlled zoonotic diseases by direct contact with animals or their products.” Because this falls outside the CFIA's jurisdiction, the Agency reverted back to the wording used for the 2008–09 DPR—“Number of incidents of avian influenza that expand beyond the initial control zone” .
20 This indicator reflects only foreign animal diseases. The CFIA also conducts a wide variety of activities with regard to animal diseases already established in Canada. Performance measures to illustrate performance in this regard will be developed and reported on in future years.
21 Major deviations with respect to the enhanced feed ban could include evidence of cross-contamination of ruminant feed with prohibited material, the unavailability of written procedures and required records, and labeling violations. Major deviations with respect to the Feeds Regulations could include evidence of cross-contamination with medications, the unavailability of required records and labeling violations.
22 The indicator has been revised from the 2009–2010 RPP to clarify that the CFIA investigates new plant diseases and pests, not just new foreign regulated plant diseases and pests.
23 CFIA's detailed action plan can be found at: www2.parl.gc.ca/Content/HOC/Committee/402/PACP/WebDoc/WD4020496/Action_Plans/06-Canadian%20Food%20Inspection%20Agency-e.htm
24 Report on the internal evaluation of Invasive Alien Species can be found at: www.inspection.gc.ca/english/agen/eval/invenv/invenve.shtml
25 GoC Response to SCAAF Report at Parliamentary can be found at: www2.parl.gc.ca/HousePublications/Publication.aspx?DocId=4096914&Language=E&Mode=1&Parl=40&Ses=2
26 USA–CANADA Guideline announcement can be found at: www.inspection.gc.ca/english/corpaffr/newcom/2009/20090604be.shtml
27 Tomato leafminer moth can be found at: www.inspection.gc.ca/english/plaveg/pestrava/tutabs/20100226inde.shtml
www.inspection.gc.ca/english/plaveg/pestrava/tutabs/tutabse.shtml
28 False codling moth can be found at: www.inspection.gc.ca/english/plaveg/hort/20091023inde.shtml www.inspection.gc.ca/english/plaveg/protect/dir/peptoe.shtml
29 The performance indicator measuring the CFIA's management of invasive species and other pests is listed under the Plant Health Risks and Production Systems program activity.
30 The expected result “Potential new invasive plants and plant pests have been identified and their entry by known pathways is regulated” was removed because the same performance measurement is captured under the Plant Health Risk and Production Systems.
31 The performance indicators for this program activity were set in the 2009–10 RPP, but no targets were specified. The targets for the Plants with Novel Traits and Novel Fertilizer sub-indicators have been brought forward from the 2008–09 Performance Report.
32 The wording of this indicator changed from the 2009–10 RPP from the following: Extent to which authorized novel products, having undergone an environmental assessment, comply with CFIA requirements and standards outlined in the authorization. This indicator now measures compliance-by-inspection versus compliance-by-products to provide a common measure of performance across plant, feed, fertilizer and veterinary biologics areas.
33 As performance indicators for this program activity were not set in the 2009–10 RPP, there were also no targets specified. The targets for the Plants with Novel Traits and Novel Fertilizer sub-indicators have been brought forward from the 2008–2009 Performance Report.
34 The wording of this indicator changed from the 2009–10 RPP from the following: The proportion of regulatory initiatives that are prepublished in the Canada Gazette, Part I, prior to publication in the Canada Gazette, Part II. The methodology was also changed in 2009–10 to support the new wording of this indicator.
35 The wording of this indicator changed from the 2009–10 RPP from the following: “Extent to which the net quantity, composition, labeling and advertising of food products inspected is accurate” to specify that it applies to only non-registered food products.
36 This is the first year Internal Services is formally reported as a distinct Program Activity, as such performance indicators have not yet been developed. To ensure uniformity, performance measures to be used across the GoC will be provided by TBS.
37 Internal Services was displayed separately from other program activities for the first time in 2009–10, affecting the comparability of spending and FTE information by program activity.
38 For more details on CFIA's projects in Canada Economic Action Plan please see http://actionplan.gc.ca/eng/index.asp
39 The Authorities and Actual Spending figures of the CEAP are inclusive of Employee Benefit Plans (EBP).

