Common menu bar links
Breadcrumb Trail
ARCHIVED - Statistics Canada
 This page has been archived.
Archived Content
Information identified as archived on the Web is for reference, research or recordkeeping purposes. It has not been altered or updated after the date of archiving. Web pages that are archived on the Web are not subject to the Government of Canada Web Standards. As per the Communications Policy of the Government of Canada, you can request alternate formats on the "Contact Us" page.
Section III Supplementary Information
3.1 Financial Highlights
The financial highlights presented within this DPR are intended to serve as a general overview of Statistics Canada’s financial position and operations. Financial statements can be found at http://www.statcan.gc.ca/dpr-rmr/financ-eng.htm.
Table 26 Financial Highlights
| Condensed Statement of Financial Position For the year (ended March 31, 2008) |
% change | 2009 | 2008 |
|---|---|---|---|
| Assets | |||
| Total assets | 21.8 | 145,703 | 119,590 |
| Total | 21.8 | 145,703 | 119,590 |
| Liabilities | |||
| Total liabilities | 25.5 | 197,226 | 157,124 |
| Equity | |||
| Total equity | (37.3) | (51,523) | (37,534) |
| Total | 21.8 | 145,703 | 119,590 |
| Condensed Statement of Operations For the year (ended March 31, 2009) |
% change | 2009 | 2008 |
|---|---|---|---|
| Expenses | |||
| Total expenses | 8.6 | 670,680 | 617,437 |
| Revenues | |||
| Total revenues | 12.5 | 121,295 | 107,792 |
| Net cost of operations | 7.8 | 549,385 | 509,645 |
Notes:
The departmental financial statements and associated highlights have been prepared on an accrual accounting basis and, therefore,
differ from the figures presented in previous sections, which are based on authorities voted by Parliament on a modified
cash basis. Note 3 of the financial statements provides a reconciliation of accrual-to-cash accounting methods.
Totals may differ within and between tables because of rounding.
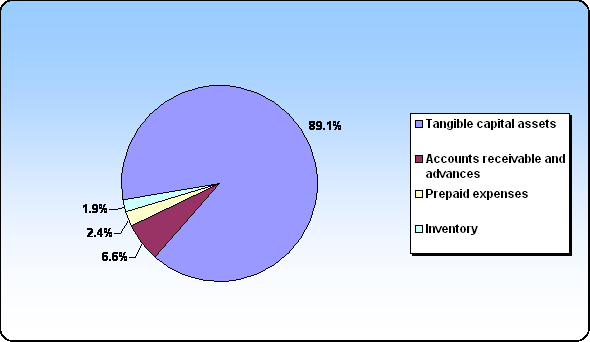
Figure 6 Assets by Type

Total assets were $146 million at the end of 2008/2009, an increase of $26 million (21.8%) over the previous year’s total of $120 million. Tangible capital assets, composed mainly of informatics hardware ($24 million), software ($54 million) and software under development ($39 million), represent the largest portion of assets at $130 million or 89.1% of the total. The remaining 10.9% is composed of accounts receivable and advances (6.6%), prepaid expenses (2.4%) and inventory (1.9%).
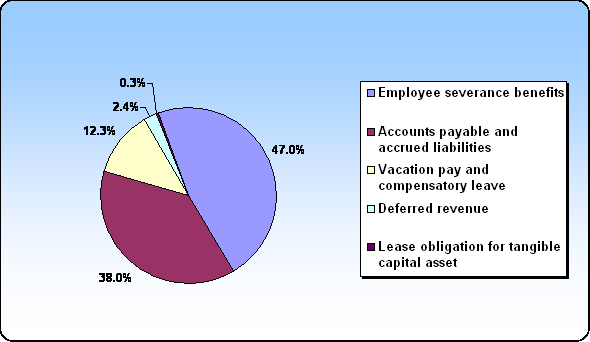
Figure 7 Liabilities by Type

Total liabilities were $197 million at the end of 2008/2009, an increase of $40 million (25.5%) over the previous year’s total of $157 million. Employee severance benefits represents the largest portion of the liabilities at $93 million or 47.0% of the total. Accounts payable and accrued liabilities is the next largest portion at $75 million or 38.0% of the total, and is composed of accrued salaries and wages ($38 million), accounts payable to external parties ($26 million), and accounts payable to other federal government departments and agencies ($11 million).
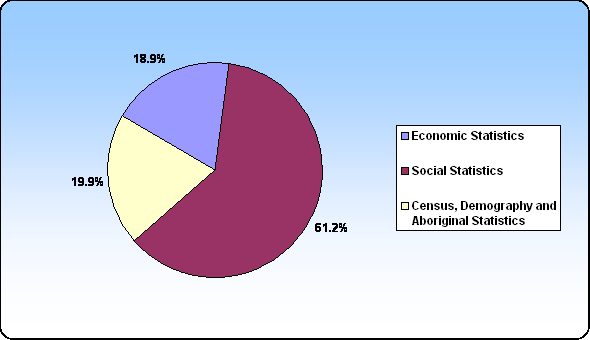
Figure 8 Revenues—Where Funds Come From

Statistics Canada’s total revenues amounted to $121 million for 2008/2009, an increase of $13 million (12.5%) from the previous year’s revenue of $108 million. The Social Statistics Program generated $74 million (61.2%) of the total, while the Census, Demography and Aboriginal Statistics Program and Economic Statistics Program generated $24 million (19.9%) and $23 million (18.9%), respectively.
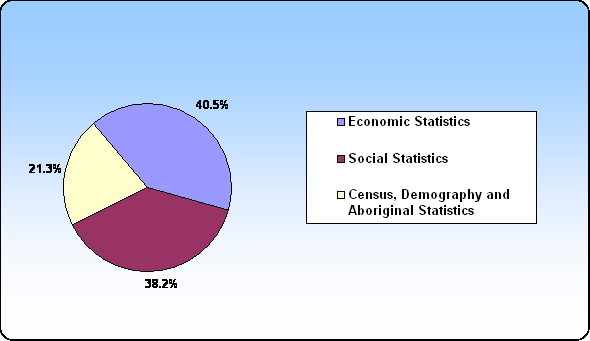
Figure 9 Expenses—Where Funds Go

Total expenses, which include respendable revenues and services received without charge, were $671 million in 2008/2009, an increase of $54 million (8.6%) from the previous year’s expenses of $617 million. The Economic Statistics Program accounts for the largest portion of this at $272 million (40.5%), while the Social Statistics Program and the Census, Demography and Aboriginal Statistics Program accounted for $256 million (38.2%) and $143 million (21.3%), respectively.
3.2 List of Supplementary Information Tables
All electronic supplementary information tables found in the 2008/2009 Departmental Performance Report can be found on the Treasury Board of Canada Secretariat’s website at: http://www.tbs-sct.gc.ca/dpr-rmr/st-ts-eng.asp.
- Sources of Respendable and Non-respendable Revenue
- User Fees / External Fees
- Green Procurement
- Response to Parliamentary Committees and External Audits
- Office of the Auditor General
The Auditor General tabled a report on November 5, 2008, on managing identity information. Statistics Canada was involved in this audit in its role as the lead federal department responsible for the National Routing System. Statistics Canada collects vital events data under this project for health and demographic analysis, not for identity purposes. There is no specific recommendation related to Statistics Canada in its role in the National Routing System.
Report of the Auditor General of Canada to the House of Commons: Managing Identity Information (2009)
- Public Service Commission
Statistics Canada was included in the government-wide audit of executive (EX) appointments carried out by the Public Service Commission. Although given no specific recommendations, Statistics Canada has used the auditors’ observations to ensure that in future the documentation for our selection processes reflects our commitment to fair, inclusive and meritorious staffing activity.
“Government-wide audit of executive (EX) appointments: A report by the Public Service Commission of Canada” (October 2008)
- Office of the Auditor General
- Internal Audits and Evaluations
- Internal audits
Internal Audit Services worked on four internal audit engagements that were part of the 2008/2009 to 2010/2011 multiyear risk-based audit plan. These four audits are expected to be completed and presented to the Departmental Audit Committee (DAC) before the end of 2009/2010. The DAC at Statistics Canada was in place in March 2009 and held its first meeting in June 2009. One item on the agenda was the report of the internal audit on Asset Protection and Life Cycle Management. In 2009/2010, the DAC will meet in June, September, December and March. The completion dates for these audit engagements are presented in the following table. The key objectives of each audit engagement are to ensure that control frameworks and controls are adequate and effective.
Internal audits (as of 2008/2009)
- Evaluations
Statistics Canada has a unique system of ongoing evaluations of all its statistical and corporate services programs. Each group at Statistics Canada prepares a thorough quadrennial program review that identifies accomplishments, challenges and future priorities along with users’ satisfaction of services provided. A biennial program report updates the quadrennial program reviews at midcycle.
- Statistics Canada’s Schedule of Quadrennial Program Reviews (QPRs) and Biennial Program Reports (BPRs) in 2008/2009
- Internal audits
