
Common menu bar links
Breadcrumb Trail
ARCHIVED - National Energy Board
 This page has been archived.
Archived Content
Information identified as archived on the Web is for reference, research or recordkeeping purposes. It has not been altered or updated after the date of archiving. Web pages that are archived on the Web are not subject to the Government of Canada Web Standards. As per the Communications Policy of the Government of Canada, you can request alternate formats on the "Contact Us" page.
Section II: Analysis of Program Activity
2.1 Strategic Outcome
| Safety, security, environmental protection and economic benefits through regulation of pipelines, power lines, trade and energy development within NEB jurisdiction. |
2.2 Program Activity: Energy Regulation and Advice
The NEB’s main business is energy regulation and the provision of energy market information. The companies that are regulated by the Board create wealth for Canadians through the transport of oil, natural gas and natural gas liquids and through the export of hydrocarbons and electricity. As a regulatory agency, the Board’s role is to help create a framework that allows these economic activities to occur when they are in the public interest.
Financial Resources: ($ millions)
|
Planned Spending |
Total Authorities |
Actual Spending |
|
37.9 |
43.4 |
44.5 |
|
Planned |
Actual |
Difference |
|
305.1 |
305.26 |
+0.15 |
2.3 Analysis by Program Activity
In support of its strategic outcome, the NEB has developed five strategic goals. In this section, the outcomes and performance results from planned actions, as described in the 2006-2007 Report on Plans and Priorities (RPP), are discussed.
2.3.1 Goal 1
|
NEB-regulated facilities and activities are safe and secure, and are perceived to be so. |
The NEB ensures that NEB-regulated facilities operates in a manner that protects employee, contractor, and public safety. The NEB’s mandate now also includes oversight for the security of pipelines and international power lines, reflecting amendments made to the NEB Act that came into effect in April 2005. The NEB’s commitment to safety and security encompasses the full lifecycle of energy projects within its jurisdiction.
The safety and security risks associated with facilities and activities regulated by the NEB are managed through competent design, construction, operation and maintenance practices. The NEB plays a significant role in safety and security by ensuring a regulatory framework is in place that encourages companies to maintain or improve their safety and security performance. The Board ensures that companies identify and manage the safety and security risks associated throughout the lifecycle of regulated facilities, by:
- developing goal-oriented regulations and guidelines;
- assessing facility applications from an engineering and safety perspective;
- ensuring that appropriate mitigation measures and approval conditions are in place before granting project approval;
- reviewing construction progress reports, inspecting facilities, conducting compliance meetings, and auditing management systems to confirm regulatory requirements are met and continue to be met;
- assessing safety practices and procedures under the NEB mandate as well as through the Canada Labour Code (CLC) through a Memorandum of Understanding (MOU) between Human Resources and Social Development Canada and the Board;
- investigating incidents with the intent of preventing future similar occurrences;
- responding to emergencies to monitor and contribute to the effectiveness of company responses;
- issuing safety advisories; and
- conducting inquiries or formal investigations into safety and security issues.
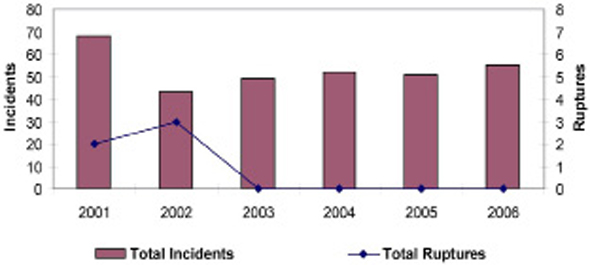
The combined efforts of the NEB, industry and other stakeholders, within this regulatory framework, have resulted in heightened safety awareness, no operating hydrocarbon pipeline ruptures since 2002 and no pipeline-related fatalities since 1997.
Performance Measures and Results
For Goal 1, the NEB has four key performance measures to ensure that NEB-regulated facilities are safe and secure. They are:
- Number of fatalities per year.
- Number of pipeline ruptures and incidents per year.
- Public perception of pipeline safety.
- Number and significance of security infractions.
In 2006, the number of incidents reported under the NEB Act pursuant to section 52 of the Onshore Pipeline Regulations, 1999 (OPR-99) and section 46 of the Processing Plant Regulations remained within the same range as the previous years (Figure 1 shows incidents by calendar year). No hydrocarbon pipeline ruptures occurred during 2006. The last rupture on an NEB-regulated hydrocarbon pipeline occurred in 2002.
Figure 1: Pipeline Ruptures and Incidents, 2001-2006
One fatality occurred during the construction of an NEB-regulated international power line in New Brunswick in December 2006. An experienced contractor from Nova Scotia was killed when a section of the crane he was dismantling fell on him. The Board reviewed the incident and issued a safety advisory in April 2007. The Board has received the final report from the New Brunswick Health, Safety and Compensation Commission. The NEB and regulated companies maintain a strong focus on improving contractor safety, which continues to occur at a higher frequency than company employee injuries.
The NEB has a target of zero ruptures on the pipelines it regulates. In 2006, there were no operating hydrocarbon pipeline ruptures; however, there was a sulphur commodity pipeline failure in July 2006. A gas plant experienced an electrical failure due to lightning which caused a complete shutdown of the facility including the sulphur commodity pipeline heating elements. This caused the sulphur in the pipeline to solidify which effectively removed the pipeline from operation. Once electrical power was restored, the company attempted to re-melt the sulphur and put the pipeline back into operation. During this process, the pipeline failed from overpressure.
In 2006-2007, total hazardous occurrences in Frontier areas, as defined under section 16.4 of the Oil and Gas Occupational Safety and Health Regulations under the CLC Part II, increased from 24 in 2005-2006 to 29 in 2006-2007 (Table 2). This was attributed to an increase in reportable spills which rose in the fourth fiscal quarter. There were no disabling injuries in 2006-2007 which represents a decrease from four in fiscal 2005-2006. This translates into a decrease in frequency from two disabling injuries per million hours worked in 2005-2006 to zero in 2006-2007. For activity covered under the COGO Act and the CLC, and related regulations, no fatalities occurred during 2006-2007.
Table 2: Safety Performance Indicators for Companies Regulated under COGO Act
|
Indicators |
2005-2006 |
2006-2007 |
|
COGO Act Worker disabling injury rate |
2 |
0 |
|
COGO Act Hazardous Occurrences |
24 |
29 |
|
Fatalities |
0 |
0 |
Public perception of pipeline safety
One of the key findings of the NEB’s March 2007 Focus on Safety and the Environment 2000-2005 report was that the low number of ruptures in recent years is primarily attributed to the introduction of Integrity Management Programs (IMPs) within the pipeline industry. The NEB was the first regulator in North America to mandate that pipeline companies must have IMPs, with the promulgation of the OPR-99. The OPR-99 reflects the Board’s goal-oriented approach to regulation by directing companies to have IMPs and by allowing them the freedom to tailor the content of the IMPs to their particular circumstances.
Number and significance of security infractions
Regulated companies voluntarily report security infractions to the NEB. NEB-regulated facilities did not report any major or minor security infractions in 2006-2007.
A number of initiatives have been undertaken to further the NEB security program. In fiscal 2005-2006 a Memorandum of Understanding was signed between the NEB and the Alberta Energy and Utilities Board (AEUB) for cooperation in security assessments. Through cooperation the following milestones have been achieved during 2006-2007:
- A security assessment protocol was developed and implemented;
- A security education presentation to industry was developed and presented;
- Six scheduled AEUB-NEB joint security assessments were completed; and
- Three NEB staff attended the assessments for development and training purposes.
This year, the Board developed a document entitled Regulation of Security Management at the NEB which formalized and documented the approach that the NEB will use to regulate security of energy infrastructure under its jurisdiction.
NEB staff participated in Exercise NARWHAL 07 which was a joint military, RCMP, Public Safety Canada, Northwest Territories Emergency Measures Organization, NEB exercise that simulated a threat against oil and gas facilities in the Norman Wells area.
Program and Results on Objectives of 2006-2007
The NEB identified objectives for Goal 1 and Goal 2 in its 2006-2007 RPP. The objectives for Goal 1, which focuses on safety and security, apply to Goal 2, which focuses on the environment. The results achieved for Goals 1 and 2 under these objectives are discussed below.
1. The NEB has a fully operational integrated compliance system enabling effective risk-based decision-making related to safety, security and environmental protection.
The NEB’s integrated compliance system supports a lifecycle regulatory approach through the integration of its application, audit and inspection processes while optimizing resources. In 2006-2007, the integrated compliance initiative saw the use of an improved prioritization tool for conducting NEB inspection and audit programs. Numerous data quality improvements were achieved and an interim data management strategy was successfully implemented. Using risk-based tools, inspections and audits were focused on facilities and companies identified using a prototype prioritization model, resulting in a unified Compliance Verification Strategy.
One of the Board’s major actions in 2006-2007 was to execute action plans to address compliance issues with emergency management, security management, and unauthorized right of way activities. These action plans are being implemented through the NEB’s Compliance Verification Strategy. In addition, the Board moved toward gazetting of the Damage Prevention Regulations with the expectation that the regulations will be promulgated in 2007-2008. This will enhance the NEB’s pipeline damage prevention program.
2. The NEB, in partnership with federal and provincial/territorial agencies, has in place harmonized environmental assessment processes.
Over the past year, the NEB has continued its efforts to develop tools and resources to optimize the effectiveness and efficiency with which it carries out its Goal 2 mandate through the various stages of the regulatory lifecycle. One key area of accomplishment was achieving coordination in environmental assessment processes with federal and provincial/territorial agencies. Coordination has been successful on a project-specific basis over the past year, and it is now being applied routinely to large facilities applications coming before the Board. Working with other regulatory agencies and government departments to develop environmental assessment coordination agreements resulted in minimizing duplication and streamlined environmental assessment reports.
A successful pilot regarding environmental assessment substitution through the CEA Act was achieved for the Brunswick Pipeline application, providing an effective, streamlined, one-window approach to environmental and regulatory assessment of a large, complex, NEB-regulated project. The successes and experiences gained in implementing this pilot framework provide a strong foundation for continued development and implementation of environmental assessment substitution for future candidate applications filed with the NEB.
The collaborative work that the NEB carries out with other agencies was also evident in the TMX - Anchor Loop Application. The project required an environmental screening under the CEA Act. To achieve greater regulatory efficiency, the NEB worked together with other federal and provincial authorities to create a coordinated environmental screening process that would meet the various environmental assessment requirements. Positive feedback was received from the agencies involved on increased efficiency as a result of the coordinated process.
3. The NEB has in place mechanisms to collect and disseminate best practices and ensure continual improvement in the design, construction and operation of regulated facilities.
The NEB promotes the complementary goals of safety and environmental protection throughout the lifecycle of projects within its jurisdiction. Each application is assessed from integrity, safety, security and environmental perspectives to ensure the project could be constructed and operated in an appropriate manner. This is followed by inspection and monitoring of approved projects during construction and operation; auditing of safety, integrity and environmental protection programs; and investigation of reportable incidents.
The NEB’s full regulatory lifecycle responsibilities mean that it collects a significant amount of information on the safety and environmental performance of its regulated companies. This in turn provides the Board with ongoing, practical lessons about best practices which the Board applies in its regulatory activities.
The NEB continues to consult with industry and interested parties to identify opportunities for improvement in areas such as emergency and security management through participation in the Canada Standards Association (CSA). The Board also continues to seek new forums for communication.
One of the Board’s initiatives for 2006-2007 was to disseminate best practice information on safety, security and the environment. Phase I of this work is partially completed; resource constraints at the NEB have not enabled the Board to complete Phase I of this project, and it has been extended into 2007-2008.
In 2006-2007, the Board was tasked to produce guidance documents for security management in partnership with CSA. The CSA approved a proposal to develop a CSA Security Management Standard for the Petroleum and Natural Gas Industry. NEB staff chair this committee. The scope of this standard will include all petroleum and natural gas industry systems including, but not limited to, pipelines, oil and gas production facilities, meter stations, compressor stations, pump stations, gas plants, tank farms, terminals, LNG facilities, processing facilities, underground storages, the Supervisory Control and Data Acquisition system, and other supporting assets. The project is on track for publication of a security standard in 2009-2010.
2.3.2 Goal 2
|
NEB-regulated facilities are built and operated in a manner that protects the environment and respects the rights of those affected. |
The NEB strives to fulfill its commitment to protecting the environment and respecting the rights of those affected throughout the lifecycle of the facilities it regulates. This lifecycle approach includes the sharing of information and expectations during pre-application project design and application preparation, assessment of the environmental and social impacts of proposed projects at the application stage, monitoring and inspection of approved projects and condition compliance during construction and operation, auditing of environmental protection programs, investigating spills and releases, and ensuring that the abandonment of facilities is carried out appropriately to protect the environment and to address the concerns of affected landowners and residents. Throughout these phases, the Board makes efforts to ensure that regulated companies engage with those people whose interests are potentially affected by their projects and activities.
In addition to accomplishing key objectives for environmental assessment harmonization and substitution, the NEB made progress in improving on other areas of its risk-based integrated compliance approach to fulfill its Goal 2 responsibilities. In 2006 the NEB initiated work on streamlining its approach for dealing with small pipeline applications by exploring ways to align application preparation and assessment expectations with the level of risk associated with the proposed facility. The NEB began to implement some elements of an integrated system for promoting effective, risk-based decision making related to environmental protection and respecting the rights of those affected. For instance, the management system audit of Trans Quebec and Maritimes Pipelines Inc. completed last year included an examination of environmental programs, and a focused environmental audit was carried out on an ExxonMobil plant in Nova Scotia. The NEB also began to apply a new lifecycle, risk-based approach for assessing some facilities applications filed in the past year, including Nexen’s Cuthbert Gas Pipelines, Enbridge Westspur’s Alida to Cromer Capacity Expansion, and TransCanada’s Keystone Pipeline.
The NEB continues to advance its Goal 2 mandate to respect the rights of those affected. In 2006 the NEB responded to 20 cases in which landowners brought forward issues regarding the effects of NEB-approved facilities on the use and enjoyment of their properties. Over 90 percent of these complaints were resolved within the NEB’s service standard (80 percent in 60 days). In all but one of these cases NEB staff were able to help the company and the landowner resolve the dispute among themselves without the need for a Board decision. Furthermore, significant progress in developing the Damage Prevention Regulations was made in 2006, including consultation with stakeholders. The progress achieved in 2006-2007 has increased the possibility that these regulations will be ready for implementation within the next year.
Performance Measures and Results
Similar to previous years, the NEB used the following two measures to gauge its performance in fulfilling its Goal 2 mandate:
- Percent of environmental conditions that achieved their desired end results.
- Number of major releases into the environment per year.
Percent of environmental conditions that achieved their desired end results
Environmental conditions are attached to project approvals to address specific environmental issues associated with a project. Each condition attached to an Order or Certificate issued by the Board has a defined desired end result (DER). Once condition compliance is confirmed, the NEB assesses the effectiveness of environmental conditions by evaluating achievement of the DER. Achievement of the DER is confirmed through NEB inspections and project monitoring. Measuring the DER achievement of environmental conditions aids the Board in determining the need for and opportunities to improve the clarity and effectiveness of the conditions it places on facility approvals.
All environmental conditions evaluated for achievement of DER were confirmed to be effective in achieving their desired outcomes over the past year. This is a continuation of the trend realized in recent years toward increasing levels of DER achievement, even though condition compliance rates have not always been steadily improving in the same manner (Table 3). These trends reflect the investment that the NEB has made to improve the relevance and effectiveness of regulatory conditions.
These results indicate that companies reached a level of full compliance with the environmental conditions set by the NEB in the past year and that all of these conditions were effective in achieving the DER. The results are also indicative of the NEB’s efforts to improve the internal tools and processes that guide the use of conditions in facilities regulation.
Table 3: Environmental Condition Compliance and Achievement of Desired End Results
|
Year |
Condition Compliance (%) |
DER Achieved (%) |
|
2006 |
100 |
100 |
|
2005 |
88 |
99 |
|
2004 |
89 |
96 |
|
2003 |
97 |
91 |
|
2002 |
97 |
81 |
|
2001 |
93 |
82 |
Number of major releases into the environment per year
Major releases are defined as unintended or uncontained releases exceeding 100 m3 of liquid hydrocarbon. The number of major releases of liquid hydrocarbon to the environment is considered a key indicator of the success of operating facilities regulated by the Board with regard to Goal 2. The desired target is that NEB-regulated facilities operating under approved permits and conditions should have no major releases to air, land or water.
One major release by an NEB-regulated company occurred last year, involving an accidental release of 126 m3 of sweet crude oil from a facility under the responsibility of Enbridge Inc. near Cromer, Manitoba. NEB staff investigated the site soon after the spill, and this investigation is ongoing. The number of major releases is down from the two encountered in 2005 and within the range of between zero and three occurring annually over the past several years (Table 4)
Table 4: Major Releases to the Environment During Operation
|
Year |
No. of Major Releases |
|
2006 |
1 |
|
2005 |
2 |
|
2004 |
0 |
|
2003 |
0 |
|
2002 |
1 |
|
2001 |
1 |
|
2000 |
0 |
|
1999 |
3 |
|
1998 |
0 |
Program and Results on Objectives of 2006-2007
The objectives for Goal 1, which focuses on safety and security, apply to Goal 2, which focuses on environment. The results achieved toward Goal 2 under these objectives are discussed under Goal 1.
2.3.3 Goal 3
|
Canadians benefit from efficient infrastructure and markets. |
The NEB promotes efficient energy infrastructure and markets through the regulation of pipeline and electrical transmission facilities, pipeline tolls and tariffs, and energy imports and exports. The NEB also provides energy information to Canadians and works to continually improve the efficiency of its regulatory processes.
The NEB is responsible for approving natural gas, natural gas liquids, crude oil and electricity exports. The basis of the NEB’s approach for the authorization of exports is to ensure that Canadians have access to Canadian-produced commodities on terms and conditions at least as favourable as those available to export buyers. To achieve this outcome, the NEB undertakes extensive monitoring and reporting of market conditions. The NEB promotes functional markets and monitors these markets to verify they are responding to market signals consistent with the fundamentals of supply and demand. Additionally, the NEB monitors transportation markets for the utilization and adequacy of pipeline capacity. The NEB also informs the public about energy market trends on an ongoing basis. Providing and interpreting energy market information contributes to the efficient operation of energy markets.
Finally, in the context of the NEB’s operations, efficient energy infrastructure and markets embodies regulatory efficiency. This includes reducing regulatory barriers, streamlining regulatory processes and effectively coordinating these processes with other agencies, when appropriate, and striving to minimize costs incurred by parties.
Performance Measures and Results
To gauge results under Goal 3, the NEB used three performance measures:
- Evidence that Canadian energy and transportation markets are working well.
- Evidence that advice and information products benefit Canadians.
- Evidence that the NEB’s regulatory processes are efficient and effective.
Evidence that Canadian energy and transportation markets are working well
Energy Markets
A key indicator that energy and energy transportation markets are working well is that Canadians can obtain energy commodities on similar terms and conditions that are equitable with those of export buyers. In the context of the North American market, this means that the prices paid for oil, gas and electricity in the domestic market should be responsive to demand and supply pressures and, in an integrated market, essentially the same as the prices in the export market. Price trends over the past several years indicate that domestic and export prices have been tracking closely (Figures 2 to 5).
Figure 2 illustrates that the natural gas market continues to work. Canadians are paying fair market prices for natural gas. In 2006, gas prices retreated from the 2005 post hurricane peaks as there were no winter supply difficulties encountered in North America and in recognition that natural gas storage was going to be filled earlier than normal. In the fall, prices climbed in anticipation of normal winter weather.
Figure 3 illustrates that the light crude oil market continues to work. Canadians are paying market prices for light sweet crude oil. In July 2006, crude oil prices peaked at US$78.40 per barrel during intraday trading on concerns of escalating conflicts in the Middle East (note: the number is higher in Figure 3 because it is in Canadian dollars). By year-end, prices had plunged, largely due to very high crude oil inventories in the U.S. and a lack of cold weather in key heating oil markets.
Figure 2: Comparison of Export and Domestic Natural Gas Prices
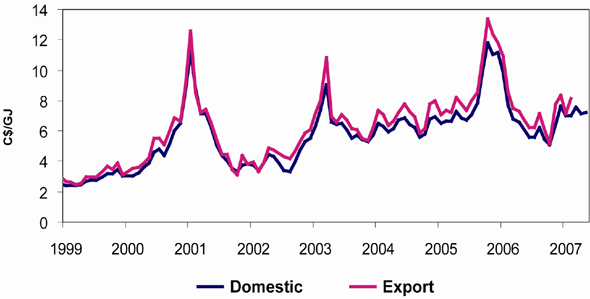
Figure 3: Comparison of Export and Domestic Oil Prices
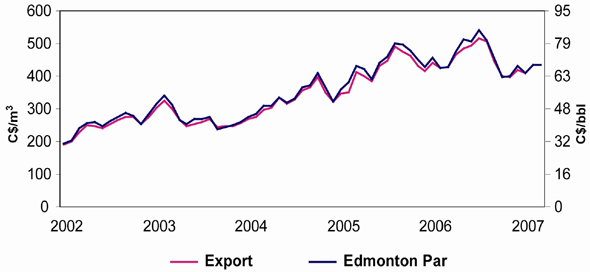
In the first quarter of 2007, colder temperatures and refinery interruptions in Canada and the U.S. resulted in declines in inventory levels of petroleum products adding upward pressure to crude oil prices. A fire at Imperial Oil Ltd.’s Nanticoke refinery caused gasoline and diesel fuel shortages in Ontario and parts of Quebec.
In Canada, only Ontario and Alberta have functioning electricity markets where price is determined by the forces of supply and demand. Figure 4 and Figure 5 illustrate prices in interconnected electricity markets. Where interconnected markets have adequate generation and are connected by efficient and effective transmission systems, price changes in one market should reflect price changes in the other. If transmission constraints exist between the interconnected markets, there will be less tendency for prices to be correlated.
For example, Ontario wholesale electricity prices are correlated with adjacent U.S. markets. Figure 4 shows Pennsylvania–Jersey–Maryland (PJM) Interconnections and New York–West pricing points.
Figure 4: Ontario (IESO) and New York Electricity On-Peak Power Prices
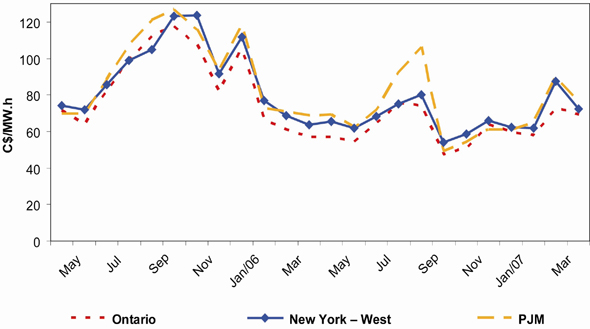
Ontario peak prices increased to C$66/MW.h in July 2006, from C$55/MW.h, during a period of hot weather that drove power demand up to record levels or near record levels almost everywhere in North America.
Although Ontario experienced a record demand of 27,005 MW (versus a capacity of approximately 31,000 MW) on 1 August 2006, price increases were relatively moderate because of adequate supply.
With cooler than normal weather in September, decreased air conditioning demand resulted in lower natural gas prices and lower electricity prices.
As shown in Figure 5, the Alberta Electric System Operator (AESO) on-peak power price and the Mid-Columbia, or Mid-C price in Washington State represent western pricing points. Correlation between the two prices is evident but is not as close as in eastern Canada. Transmission constraints continue to limit the volume of energy that can be traded between the regions.
Figure 5: Alberta (AESO) and Mid-Columbia (Mid-C) On-Peak Power Prices
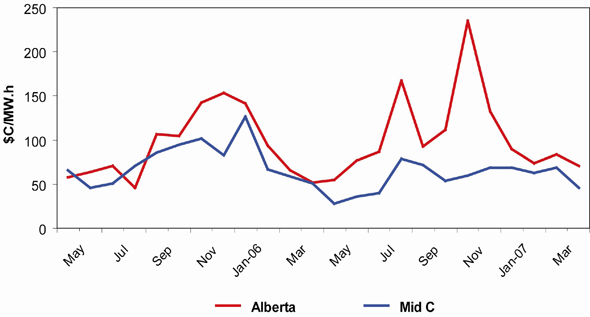
The Alberta monthly pool price spiked to C$128/MW.h in July 2006 due to a tight supply/demand balance when temperatures were high. Some generation supply had been lost and import transmission was limited. The monthly pool price increased again in October 2006 to C$174/MW.h when 1,500 MW of coal generation was offline due to planned outages.
Transportation Markets
For the natural gas and oil pipeline transportation systems to work well, the following three factors must be present: 1) there is adequate pipeline capacity in place to move products to consumers who need them; 2) pipelines are providing services that meet the needs of shippers at reasonable prices; and, 3) pipelines have adequate financial strength to attract capital on terms that allow them to build infrastructure and maintain their systems at a reasonable cost to customers.
With respect to the adequacy of pipeline capacity, one measurement is based on the principle that if adequate capacity exists, the difference in commodity price between two markets connected by a pipeline should be similar or less than the cost of transportation. Prolonged periods of a higher price differential could indicate the need for additional capacity on a pipeline, as prices at the production end become relatively depressed if there is adequate ability to move supplies to market.
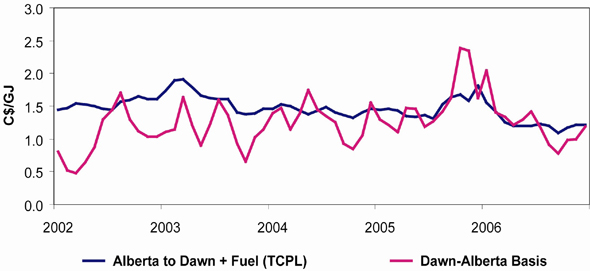
As Figure 6 shows, the historical gas price difference between Dawn, Ontario and Alberta has generally been less than the cost of transportation (firm transport plus fuel) via the TransCanada pipeline which connects these two markets. This provides an indication that in general there has been sufficient pipeline capacity between Alberta and Ontario. Using similar analysis, the NEB concludes that adequate capacity existed on all major gas pipeline corridors over the last year.
Figure 6: Alberta Basis versus Transportation and Fuel Cost
The NEB also directly monitors pipeline throughput relative to capacity to gauge whether an adequate level of transportation is available. This analysis also indicated that natural gas pipeline capacity was adequate but showed some constraints on oil pipeline capacity in 2006-2007. Oil pipeline capacity utilization is illustrated in Figure 7.
Figure 7: Oil Pipeline Capacity Utilization
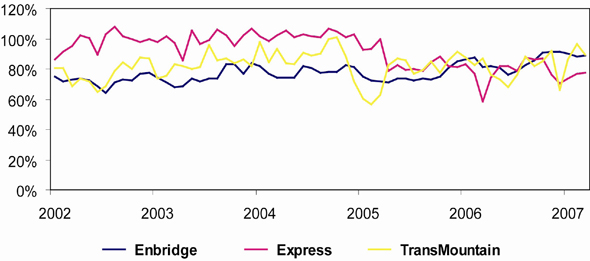
For example, the Terasen (Trans Mountain) Pipeline (TPTM) system was unable to flow all volumes offered to it on a number of occasions as an increase in transportation of heavier crude volumes decreased available capacity. Despite the addition of 5,600 m3/d (35 Mb/d) of capacity in April 2007, TPTM continues to operate near full capacity. Strong demand for Western Canadian crude oil from refineries located in Washington State, coupled with a supply outage in Alaska increased throughputs on the Trans Mountain system. Express was also required to apportion capacity between the shippers several times during the year as a result of increased shipments downstream on the Platte pipeline due to growth in crude oil production in the US Rockies region. Certain lines on the Enbridge system also have been operating at or close to full capacity and have at times been unable to flow all volumes offered.
While oil pipeline capacity utilization in 2006-2007 indicates that there was spare capacity on some of the pipelines in 2006, this was partially due to facility outages reducing the amount of crude oil or products to be transported. As Canadian oil production increases, capacity on Canadian oil pipelines remain very tight and additional capacity may be required.
In 2006 and 2007, the NEB has received or approved a number of applications for pipeline projects that propose to expand the capacity of oil pipelines in Western Canada. In October 2006, the Board approved an application by TPTM to expand a pumping station and to loop a portion of its pipeline.
Evidence that advice and information products benefit Canadians
The NEB provides information products about energy market trends so that the public has information to make decisions about choices for energy sources for the future, and so that policy makers have access to independent, timely and objective energy information to make informed decisions. The energy market information is provided through energy market assessments, statistical reporting and consultation with other organizations. All of this material is available through the NEB website. In 2006-2007, the number of web visits to the NEB Internet site doubled over 2005-2006, and the number of media references to NEB activities increased by 131 percent over last year, indicating greater use of NEB-source energy information.
Evidence that the NEB’s regulatory processes are efficient and effective
The NEB continues to monitor the efficiency and effectiveness of its regulatory processes. Service standards have been published and posted on the NEB’s website since 2005. Performance results on service standards are discussed in other sections of this document and summarized in Table 11.1.
The NEB compiles data on cycle times–the time between receiving an application and rendering an NEB decision–to track the number, type and processing time of applications it receives. This provides evidence that the NEB’s regulatory processes are efficient and effective and helps pinpoint areas requiring attention. The NEB has established service standards for these cycle times. Table 5 shows the service standards for the various types of applications and permits and the performance relative to the service standard for the 2006-2007 year. It also includes the new service standards for electricity export applications.
The NEB’s standard for electricity export applications has been 80 percent of all routine applications completed within 75 days of the receipt of a complete application. During the period April to December 2006, the NEB processed only two of five within the service standard. In three cases, the NEB was not able to meet its service standards due to applicant delays. Staff turnover at the NEB was also a contributing factor. As a result, the NEB developed supporting tools and procedures to help improve its service standard success rate.
Table 5: Cycle Times and Service Standards
|
Type and Number |
Processing Time |
||
|
Section 58 Applications* |
Standard |
Result |
Average |
|
Category A: 6** |
80% in 40 days |
83% in 40 days |
33 days |
|
Category B: 15 |
80% in 90 days |
87% in 90 days |
73 days |
|
Category C: 0 |
80% in 120 days |
Not applicable |
Not applicable |
|
Electricity Export Authorizations |
Standard |
Result |
Average |
|
Routine: 5 |
80% in 75 days |
40% in 75 days |
79 days |
|
Electricity Export Authorizations*** New Service Standards |
Standard |
Result |
Average |
|
Category A : 0 |
80% in 40 days following the completion of the NOA/DOP period |
Not applicable |
Not applicable |
|
Category B : 1 |
80% in 90 days following the completion of the NOA/DOP period |
100% in 90 days |
81 days |
|
Category C : 0 |
No service standard |
Not applicable |
Not applicable |
| * Section 58 applications are classified into one of three categories (minor, moderate, major) based on: their level of complexity; the estimated number and type of information requests which may be generated; the probability of third-party interest; and the level to which a Federal Authority may become involved in the environmental assessment of the application. | |||
| ** The NEB’s streamlining order and Operations and Maintenance initiative have reduced the number of applications required without change to the regulatory expectations for safe construction and operation. | |||
| *** Electricity export applications are divided into one of three categories (minor, moderate, major) based on: their level of complexity; the estimated number and type of information requests which may be generated; and the level of third-party interest. | |||
The NEB adopted new service standards for electricity export applications for implementation in January 2007. The service standards are based on the complexity of the application and are comparable to the section 58 service standards. Under the new service standards, the NEB processed one electricity export application during the period January to March 2007. This application was processed within the service standard requirement.
In 2006-2007 the NEB processed 226 short term applications, including 63 propane, 52 butane, 64 crude oil, 37 petroleum product export orders and 164 natural gas import and export orders. All export orders met the NEB’s service standard of two working days.
Program and Results on Objectives of 2006-2007
The NEB identified three objectives under Goal 3 in its 2006-2007 RPP. These objectives and the results achieved are discussed below.
1. NEB regulatory processes are efficient, seamless and responsive.
In 2006-2007, successful test cases were conducted to match the NEB’s applications assessment processes to project complexity and risk. This approach considers the relative risk of the project, the compliance record of the applicant and the best means to ensure compliance given the NEB’s ongoing regulatory oversight of the design, construction and operation of the facilities. In the assessment of one small natural gas pipeline application, as a pilot project, the time required to assess the application was significantly reduced and matters of safety, environmental protection and economic efficiency were properly addressed. The NEB will continue to pursue such efficient and flexible processes.
The NEB’s focus on goal oriented regulation continues; significant progress has been made in developing the new Canada Oil and Gas Drilling and Production Regulations, the new Damage Prevention Regulations and the updated Canada Oil and Gas Diving Regulations.
The NEB continued to implement an ISO-based Quality Management System (QMS) for its own operations. QMS implementation included documenting processes, along with procedures, templates, work instructions, internal training on maintaining a QMS, and reviewing and improving processes. The availability of these materials to NEB staff has helped to streamline internal processes and supports the continuity, efficiency and timeliness of regulatory processes.
As part of implementing a QMS, the NEB undertook to document and improve its regulatory framework by outlining the outcomes that it works to achieve through its regulatory processes. The NEB developed a comprehensive and systematic model that integrates its vision, values, goals, outcomes and processes. This will allow the Board to improve the alignment of its activities to its goals and improve the measurement of its effectiveness.
During 2006-2007, the NEB implemented, jointly with NRCan and INAC, a review of the regulatory framework regarding the Frontier areas pursuant to its mandate. The three agencies developed a consensus list of possible amendments for the COGO and CPR Acts, and an action plan for the upcoming fiscal year to work toward a more effective and efficient regulatory framework for the Frontier areas.
2. Policy-makers, industry and the Canadian public are better informed on regulatory and related energy matters.
The NEB periodically produces specific in-depth energy market assessments (EMAs), as part of its regulatory mandate to monitor the supply and demand of energy in Canada. The reports discuss issues associated with, natural gas, oil, electricity and transportation markets. In 2006-2007, the NEB issued four reports:
- Short-term Canadian Natural Gas Deliverability 2006-2008
- Natural Gas for Power Generation: Issues and Implications
- Canadian Hydrocarbon Transportation System: Transportation Assessment
- Canada’s Oil Sands – Opportunities and Challenges to 2015: An Update
All EMAs can be found on the NEB’s website at http://www.neb-one.gc.ca under Energy Reports.
In 2006-2007, the NEB developed an enhanced suite of products and communication services for its energy market analysis and observations. Included were media briefings on the energy market reports and two media briefings providing the NEB’s outlook for crude oil, natural gas and electricity markets prior to the summer and winter seasons. These outlooks assess the supply and demand balance going into the heating and cooling seasons and provide the NEB’s expectations of how the markets will perform over the next few months. In addition, NEB Board Members and staff presented at various conferences and roundtables.
The improved suite of energy market communication products includes a new consumer-focused section within the NEB website, launched in January 2006, to provide Canadians with information about energy pricing in an easy-to-understand format. The energy pricing section examines oil, natural gas, propane and electricity and has attracted strong interest, recording more than 16,000 visits in 2006 and the first quarter of 2007.
The NEB has a legislative responsibility to compile data for several statistical reports related to its regulatory role in the oil, gas and electricity industries. Subject areas include natural gas exports, imports, volumes and prices; exports of propane and butane; crude oil and petroleum products exports; light and heavy crude oil export prices; crude oil supply and disposition; and imports and exports of electricity. These reports can be found on the NEB’s website. The success of the suite of communication products was evident in the number of visits to the NEB website for energy information, statistics and reports in 2006-2007 – an increase of 45 percent from the previous year.
Feedback from stakeholders representing energy interests across Canada has shown that through the EMAs and its other initiatives, the NEB provides considerable value to Canadian decision makers through the integrity, independence and objectivity of the information and analysis it provides.
As part of the NEB’s next study of Canada’s long-term energy supply and demand, two consultations were conducted with key stakeholders across the country. The Energy Futures report, to be published in the fall of 2007, will provide an integrated analysis of energy markets from 2005 to 2030.
3. The NEB is proactive in providing fair outcomes for stakeholders regarding infrastructure investments.
The Canadian Hydrocarbon Transportation System: Transportation Assessment was published in June 2006. Using survey information from 2005, this report looks at whether the transportation system is working well and addresses questions of adequacy of pipeline capacity, pipeline services, and the financial capability of the pipelines. It concluded that NEB regulated pipeline companies are financially sound and currently have access to capital. The report also concluded that shippers continue to indicate that they are reasonably satisfied with the services provided by pipelines and there is adequate capacity in place on natural gas pipelines but capacity is tight on oil pipelines. An updated hydrocarbon transportation report based on 2006 survey data will be released in 2007.
2.3.4 Goal 4
| The NEB fulfills its mandate with the benefit of effective public engagement. |
Throughout its history the Board has provided opportunities for the public to participate in the regulatory decision-making process. In recent years, the scope of these opportunities has grown to include broad consultation on new processes, an increased number of meetings and hearings in affected communities, and a wider range of tools for the public to access information about the NEB’s operations.
Effective citizen engagement requires a commitment by all stakeholders for open, honest and transparent communication. Parties affected by proposed projects have much at stake and in order to make decisions in the public interest, it is critical that the NEB ensures appropriate public engagement. Simplified processes, information sessions, Internet-accessible regulatory documents and Appropriate Dispute Resolution2 are among the methods being used by the Board to support its goal of effective public engagement.
Hearing participants, and landowners in particular, have argued that this lack of support puts them at a disadvantage during specific hearings as many cannot afford to hire technical experts or lawyers to represent them or take unpaid leave to participate. The NEB is seeking to address the absence of participant funding.
By offering opportunities for interested Canadians to be effectively engaged, NEB processes become more accessible to a wide range of stakeholders. These deliberations will be enriched by having involvement with a broad spectrum of perspectives and ideas.
Performance Measures and Results
To measure the effectiveness of the Goal 4 work, the Board used the following measure:
- Stakeholders are involved effectively in the Board’s public processes.
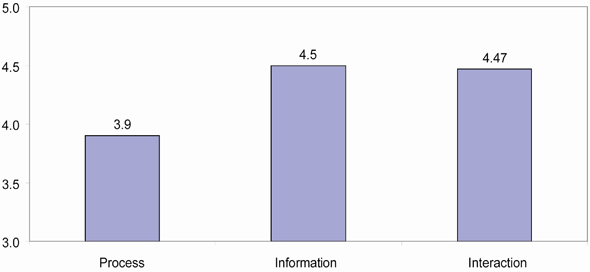
The Board is committed to ensuring that stakeholders are involved effectively in the Board’s public processes. A composite indicator assessing stakeholder satisfaction with NEB processes, information and interaction is used to assess this measure. Based on data from a variety of sources, including surveys administered throughout the year after events such as workshops and hearings and through comment cards inserted into all publications, stakeholders indicated that they were satisfied with the Board’s performance (Figure 8). Overall satisfaction was higher than last year: for processes up 5.4 percent; interaction up 9 percent; and information up 15 percent. These positive results reflect the NEB’s efforts to ensure stakeholders understand what the NEB does and how to be involved in Board processes that affect their interests.
Figure 8: Stakeholder Satisfaction with Process, Information and Interaction
A greater number of events targeting the Canadian public and the media were organized in 2006-2007 in an effort to share information in a timely and efficient manner. The NEB has also taken an increasingly proactive approach with the media by being more responsive to the needs of reporters with respect to the type and extent of information provided, distribution of complementary information pieces and plain language reviews.
Visits to the NEB website are higher than ever. Total web traffic has seen a 95 percent increase over the previous year. Media hits, when a news item reports on NEB activities either by mentioning the NEB name or an activity, are also on the rise as can be seen in Table 6. With increased media interest in the east, the NEB saw a 382 percent increase in French media hits. The total percentage increase from the previous year of 131 percent reflects the commitment made by the NEB to be accessible through its communications efforts.
Table 6: Media Hits covering NEB Activities
|
Media Hits |
2005-2006 |
2006-2007 |
Percent Increase |
|
English |
459 |
1033 |
125 % |
|
French |
11 |
53 |
382 % |
|
Total |
470 |
1086 |
131 % |
Program and Results on Objectives of 2006-2007
As noted in the RPP, the NEB identified two objectives and the results of the work performed can be seen below.
1. Engagement and communication practices for NEB matters meet the needs of stakeholders.
The public engagement framework has been completed and supported by Board Members. The framework includes a logic model that is aligned with the NEB’s strategic outcome as stated in the Program Activity Architecture. Each activity and process is being assessed from a quality perspective through the NEB’s Quality Management System. Tools and templates are now available to staff to assess situations and to support consistent, timely engagement approaches across projects. Multiple information sessions were conducted in the pre-hearing phase of some projects in response to public interest in the affected regions.
Public and aboriginal engagement objectives were clarified through the development of an engagement logic model. Feedback was sought after each public information session and these evaluations consistently indicated that groups value the face-to-face interactions with NEB staff. Engagement project working groups have been created to better address landowner concerns originating from potential projects being scoped for the Prairie and Quebec regions.
In order to enable the public to more easily access NEB information, a newly hired webmaster reviewed the NEB’s Internet site, in consultation with all business interests at the NEB. The website was then redesigned following Government of Canada requirements and is expected to be launched in late May 2007.
2. The NEB pursues participant funding in support of harmonized processes.
In 2006-2007, the NEB completed a successful pilot for lead agency substitution under the CEA Act for the Brunswick Pipeline environmental assessment. The ability to administer participant funding for such harmonized processes would enable effective and viable full substitution for the NEB.
Presently, funding for participation is available only for landowners participating in detailed route hearings, under section 39 of the NEB Act. Funding for participation is not available for project assessments under Part III (construction and operation of pipelines) and Part IV (tolls and tariffs) of the NEB Act. Public participants in federal environmental assessments (panel reviews, comprehensive studies) are entitled to participant funding through the CEA Agency.
In 2006-2007, the NEB evaluated options for participant funding and due to concurrent activities, decided not to produce a regulatory submission in this year. The NEB is continuing to work toward participant funding through a longer term approach which may involve legislative change.
2.3.5 Goal 5
| The NEB delivers quality outcomes through innovative leadership and effective processes. |
The purpose of Goal 5 is to emphasize the importance of leadership and management accountabilities in order to support the creation and sustainability of a high-0performance organization that delivers on its commitments through sound business management and effective decision making.
In order to sustain its reputation as an efficient and effective regulatory agency and to better serve its stakeholders, the NEB continued the re-organization of its corporate structure. This past year within the Integrated Solutions Business Unit (IS BU) six teams were reduced to four. The Desktop and Network Services Team was amalgamated with Information Systems to form the Business Technology Team. Supply Management was amalgamated with the Finance Team to form Finance, Facilities and Procurement Services.
Due to the size and variability in the IS BU a Deputy Business Leader position has been created to oversee the daily operation of the unit while also assuming responsibility for developing and maintaining integrated business continuity and security strategies.
The establishment of a Strategic Resources Advisor position has been instrumental in re-orienting the NEB business planning cycle and allowing the organization to focus on the continuing challenges inherent in increasingly limited staff and financial resources.
Performance Measures and Results
In order to evaluate the success of objectives to meet Goal 5, the NEB used the following performance measures:
- Evidence that the Board’s processes are efficient and effective.
- Employee satisfaction.
- Per capita cost of regulation.
- Progress against planned activities.
Evidence that the Board’s processes are efficient and effective
The NEB is committed to demonstrating excellence in all aspects of its work. In addition to following the Government of Canada’s management direction for an accountable government that is responsive to the needs of Canadians, the NEB invests in its people, processes and systems needed to improve results. The NEB focuses on supporting career growth through development plans, succession planning, mentoring and other opportunities. In particular, the NEB’s leadership development program helps leaders and potential leaders develop their skills through training programs offered by the acclaimed Banff Centre. These courses support the growth of strategic, personal and team leadership skills.
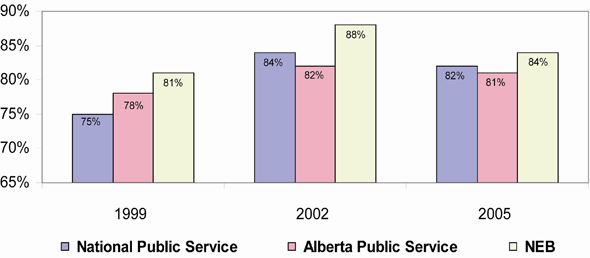
Employee satisfaction
In 2005-2006 the NEB participated in an Employee Opinion Survey. Results indicated an 84 percent rate of satisfaction at the NEB (Figure 9). In 2006-2007, the Board built on that survey by establishing an Advisory Project Working Group to review the results and analyze the responses from the 2005 survey. While 84 percent of employees said the NEB is a good place to work, a number of areas for improvement were identified. Once the results were examined, the working group made 25 recommendations related to workplace enhancements, communications and relationships. The action required to address these recommendations is ongoing.
Figure 9: Employee Satisfaction
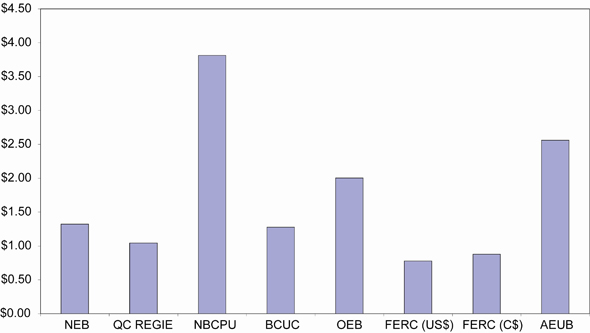
Per capita cost of regulation
The per capita cost of regulation measure continues to compare the annual operating cost of seven different regulators (five provincial and two federal) on a per capita of population served (Figure 10). The comparison provides a relative measure of overall efficiency for the regulators and provides the NEB with information to evaluate its own performance relative to similar regulatory organizations. Costs not related to provincial utility regulation, such as for auto insurance regulation, have been excluded for this comparison.
Figure 10: Per Capita Cost of Regulation
Progress against planned activities
The NEB tracks the progress of major improvement actions (for all goals) that impact the total organization’s effectiveness, efficiency and productivity. Of the 23 major actions identified for 2006-2007, 13 were completed (56 percent), nine multi-year actions continue in progress (39 percent) and one action has been reviewed and re-chartered as a new multi-year activity (5 percent). In addition to the major actions, five multi-year corporate projects are ongoing. Regular monitoring and evaluation efforts, such as tracking best practices and conducting reviews, support overall improvement in organizational performance.
Program and Results on Objectives of 2006-2007
The NEB identified three objectives for Goal 5 in its 2006-2007 RPP. These objectives and the results achieved are discussed below.
1. The NEB has the necessary capacity to fulfill its mandate.
In the 15 years since moving from Ottawa to Calgary the NEB has never encountered a job market as tight as the one experienced in 2006-2007. Escalating skill shortages and corresponding hikes in wages, benefits and perequisites impacted the NEB’s ability to carry out its mandate. The NEB’s annual attrition rate has more than doubled from 7 percent in 2003 to 14.5 percent in 2006. More than half of these departures were fully trained, experienced employees drawn from the ranks of our professional engineers, inspectors, environmental specialists and market analysts. In Calgary’s current hot job market many of these professionals are in high demand and will remain so for the foreseeable future.
The NEB continues to address challenges associated with recruiting and retaining staff. In December 2006 the Board introduced a plan for attracting and retaining staff that includes a market-based allowance for employees working in positions directly related to the energy industry and a pilot pay-for-performance program for all employees.
During the period under review, the NEB continued the development of the Project Management Office (PMO) which provides business support for effective, efficient project management within the NEB. In 2006-2007, the PMO introduced tools and templates to help project managers identify and manage challenges throughout a project’s life cycle. The PMO also developed a training strategy and initiated a “community of practice” to assist project managers in improving their knowledge and sharing best practices.
A “community of practice” is an informal, discipline-focused network whose members meet regularly to share information and knowledge, work collaboratively on solutions to challenges and learn from one another. At the NEB, a number of active and productive communities focus on topics ranging from sustainable development and leadership to resources for our francophone community.
Training is not only provided to our leadership team but is available to everyone at the NEB. In the last year NEB employees spent more than 14,000 hours in learning and development and learning activities ranging from language skills to seminars in Aboriginal awareness and courses in pipeline corrosion. Staff also access campus-direct, E-learning through the Canada School for Public Service, which provides over 155 online courses free of charge.
2. The NEB lives a results-based culture of excellence.
Throughout 2006-2007 the NEB continued to foster strategies and workplace practices that support and encourage our people in their efforts to achieve the highest possible standards of performance. We do this through innovative leadership, sound business management and effective decision-making processes that create an environment where employees have the skills, resources and motivation they need to deliver on their commitments and carry out our mandate.
The Board uses a forward-looking human resources strategy designed to attract and retain people with specific skills and experience. This initiative addresses priorities such as recruiting, leadership development, employee engagement, performance management, staffing levels, training effectiveness and succession planning.
A great amount of effort has been expended and will continue to be expended in the development and ongoing implementation of the NEB’s RESULTS Performance Measurement System. This effort is seen as encouraging enhanced career development discussions, formulation of development plans and staff understanding of succession planning.
The initial development of the NEB Learning Framework has taken place. This initiative will provide enhanced developmental opportunities for a broader range of staff. It will allow for the implementation of the “leader-in-training” program which is an expansion of the leadership training program to include group leaders and those with leadership potential.
The existing NEB Leader’s Forum has been used this period to determine how to increase the application and consistency of flexible work arrangements and apply a decision model that favours work-life balance while respecting the collective agreement.
3. The NEB has a fully operational quality management system.
The NEB’s implementation of its QMS continued in 2006-2007. By April 2007 the NEB had implemented some 60 percent of the requirements associated with adopting a quality system as a framework for:
- Effective, efficient execution of Board processes;
- Ensuring stakeholder needs are met;
- Enabling process consistency where required, and flexibility where possible;
- Encouraging continual improvement.
With the ISO 9001:2000 Quality Management Systems – Requirement as a guide, the NEB is using both internal and external audits to track progress and ensure the QMS is effective. We expect to complete implementation by April 2008.