ARCHIVED - Industry Canada
 This page has been archived.
Archived Content
Information identified as archived on the Web is for reference, research or recordkeeping purposes. It has not been altered or updated after the date of archiving. Web pages that are archived on the Web are not subject to the Government of Canada Web Standards. As per the Communications Policy of the Government of Canada, you can request alternate formats on the "Contact Us" page.
2006-2007
Departmental Performance Report
Industry Canada
The Honourable Jim Prentice
Minister of Industry
Contents
-
Section 1: Overview of the Department
-
Section 2: Analysis of Program Activities by Strategic Outcome
-
2.1 A Fair, Efficient and Competitive Marketplace
- 2.1.1 Policy Sector – Marketplace
- 2.1.2 Operations Sector – Marketplace
- 2.1.3 Spectrum, Information Technologies and Telecommunications Sector – Marketplace
- 2.1.4 Office of Consumer Affairs – Marketplace
- 2.1.5 Competition Bureau – Marketplace
- 2.1.6 Canadian Intellectual Property Office – Marketplace
-
2.2 An Innovative Economy
- 2.2.1 Policy Sector – Science and Technology and Innovation
- 2.2.2 Industry Sector – Science and Technology and Innovation
- 2.2.3 Spectrum, Information Technologies and Telecommunications Sector – Science and Technology and Innovation
- 2.2.4 Communications Research Centre Canada – Science and Technology and Innovation
- 2.2.5 Technology Partnerships Canada – Science and Technology and Innovation
-
2.3 Competitive Industry and Sustainable Communities
-
2.1 A Fair, Efficient and Competitive Marketplace
-
Section 3: Supplementary Information
-
Section 4: Other Items of Interest
-
Section 5: Information Available Online
-
5.1 List of Tables Available Online
- 5.1.1 Summary Table of Priorities by Strategic Outcome
- 5.1.2 Additional Information on User Fees (Table B)
- 5.1.3 Progress Against the Department's Regulatory Plan
- 5.1.4 Details on Project Spending
- 5.1.5 Details on Transfer Payments Programs
- 5.1.6 Conditional Grants (Foundations)
- 5.1.7 Horizontal Initiatives
- 5.1.8 Financial Statements of the Canadian Intellectual Property Office Revolving Fund
- 5.1.9 Financial Statements of the Department of Industry
- 5.1.10 Procurement and Contracting
- 5.1.11 Client-Centred Service
- 5.1.12 Travel Policies
- 5.1.13 Storage Tanks
-
5.2 Results Information for Sub-Program and Sub-Sub-Program Activities by Strategic Outcome
-
5.1 List of Tables Available Online
- Appendix
Industry Canada Performance Report
For the period ending March 31, 2007
Section 1: Overview of the Department
1.1 Minister's Message

I am pleased to present Industry Canada's Departmental Performance Report for 2006-07.
My goal as Minister of Industry, and one of the top priorities of Canada's New Government, is to ensure we maintain a strong economic environment – one that allows Canadians to prosper in the global economy. We are seeing great changes in the international marketplace. New trade agreements, rapidly advancing technologies and the emergence of developing countries are all
contributing to today's business environment. Canada needs to keep pace.
Part of my mandate is to help make Canadians more productive and competitive. We want our industries to continue to thrive and all Canadians to continue to enjoy one of the highest standards of living in the world.
For this to happen, the government is committed to maintaining a fair, efficient and competitive marketplace – one that encourages investment, sets the stage for greater productivity, and facilitates innovation. We are relying on market forces to a greater extent, regulating only when it is absolutely necessary. Our policies have helped turn research into new products and business
processes. In addition, we are making efforts to increase awareness of sustainability practices among Canadian industry, emphasizing the social, environmental and economic benefits they bring.
The Department and the Industry Portfolio have made progress on a wide range of issues this past year, most notably in the areas of telecommunications, science and practical research, manufacturing, small business, consumer protection, patents and copyrights, tourism and economic development.
The Industry Portfolio is composed of Industry Canada and 10 other agencies, Crown corporations and quasi-judicial bodies. These organizations collectively advance Canada's industrial, scientific and economic development, and help ensure that we remain competitive in the global marketplace.
The Department has actively pursued its goals throughout this year, and we have seen significant progress on a number of fronts:
- We have taken steps to modernize marketplace frameworks. In the telecommunications industry, for example, we have decreased regulation and are relying on market forces to a much greater extent. We are reviewing and updating our intellectual property regime. And, in close collaboration with our provincial partners, we are contributing to an ambitious Internal Trade Agreement on labour
mobility.
- We worked with Finance Canada to develop a new Science and Technology Strategy. This strategy is designed to create a business environment that encourages the private sector to innovate and that guides strategic investment of public funds.
- Our efforts to support the generation and commercialization of knowledge were highlighted through new initiatives in manufacturing, government procurement, sustainable development, renewable energy, nanotechnology and biotechnology. In addition, we announced continuing support for the operation and development of CANARIE Inc.'s advanced research network through a $120-million, five-year
grant.
- We have pursued several initiatives to help businesses remain competitive and assist Canadians acquire the skills that are highly valued by growing, innovative companies. We are investing in information and communications technology projects and, through BizPaL initiatives, are reducing paperwork and regulatory red tape for Canadian business.
- Sustainable development is an essential part of today's economy, and we are working with Canadians to increase awareness of corporate social responsibility and sustainability practices among Canadian industry, institutions and communities.
We have accomplished much this year. Using Advantage Canada – the government's long-term economic plan – as our roadmap, we have made great strides toward many of our most important goals. We will continue to focus on these goals to support the conditions for a strong economy – an environment that Canadians expect and deserve.
Jim Prentice
Minister of Industry
1.2 Management Representation Statement
I submit, for tabling in Parliament, the 2006-07 Departmental Performance Report (DPR) for Industry Canada.
This document has been prepared based on the reporting principles contained in the Guide for the Preparation of Part III of the 2006-07 Estimates: Reports on Plans and Priorities and Departmental Performance Reports:
- It adheres to the specific reporting requirements outlined in the Treasury Board Secretariat guidance;
- It is based on the Department's approved strategic outcomes and Program Activity Architecture that were approved by the Treasury Board;
- It presents consistent, comprehensive, balanced and reliable information;
- It provides a basis of accountability for the results achieved with the resources and authorities entrusted to it; and
- It reports finances based on approved numbers from the Estimates and the Public Accounts of Canada.
______________________________
Richard Dicerni
Deputy Minister
______________________________
Date
1.3 Summary Information
Industry Canada's Mandate
Industry Canada draws its legislative mandate from the Department of Industry Act, which states that the Department's general mandate focuses on many areas of the Canadian economy, including industry and technology, trade and commerce, telecommunications, science, consumer affairs, competition, bankruptcy and insolvency, patents, trademarks, copyrights, integrated circuit topographies and industrial designs, investment, small businesses, tourism, and regional economic development in Ontario.
The Department's objective is to help make Canadians more productive and competitive in the global economy, thus improving the standard of living and quality of life in Canada. Through the policies, programs and services that it develops, implements and delivers, Industry Canada is helping to create a dynamic and innovative economy that does the following:
- provides more and better-paying jobs for Canadians;
- supports stronger economic growth through continued improvements in productivity and innovation performance;
- gives businesses, consumers and investors confidence that the marketplace is fair, efficient and competitive; and
- integrates the economic, environmental and social interests of Canadians.
For more information on Industry Canada's work, visit Industry Canada's website.
Industry Canada's Strategic Outcomes
Industry Canada works to foster growth and create high-quality, well-paying jobs by working toward three strategic outcomes:
| Strategic Outcome | Description |
|---|---|
| A fair, efficient and competitive marketplace | A marketplace that protects the interests of businesses and consumers, imposes minimal regulatory burden, and fosters fair competition |
| An innovative economy | An economy that ensures its global competitiveness by supporting the creation of knowledge and the effective translation of this knowledge into new products and processes |
| Competitive industry and sustainable communities | A Canadian industry that can compete globally for resources and customers, and Canadian communities that use their resources to ensure the success of their citizens without undermining the ability of future generations to meet their own needs |
Industry Canada's Governance Structure
The Minister of Industry is responsible for carrying out Industry Canada's mandate. Through the agencies, sectors, branches and directorates, as well as the Industry Portfolio, the Minister of Industry has jurisdiction over policy issues regarding industry; trade and commerce; science; consumer affairs; corporations and corporate securities; competition and restraint of trade, including mergers and monopolies; bankruptcy and insolvency; intellectual property; telecommunications; investment; small businesses; and regional economic development across Canada.
The Deputy Minister and Senior Associate Deputy Minister are accountable for the stewardship of Industry Canada. They provide strategic direction and sound management so that the Department effectively contributes to achieving the government's priorities, and that its wide range of activities is well coordinated and produces concrete results.
From an operational point of view, Industry Canada's governance structure is functionally expressed through its committee structure. This structure exists within Industry Canada at both the working and senior management levels, and the committees provide oversight and decision-making authority in a number of areas, including policy, procurement and contracting.
More specifically, Industry Canada has a number of senior management committees that work to support senior executives and, ultimately, the Minister. These committees enable the development and delivery of policies and programs, and oversee the management of the complex departmental machinery. The committee structure is traditional in nature – divided among operations (Management Committee), policy (Senior Policy Committee) and independent oversight (Audit and Evaluation Committee). These three committees in turn provide advice to the Executive Committee, which supports the Deputy Minister and the Senior Associate Deputy Minister in fulfilling their management responsibilities for the Department. This structure provides strategic direction and oversight, which facilitate the achievement of the Department's three strategic outcomes.
Operating Context of Industry Canada in 2006-07
In 2006-07, the Canadian economy remained strong, despite continuing appreciation of the Canadian dollar, higher energy costs and increasing competition from emerging economies. The global environment was characterized by blurring borders, interconnected supply chains, and highly mobile capital in search of the best returns. In this context, Canada needed to ensure that the necessary frameworks were in place to support a competitive advantage among Canadian firms.
Among the five priorities that were included in Budget 2006, a commitment was made to create new opportunities for Canadians by lowering taxes, rewarding effort and making Canada a better place to do business. Budget 2006 also announced that the government would develop a broad-based agenda to promote a more competitive, productive Canada; that the Minister of Industry, in conjunction with the Minister of Finance, would develop a science and technology strategy; and that the government would study options for reducing paperwork burden on small business.
As such, in November 2006, the Minister of Finance released Advantage Canada: Building a Strong Economy for Canadians. This economic plan reiterated the commitment to a federal science and technology strategy, announced a new commitment to support the removal of barriers to labour mobility across Canada, increased support for research excellence and better alignment between post-secondary research capacity and the needs of business, and called for a 20-percent reduction in paper burden on Canadian business. Overall, these conditions created a dynamic operating context for Industry Canada.
Industry Canada's Financial and Human Resources
| Planned Spending | Total Authorities | Actual Spending |
|---|---|---|
| $1,357.7 | $1,389.0 | $1,189.7 |
| Planned | Actual | Difference |
|---|---|---|
| 6,104 | 5,521 | 583 |
1.4 Strengthening Management Practices at Industry Canada
In 2006-07, Industry Canada continued its commitment to strengthening departmental management practices and used the Management Accountability Framework (MAF) as a tool to advance its management priorities. The MAF is structured around 10 key elements that collectively define management and establish the expectations for good management of a department or agency. Departments and agencies are annually assessed on the effectiveness of their management practices through the MAF assessment process.
As a result of the latest MAF assessment cycle performed by Treasury Board of Canada Secretariat (TBS), Industry Canada has, overall, improved its rating compared with the previous year's assessment. Furthermore, TBS has also noted that the Department has made progress on all areas identified as management priorities for 2006-07. Industry Canada will continue to use the information contained in the MAF assessment, including the management priorities identified for 2006-07 to further strengthen its management practices.
Following is a more detailed account of the progress Industry Canada has made regarding its management priorities.
Implementing the Federal Accountability Act
The Federal Accountability Act (FedAA), which received royal assent on December 12, 2006, reflects the Government of Canada's commitment to make government more accountable. Industry Canada has been working with the Treasury Board Portfolio and other departments and agencies to ensure that the measures related to the FedAA and the FedAA Action Plan are in place. The Department's progress within the past year includes the following:
- the appointment of a Senior Officer for Internal Disclosure of Wrongdoing and the continuance of the Advisory Committee on Internal Disclosure; and
- the review of the Department's funding agreements in order to meet the new requirements under the FedAA, and the review of the Department's practices concerning public opinion research, lobbyists' registration, accounting officer requirements and communications plans.
In addition, Industry Canada's Internal Audit Committee continued to ensure that the Department's internal audit capacity is appropriate for its needs and that the Department is in a position to effectively conduct its program evaluation every five years, as required by the FedAA.
With respect to values and ethics, Industry Canada continues to undertake initiatives supporting a values and ethics culture and informing employees of their responsibilities. These initiatives include providing training on the Values and Ethics Code for the Public Service; since November 2004, the Department has provided more than 80 sessions and has reached a total of 1,600 Industry Canada employees. In addition, the Department has begun implementation of the Public Servants Disclosure Protection Act (PSDPA), as prescribed by the FedAA.
Integrating Human Resources and Business Planning
In April 2006, Industry Canada completed its first round of integrated human resources planning. As a result, nearly all departmental organizations submitted a one-year staffing plan. Some organizations went further, submitting a two- or three-year strategic human resources plan embedded in their business plan. Overall, Industry Canada managers have made progress toward fully integrating human resources, financial and business planning. For instance, the use of collective staffing processes to manage pools of talent for staffing efficiency and employee retention, development and succession management purposes has increased. As indicated in the 2006-07 Report on Plans and Priorities (RPP), one of the key challenges associated with implementing a formal human resources planning process at Industry Canada has been to ensure the integrity of the data provided to managers in support of their planning efforts. In response, the Department has taken steps to address data integrity issues that currently limit the timeliness and reliability of Human Resources Management System-based reporting. For instance, a project office within the Human Resources Operations Directorate was established to coordinate and collaborate with another internal data collection team to address data integrity issues (i.e., incomplete, incorrect or timeliness of the data entry). A steering committee composed of human resources directors was also established to provide direction and oversight of data integrity activities.
In addition, new integrated human resources planning tools were developed in November 2006. This comprehensive tool kit included planning aids, templates and guidelines to enable integrated planning for staffing, official languages, employment equity, learning and succession management.
Modernizing Staffing Initiatives
In order to meet the training needs of its staffing community, in 2006-07 Industry Canada created a development program for staffing advisors that included a training component for the advisors themselves as well as staffing assistants. As in the past, training continued to be provided to staffing managers. During 2006-07, Industry Canada also developed and implemented a framework to monitor staffing. Quarterly monitoring of staffing activities, both qualitative and quantitative, was completed and, along with issues of concern and trends, was reported to senior management. Policies, guidelines, sub-delegation and accountability requirements connected with the review of the staffing framework were also reviewed and modified as necessary during this period either to comply with new requirements of the Public Service Commission of Canada or to better meet the Department's needs.
Industry Canada also plans to further modernize its staffing initiatives. In 2007-08, the Department expects to have customized products to meet the information needs of employees and training needs of managers, human resources professionals and human resources assistants, and to fully implement those products (i.e., deliver training sessions) during 2008-09. In addition, to enhance its modernization efforts, in 2007-08 and 2008-09 the Department will continue to send human resources professionals to various training courses offered by the Canada School of Public Service.
Providing Tools and Guidance Through the Conflict Prevention and Early Resolution Office
The Conflict Prevention and Early Resolution (CPER) Office was established in 2005. Since then, Industry Canada has continued to benefit from the delivery of conflict management workshops and the provision of services in conflict management (conflict coaching, facilitation and mediation). The CPER Office has also created a CPER Network, consisting of bargaining agents, managers and human resources professionals who have participated in training workshops to acquire basic conflict coaching skills that assist them in more effectively dealing with workplace conflict.
During 2006-07, CPER provided services to 54 clients (from all sectors); the majority of services (56) have been in conflict coaching. In addition, 8 conflict management workshops were provided across the Department. The CPER Office will be moving forward on a number of projects to increase awareness and capacity in conflict management across the Department, including training and communication. Progress will be measured through the evaluation components of these projects.
Ensuring a Strong Stewardship Framework Is in Place
Industry Canada has continued to ensure that a strong stewardship framework is in place and adhered to by developing and upgrading resource management tools and techniques, and by strengthened management practices regarding information technology management. Furthermore, to enhance management reporting and decision support throughout the Department and to enable more effective horizontal management and reallocation decisions to fund departmental priorities, new corporate management reports have been developed. As well, Industry Canada has deployed a Salary Resource Management System across the Department along with validated departmental salary information to accurately forecast salary requirements and to facilitate fiscally informed executive-level decision making.
The Department has also developed a Management Control Framework to improve oversight of the accounts verifications process. As well, weaknesses in internal controls have been identified and remediated, along with a new functional reporting regime that has been launched across the Department.
Regarding project management, Industry Canada has implemented an Early Warning System for Contracts. For instance, sole source contracts greater than $25,000 must be reviewed by the Programs and Services Board, and sign-off is required by the Department's Chief Financial Officer on competitive processes. In addition, Industry Canada has also advanced work on developing an Integrated Risk
Management Framework and on identifying the next steps to conduct associated risk management activities.
1.5 Overall Departmental Performance
Linking Industry Canada's Report on Plans and Priorities (RPP) to its Departmental Performance Report (DPR)
In an effort to improve reporting to Parliament, Industry Canada has sought ways to enhance the timeliness and quality of its reports, strengthening the link between departmental plans and priorities versus performance. The Department has streamlined information, consolidated sections and added new areas to ensure readers can easily follow the Department's performance story. These efforts reflect Industry Canada's recognition of the importance of an effective parliamentary reporting regime for transparency and accountability. Current and future efforts made by the Department to improve reporting to Parliament focus on researching and developing options to improve the usability and accessibility of reports required by parliamentarians.
In order to help parliamentarians and Canadians navigate between the performance information in this document and the plans and priorities in the 2006-07 RPP, notable changes are listed in the Appendix.
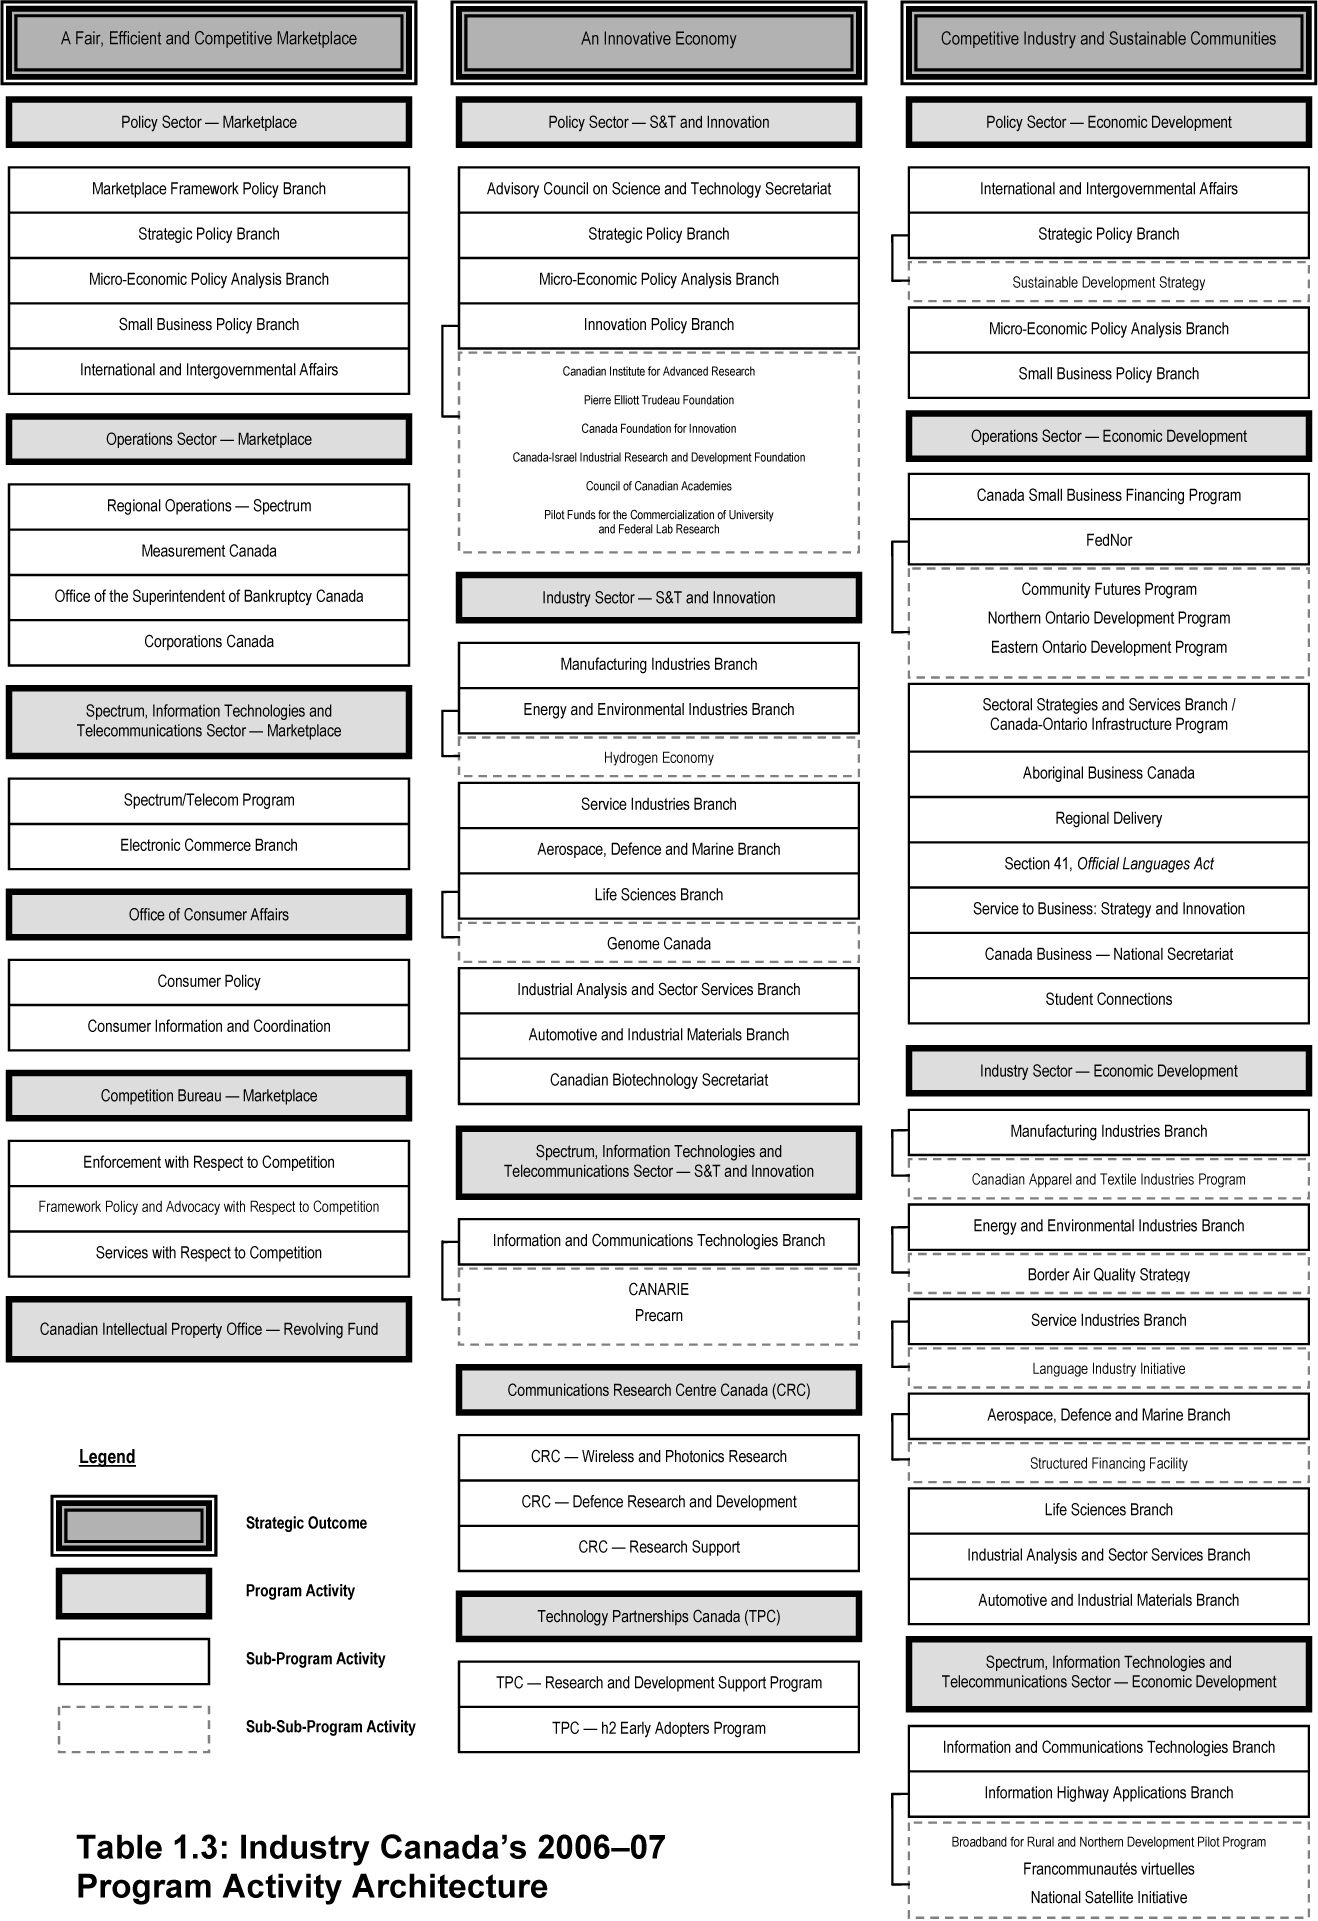
Industry Canada's Program Activity Architecture Structure
Industry Canada's basis for reporting to Parliament is its Program Activity Architecture (PAA). The PAA describes the relationship between the activities the Department undertakes and the strategic outcomes it is working to achieve, in order to produce results for Canadians. In addition, the PAA also provides the Department with a framework that links the expected results and performance measures to individual program activities, clarifying why the Department is doing what it does and how it will measure that results are achieved. Finally, the PAA also serves as a framework to link the Department's financial resources to each program activity, indicating how the Department manages the resources under its control to achieve its intended outcomes.
Industry Canada is working to achieve three strategic outcomes: a fair, efficient and competitive marketplace; an innovative economy; and competitive industry and sustainable communities. Each of these strategic outcomes is supported by one or more program activities in the PAA. In most cases, each program activity is in turn associated with one or more sub-program activities or sub-sub-program activities. Information on results for the Department is reported based on these program, sub-program and sub-sub-program activities.
Table 1.3 shows a graphic representation of Industry Canada's PAA, used as the basis for reporting in this document. Please note that this graphic does not include departmental corporate services, as these are enabling activities and therefore are not reported on in the DPR.
Results of Industry Canada's Priorities
In its 2006-07 RPP, Industry Canada identified five departmental priorities for fostering a more productive Canadian economy that rewards the efforts of individuals and businesses, supports creativity and innovation, and increases trade and investment. In meeting these priorities the Minister clarified the Department's intention to rely, as much as possible, on a free, efficient and competitive marketplace. In this way, the market was able to provide the signals that guided the Department in making the decisions that enhanced competitiveness.
Table 1.4 lists Industry Canada's five priorities and groups them according to the strategic outcome they support. Table 1.4 also indicates whether the priority was new, previous or ongoing and outlines supporting program activities. Allocated financial and human resources are also provided.
In previous years, this section of the document contained indicators that measured progress against Industry Canada's priorities and strategic outcomes. To view these indicators, visit Section 5.2.
| Departmental Priority | Supported by Program Activity | Type of Priority1 | Performance Status2 | Planned Spending and Full-Time Equivalents (FTEs) | Actual Spending and FTEs |
|---|---|---|---|---|---|
| A Fair, Efficient and Competitive Marketplace | |||||
| 1. Continuing to modernize marketplace frameworks in support of a highly competitive and innovative economy for the benefit of all Canadians |
|
Ongoing and previous | Successfully met | $201.9 million 3,208 FTEs |
$179.3 million 2,990 FTEs |
| An Innovative Economy | |||||
| 2. Ensuring the strategic allocation of resources 3. Supporting the generation and commercialization of knowledge |
|
Ongoing and previous | Successfully met | $622.7 million 732 FTEs |
$500.1 million 701 FTEs |
| Competitive Industry and Sustainable Communities | |||||
| 4. Implementing strategic frameworks for priority industrial sectors that have an important impact on the Canadian economy 5. Working with Canadians to position them to take advantage of economic opportunities, support business development, provide long-term growth and promote sustainable development |
|
Ongoing and previous | Successfully met | $532.3 million 961 FTEs |
$510.3 million 804 FTEs |
1 Type of priority is "new," "ongoing" or "previous." "New" means that the priority was introduced during this performance period. "Ongoing" means the priority has no end date. "Previous" means that the priority was reported in a prior RPP or DPR.
2 Performance status is "successfully met," "not met" or "exceeded."
Industry Canada's Priorities
Priority No. 1: Continuing to modernize marketplace frameworks in support of a highly competitive and innovative economy for the benefit of all Canadians
Industry Canada is committed to steadily decreasing regulation, promoting reliance on market forces and reducing barriers to entry in the telecommunications sector. In particular, during 2006-07, Industry Canada pursued an ambitious policy agenda to establish a streamlined regulatory framework for Canada's telecommunications sector, one that is more modern, flexible and efficient. The new policy agenda and subsequent deregulation of local telephone services should contribute to a more competitive Canadian telecommunications market, resulting in more choices, improved products and services and lower prices for consumers.
Other activities undertaken by Industry Canada in 2006-07 include bringing forward legislation that provides intellectual property rights protection for Olympic and Paralympic words and symbols. The legislation strengthens the exclusive rights of the Vancouver Organizing Committee for the 2010 Olympic and Paralympic Winter Games (VANOC™) over key Olympic and Paralympic words and symbols. This enhances VANOC's ability to raise the necessary funds to host a successful Games and showcase Canada to the world. The Olympic and Paralympic Marks Act came into force on June 22, 2007. In addition, Industry Canada brought forward amendments to the Patented Medicines (Notice of Compliance) Regulations under the Patent Act. These amendments, which came into force on October 5, 2006, make it easier for generic drug companies to predict when they may enter the market with a lower-cost version of an innovative, patented drug, thereby accelerating the market entry of generic drugs once relevant patents expire.
In addition, in 2006-07 the Minister of Industry met with provincial and territorial counterparts to discuss ways to strengthen the country's economic union. As a result of this meeting, a significant labour mobility agreement was reached that will be fully in effect by 2009.
In 2006-07, Industry Canada also worked through the Advisory Committee on Paperwork Burden Reduction to reduce the administrative and paper burden on small businesses. This work culminated in a commitment by the government, announced in Budget 2007, for key federal regulatory departments and agencies to establish an inventory of administrative requirements and information obligations with which business must comply, and to achieve a 20-percent reduction by November 2008.
Finally, Industry Canada was instrumental in Justice Canada's development of Bill C-26, An Act to amend the Criminal Code (criminal interest rate), which received royal assent on May 3, 2007. The objective of this Act is to ensure that provinces and territories have the opportunity to establish appropriate protections for consumers who use payday loans. The Act is the result of extensive discussions with provincial and territorial governments and with other federal departments, and it reflects Industry Canada's commitment to enhancing consumer protection within the marketplace frameworks.
Overall, these activities enhanced the Department's ability to contribute to the strategic outcome of a fair, efficient and competitive marketplace. See Section 2: Analysis of Program Activities by Strategic Outcome for more detail.
Priority No. 2: Ensuring the strategic allocation of resources
Adequate funding for research and innovation projects is a key driver of an innovative economy. In 2006-07, Industry Canada worked with Finance Canada to develop the Science and Technology (S&T) Strategy – Mobilizing Science and Technology to Canada's Advantage. The Strategy builds on Canada's strong economic foundation, takes advantage of existing research capacity and ensures that federal investments in S&T make a meaningful difference to improve the wealth and well-being of Canadians. The Strategy also reflects the importance of S&T to the Government of Canada and provides a framework to guide federal government decision making in support of S&T over the coming years.
The Strategy sets out three key advantages distinct to S&T: an Entrepreneurial Advantage to translate knowledge into commercial applications that generate wealth for Canadians; a Knowledge Advantage to position Canada as a leader in generating new ideas and innovations; and a People Advantage to make Canada a magnet for highly skilled people and create an economy with the most highly educated, skilled and flexible workforce in the world. In addition, the government signalled its commitment to the Strategy by announcing $1.9 billion in Budget 2007 to support S&T initiatives. Industry Canada's ability to ensure the strategic allocation of resources on an ongoing basis demonstrates its contribution toward the strategic outcome of an innovative economy. See Section 2: Analysis of Program Activities by Strategic Outcome for more detail.
Priority No. 3: Supporting the generation and commercialization of knowledge
For Canada to live up to its innovation potential, it must continue to support the creation of knowledge, as well as support the transfer of scientific and technological advances made possible by university and government research in the private sector. In 2006-07, Industry Canada supported this priority by providing leadership, working with other government departments and undertaking new initiatives in the following diverse areas: manufacturing, government procurement, sustainable development, renewable energy, nanotechnology and biotechnology.
Furthermore, due to the work of Industry Canada in 2006-07, Budget 2007 announced continued support for the operation and development of CANARIE's advanced research network. Through a $120-million, five-year conditional grant to the not-for-profit corporation CANARIE Inc., researchers in Canadian universities, colleges, research institutes and government laboratories have the capacity to conduct collaborative research on a global basis in all fields of science that benefit Canadians. Industry Canada's ability to support the generation and commercialization of knowledge in an ongoing capacity demonstrates its contribution to the strategic outcome of an innovative economy. See Section 2: Analysis of Program Activities by Strategic Outcome for more detail.
Priority No. 4: Implementing strategic frameworks for priority industrial sectors that have an important impact on the Canadian economy
Industry Canada has pursued a variety of initiatives to help businesses remain competitive and ensure that Canadians acquire the skills that are highly valued by growing, innovative companies. In 2006-07, Industry Canada applied its expertise in the Canadian business landscape to enhance government decision making and industry development activities, and to help create conditions in which Canada can exploit its knowledge. For instance, Industry Canada provided leadership on a broad range of issues that affect the manufacturing sector; it also worked with stakeholders to address policy issues raised by the Canadian Manufacturing Coalition and other industry experts. The Department also led a manufacturing network to strengthen the government's capacity to analyze, review and improve public policy issues that affect Canada's manufacturing sector.
Furthermore, in 2006-07 Industry Canada helped coordinate and oversee federal government initiatives domestically and internationally in several sectors, such as the hydrogen and fuel cell sector, with an overall objective of achieving full-scale commercialization and increasing the exposure of Canadian businesses. Overall, Industry Canada's ability to meet this priority in an ongoing capacity demonstrates its progress toward contributing to competitive industry and sustainable communities. See Section 2: Analysis of Program Activities by Strategic Outcome for more detail.
Priority No. 5: Working with Canadians to position them to take advantage of economic opportunities, support business development, provide long-term growth and promote sustainable development
Sustainable development, along with productivity, employment and income growth, is an integral part of growing a dynamic economy. As a proponent of sustainable development, Industry Canada has made efforts to increase awareness of corporate social responsibility (CSR) and sustainability practices among Canadian industry, institutions and communities.
In 2006-07, Industry Canada, through the activities of FedNor, continued to work with partners to help create an environment in which communities can thrive, businesses can grow and people can prosper. FedNor committed almost $6.5 million in 2006-07 to information communications technology (ICT) projects to ensure Northern Ontario's effective participation in the knowledge-based economy. In turn, these funds contributed to improved connectivity in Northern Ontario's rural communities and to the development of applications such as distance education, telehealth, e-business and web portals.
In addition, Industry Canada's BizPaL project supports the Government of Canada's objectives to reduce unnecessary paperwork and regulatory red tape, thereby working to maintain the competitiveness of Canadian businesses. The project has received various prestigious awards and has been recognized as a model of inter-jurisdictional cooperation and regulatory transformation. Budget 2006 provided $6 million over two years to accelerate the expansion of the BizPaL initiative.
Finally, in 2006-07 Industry Canada worked to broaden CSR awareness by improving the adoption of innovative sustainability tools and practices within Canadian industries. These practices help firms be more responsive to the social, environmental and economic needs of the communities in which they operate, assisting firms reduce risks while enhancing their brand value, reputation and bottom-line performance, thus maintaining or improving their competitiveness.
Industry Canada's ability to build capacity in key industrial sectors in an ongoing manner demonstrates its progress toward contributing to competitive industry and sustainable communities. See Section 2: Analysis of Program Activities by Strategic Outcome for more detail.
| Industry Canada Program Activities | Industry Canada Strategic Outcomes | Alignment to Government of Canada Outcome Area |
|---|---|---|
| Policy Sector – Marketplace Operations Sector – Marketplace Spectrum, Information Technologies and Telecommunications (SITT) Sector – Marketplace Office of Consumer Affairs Competition Bureau Canadian Intellectual Property Office |
A fair, efficient and competitive marketplace | Economic affairs: a fair and secure marketplace |
| Policy Sector – S&T and Innovation Industry Sector – S&T and Innovation SITT Sector – S&T and Innovation Communications Research Centre Canada Technology Partnerships Canada |
An innovative economy | Economic affairs: an innovative and knowledge-based economy |
| Policy Sector – Economic Development Operations Sector – Economic Development Industry Sector – Economic Development SITT Sector – Economic Development |
Competitive industry and sustainable communities | Economic affairs: strong economic growth |
As illustrated in Table 1.5, Industry Canada's program activities and strategic outcomes contribute to three of the Government of Canada's outcome areas under the spending area of economic affairs. Specific Industry Canada activities that contribute to these three Government of Canada outcome areas are detailed below.
Government of Canada Outcome: Economic Affairs – A Fair and Secure Marketplace
Program activities under Industry Canada's first strategic outcome support this Government of Canada outcome by:
- ensuring that effective and modern regulatory instruments are in place;
- managing public goods (i.e., radio frequency spectrum) in the public interest;
- maintaining reliable telecommunications networks and keeping them safe from criminal activity;
- informing consumers and businesses about fraudulent activities in the marketplace;
- promoting the efficient allocation of resources to encourage research;
- developing and commercializing new knowledge; and
- maintaining a modern intellectual property regime that encourages creativity and innovation.
Government of Canada Outcome: Economic Affairs – An Innovative and Knowledge-Based Economy
Program activities under Industry Canada's second strategic outcome support this Government of Canada outcome by:
- undertaking research and development on technologies of importance to Canada;
- providing funding support for research and development in areas where Industry Canada cannot conduct the research itself;
- maintaining a knowledge of the Canadian business landscape and the commercialization environment and identifying future market opportunities; and
- encouraging sustainable development practices among Canadian businesses.
Government of Canada Outcome: Economic Affairs – Strong Economic Growth
Program activities under Industry Canada's third strategic outcome support this Government of Canada outcome by:
- assessing investment proposals to ensure that they demonstrate a net benefit to Canada;
- developing legislation that removes restrictions on the movement of goods, services, persons and investments within Canada;
- working with other federal partners to improve Canada's access to foreign markets; and
- providing funding to communities and specific target groups, including youth, women and small businesses, to ensure that they have access to the necessary resources to thrive and prosper.
Section 2: Analysis of Program Activities by Strategic Outcome
2.1 Strategic Outcome: A Fair, Efficient and Competitive Marketplace
The strategic outcome of a fair, efficient and competitive marketplace refers to a marketplace that protects the interests of businesses and consumers, imposes minimal regulatory burden, and fosters fair competition. This is important because a responsive and attractive Canadian market provides incentive for innovation and economic growth, and it supports individual Canadians. Industry Canada conducts a variety of activities to achieve this strategic outcome, such as improving marketplace programs and services, increasing education and awareness, and enhancing compliance and enforcement with marketplace rules and regulations. The Department also works to harmonize the regulatory system to reduce duplication and regulatory overlap.
More specifically, in 2006-07 Industry Canada's work to modernize marketplace frameworks was seen with the deregulation of the telecommunications industry. On April 4, 2007, the Minister of Industry announced that the Government of Canada was accelerating deregulation of local telephone services. This announcement came as a result of Industry Canada's efforts to emphasize the need for a competitive infrastructure within local telephone exchanges. Furthermore, due to the regulatory processes, frameworks and policy structures developed by the Department, Canada is one of the leading Organisation for Economic Co-operation and Development countries regarding its performance in the telecommunications sector.
In 2006-07, Industry Canada also made recommendations that led to amendments to the Patented Medicines (Notice of Compliance) Regulations under the Patent Act. These amendments were passed on October 5, 2006, making it easier for generic drug companies to predict when they may enter the market with a lower-cost version of a patented drug. This will accelerate market entry of generic drugs once relevant patents expire, providing firms with innovative new drugs with a minimum period of market exclusivity that is internationally competitive. Finally, in 2006-07, Industry Canada developed a renewed Spectrum Policy Framework for Canada, which is the policy foundation for the Canadian Spectrum Management Program.
The following section provides further detail on the ways in which Industry Canada contributes to a fair, efficient and competitive marketplace through the work of its program activities. Additional information can be found at Section 5.2.1.
This strategic outcome is delivered through six program activities:
- Policy Sector – Marketplace
- Operations Sector – Marketplace
- Spectrum, Information Technologies and Telecommunications Sector – Marketplace
- Office of Consumer Affairs – Marketplace
- Competition Bureau – Marketplace
- Canadian Intellectual Property Office – Marketplace
Analysis by Program Activity
2.1.1 Program Activity: Policy Sector – Marketplace
Policy Sector – Marketplace develops marketplace frameworks policy.
Sub-Program Activities: Policy Sector – Marketplace is delivered via five sub-program activities:
- Marketplace Framework Policy Branch
- Strategic Policy Branch
- Micro-Economic Policy Analysis Branch
- Small Business Policy Branch
- International and Intergovernmental Affairs
Development and coordination of policy frameworks that support a fair, efficient and competitive marketplace
Industry Canada measures progress toward this expected result, in part, through the following indicator:
| Indicator | Progress in 2006-07 |
|---|---|
| Tabled and approved legislative initiatives to improve Canada's broad marketplace frameworks (e.g., copyright, insolvency, intellectual property, competition policy) |
|
Industry Canada committed to the following for 2006-07:
- Continue to update marketplace frameworks and policies.
- Establish more predictable and stable rules for the protection of patents in high-knowledge industries.
- Promote the competitiveness and prosperity of small businesses by reducing their paperwork burden.
Results Achieved
Marketplace Frameworks and Policies
In 2006-07, the Policy Sector, in partnership with other sectors, continued to undertake a number of initiatives to update marketplace frameworks and policies. These initiatives are detailed in the following:
- The Policy Sector developed recommendations that led to amendments to the Patented Medicines (Notice of Compliance) Regulations under the Patent Act. These amendments were passed on October 5, 2006, and make it easier for generic drug companies to predict when they may enter the market with a lower-cost version of an innovative, patented drug. This will accelerate the market
entry of generic drugs once relevant patents expire. These amendments were passed jointly with another set of regulations sponsored by Health Canada, which will provide innovative new drugs with a minimum period of market exclusivity that is internationally competitive.
- The Policy Sector also brought forward an amendment to Schedule I of the Patent Act, which came into effect on September 21, 2006. The amendment added a triple-dose combination HIV-AIDS drug to the list of patented pharmaceutical products that are eligible to be exported to developing countries under Canada's Access to Medicines Regime (CAMR).
- Related to this, a consultation paper on CAMR was released by the Policy Sector in November 2006 to solicit comments as to how the regime can better deliver on Canada's commitment to improve access to less expensive medicines that are urgently needed in developing and least-developed countries, while respecting
international trade obligations and maintaining the integrity of the domestic patent system. Approximately 30 submissions, mainly from members of the pharmaceutical industry, non-governmental organizations (NGOs), academia and parliamentarians were received following the report's release. These submissions have been posted on the
CAMR website. In the interim, the House of Commons Standing Committee on Industry, Science and Technology (INDU) decided to undertake a parallel study of CAMR. Policy Sector officials also participated in an NGO-organized workshop to hear directly from developing and least-developed countries about the barriers they face in importing drugs under CAMR. The Policy
Sector has completed its review of all public input on CAMR and is working with other departments to prepare the report to be tabled in Parliament by the Minister of Industry, as required by the Patent Act.
- The Policy Sector also brought forward legislation that provides intellectual property rights protection for Olympic and Paralympic words and symbols. Bill C-47, The Olympic and Paralympic Marks Act, provides special, time-limited intellectual property protection for terms such as "Olympic Games," "Olympics," "Olympia" and "Canada 2010"; short phrases such as "Faster, Higher,
Stronger" and "Spirit in Motion"; and images such as the Olympic rings and the Vancouver 2010 inukshuk logo (a traditional Inuit stone sculpture) in the lead-up to the Vancouver 2010 Winter Games. This bill was introduced in the House of Commons on March 2, 2007, and received royal assent on June 22, 2007. The legislation strengthens the exclusive rights of the Vancouver Organizing
Committee for the 2010 Olympic and Paralympic Winter Games over these words and symbols, and improves the Organizing Committee's ability to negotiate sponsorship agreements with businesses interested in associating themselves with the 2010 Winter Games.
- Part 9 of An Act to Implement Certain Provisions of the Budget, which was tabled in Parliament on March 19, 2007, introduced amendments regarding "eligible financial contracts" (EFCs). These amendments were developed jointly with officials from the Department of Finance. EFCs are financial instruments used to hedge against risk, such as currency rate fluctuations. The amendments move the definition of EFCs from various pieces of legislation to their regulations so that they may be updated with relative ease as financial markets evolve. The amendments also allow
parties the right to terminate an EFC in the event of an insolvency filing and to collect on their collateral. All of these reforms are designed to maintain a competitive Canadian market relative to the United States and the European Union and to ensure that holders of EFCs are not
prejudiced by an insolvency filing. These amendments obtained royal assent after fiscal year 2006-07 had ended.
Internal Trade
- In September 2006, the Committee of Federal-Provincial-Territorial Ministers responsible for Internal Trade agreed to implement a strategy to improve labour mobility so that by April 1, 2009, Canadians will be able to work and have their occupational qualifications recognized anywhere in Canada. The Minister of Industry is the federal government's representative on this
committee, which is composed of federal, provincial and territorial ministers. The Policy Sector prepares the Minister in his efforts to eliminate barriers to internal trade at meetings of this committee.
- Policy Sector made recommendations to the Minister of Industry to advance progress toward an energy chapter for the Agreement on Internal Trade. At a meeting in September 2006 with the support of the Minister of Industry, provincial and territorial ministers responsible for internal trade agreed to complete this work.
Small Business Competitiveness
- The Policy Sector is also committed to improving the competitiveness of small businesses by measuring and reducing their paperwork burden. Activities in 2006-07 focused on measuring the compliance burden on businesses. Preliminary findings, however, demonstrate that progress toward this outcome has been slow. Industry Canada's Small Business Policy Branch published the first Survey
Briefing for the Survey of Regulatory Compliance Costs in November 2006. Key findings included the fact that only a very small proportion of Canadian businesses (3 percent) perceive a decrease in the costs of complying with regulation, despite numerous efforts by governments to reduce the burden of paperwork. Most businesses also perceive an increased cost of complying with
regulation, owing principally to the growing complexity of compliance. Industry Canada actively worked to reduce the cost of compliance through a number of initiatives to streamline client interaction, including e-filing, updating of rules and requirements, and simplifying forms.
| Policy Sector – Marketplace | 2006-07 | ||
|---|---|---|---|
| Planned Spending and Resources | Total Authorities as Per Public Accounts | Actual Spending and Resources | |
| Financial Resources | $9.0 million | $7.4 million | $6.2 million |
| Human Resources | 86 FTEs | - | 71 FTEs |
2.1.2 Program Activity: Operations Sector – Marketplace
Operations Sector – Marketplace is responsible for developing instruments and for compliance with the marketplace frameworks to foster competitive conditions that will attract investment, encourage innovation and protect the public interest.
Sub-Program Activities: Operations Sector – Marketplace is delivered via four sub-program activities:
- Regional Operations – Spectrum
- Measurement Canada
- Office of the Superintendent of Bankruptcy
- Corporations Canada
Marketplace fairness, integrity and efficiency are protected through regulation and promotion in the areas of insolvency, weights and measures, federal incorporation, and spectrum management.
Industry Canada measures progress toward this expected result, in part, through the following indicators:
| Indicators | Progress in 2006-07 |
|---|---|
| Public confidence in the insolvency system |
Level of Trustee Compliance
|
| Feedback from reviews of sectors where measurement forms the basis for financial transactions | Extensive stakeholder consultations with manufacturers, businesses, consumers and other government departments resulted in the establishment of consensus-based recommendations on how measurement accuracy should be achieved and monitored in the fisheries and forestry sectors. |
| Year-over-year level of federal incorporations | 21,247 new federal incorporations were issued under the Canada Business Corporations Act in 2006-07, an increase of 372 incorporations compared with 2005-06; 84 percent of these incorporations were completed online. |
| Year-over-year number of radiocommunications investigations conducted and/or resolved by the Regions |
|
Industry Canada committed to the following for 2006-07:
- Modernize its framework instruments and their operations through the work of marketplace service organizations (MSOs) (i.e., Measurement Canada, Corporations Canada, the Office of the Superintendent of Bankruptcy).
- Ensure that the marketplace is responsive to stakeholder needs.
- Be an active participant in the Government of Canada's effort to reduce the regulatory burden.
- The Office of the Superintendent of Bankruptcy was to complete another phase of its e-filing system.
- Corporations Canada was to prepare for a parliamentary review of the Canada Business Corporations Act.
Results Achieved
- Operations Sector business units have ensured a fair, efficient and competitive marketplace in the areas of insolvency, federal incorporation, weights and measures, and spectrum management. They have done so through the use of new and existing key framework instruments such as regulations, legislation, policies and procedures.
- Departmental framework instruments and their operations have been modernized through the work of the MSOs. Several forms under the Bankruptcy and Insolvency Act were modified to facilitate electronic transactions in the solvency system. Corporations Canada streamlined the forms used to apply for amendments or revivals
of a corporation governed by the Canada Business Corporations Act to reduce the number of rejected applications. Measurement Canada signed onto the International Organization for Legal Metrology's Mutual Acceptance Arrangement (MAA) concerning the approval of non-automatic weighing devices. By signing this MAA, Measurement Canada will now be able to accept test results from other countries when approving these devices for use in the Canadian marketplace. Additional results achieved by each of the MSOs are detailed in the following.
Measurement Canada
- In 2006-07, Measurement Canada began the pre-consultation phase of a major legislative review of the Weights and Measures Act and the Electricity and Gas Inspections Act. Consultations will soon take place with various stakeholders, including manufacturers of measuring instruments, businesses, consumers, utilities and other key parties to obtain views on modifying the
Acts.
- Following extensive consultations, stakeholder consensus-based recommendations on how measurement accuracy will be achieved and monitored in the fisheries and forestry sectors were developed and accepted by Measurement Canada. Implementation of the recommendations will commence in 2007-08.
- Measurement Canada proceeded with the implementation of modifications to program and service delivery (including the use of authorized service providers and mutual acceptance arrangements to facilitate the delivery of legislated services) to ensure continued marketplace measurement accuracy at reasonable cost. In 2006-07, 21 companies received authorization to perform inspections on
behalf of Measurement Canada. As well, Measurement Canada signed an international mutual acceptance arrangement for non-automatic weighing devices and load cells.
Corporations Canada
- Corporations Canada successfully implemented the change to the annual return filing period for corporations governed by the Canada Business Corporations Act, which came into effect July 1, 2006. To minimize confusion, Corporations Canada's communications strategy included developing an online annual return calculator. Many corporations found this very helpful in determining
when to file their annual return.
- To increase compliance of federally incorporated businesses that file annual returns, Corporations Canada offered them the option of receiving a reminder notice by email. The response was positive, with over 40 percent of active corporations opting to do so. The initiative also increased online filings of the annual returns from less than 65 percent to almost
80 percent.
- Reliable and up-to-date information regarding corporations is important to the functioning of the marketplace. Corporations Canada plays a role by providing access to data it collects on federal corporations. Users of this data were surveyed. The results showed that 100 percent of respondents found the data to be reliable (83 percent felt it was highly reliable, and
17 percent found it to be reliable). The feedback validated Corporations Canada's efforts to ensure that the data collected is reliable and up to date.
- The Province of Saskatchewan has joined the provinces of Ontario, Nova Scotia, and Newfoundland and Labrador in participating in the Joint Online Registration Program (JORP). This program, originally proposed and established by Corporations Canada with three provincial partners as a government online initiative, allows Canadian
businesses that have chosen to federally incorporate their companies online to meet the additional provincial business registration requirements (in any) of the participating provinces. Approximately 8,000 new corporations used JORP to meet their provincial filing requirement. To prepare for the parliamentary five-year review of the
Canada Business Corporations Act, Corporations Canada conducted research and outlined a report on the provisions of the Act based on issues raised by stakeholders. Corporations Canada is ready to provide this information to Parliament when it begins the review.
Office of the Superintendent of Bankruptcy
- The marketplace service organizations undertook a preliminary investigation of possible paperwork reduction opportunities, and Corporations Canada and the Office of the Superintendent of Bankruptcy Canada (OSB) participated in the pilot testing of a proposed accounting methodology.
- In January 2007, the OSB made its e-filing system mandatory for consumer bankruptcies and proposals. As of March 31, 2007, the percentage of trustees using the e-filing system was 97 percent, showing trustees are using the system fully. Building on the work completed to date as part of the
organizational restructuring, the OSB continued to focus on moving to a proactive, risk-based approach for trustee and debtor compliance activities, improving client services, and improving outreach capacity to stakeholders, clients and partners. The OSB also continued to enhance compliance with, and enforcement of, marketplace rules and regulations by developing a Trustee Risk Assessment Module.
Spectrum/Telecommunications
- Through the Spectrum/Telecom Program, Industry Canada's regional offices are responsible for ensuring that its clients, including Canadian citizens, private industry and public sector organizations, have access to a quality radio frequency spectrum within Canada's regulatory framework. To do so, regional program delivery focuses on three types of activities:
- First, the regional offices provide clients with timely access to the radio frequency spectrum. In 2006-07, the Department approved 25,163 licensing requests, 97 percent of which were answered within established service standards. An increasing number of clients submitted their requests for radio authorizations using the Department's electronic
services, which help clients access the radio frequency spectrum more quickly.
- Second, the Department is responsible for ensuring compliance by users of the radio frequency spectrum with the Radiocommunication Act and Radiocommunication Regulations. Each year, Industry Canada's regional offices conduct a variety of radiocommunications investigations across the country. These investigations ensure compliance with legislation, regulations,
policies and licence conditions, thereby ensuring a quality radio frequency spectrum for all our clients. In 2006-07, the regional offices conducted 776 investigations into complaints of harmful interference on licensed radiocommunications systems. The regional offices also completed a licence compliance survey that showed that 70 percent of stations that were inspected were in
compliance with their authorized parameters.
- Third, the regional offices influence the Department's regulatory framework by representing the needs of clients and by presenting regional perspectives in the development of spectrum policies and regulations. In 2006-07, Industry Canada's regional offices participated in the development of policy for installing radiocommunications and broadcast antenna structures, as well as the
policy for the use of 700-MHz spectrum for public safety systems and to provide broadband Internet access to remote and rural communities.
- First, the regional offices provide clients with timely access to the radio frequency spectrum. In 2006-07, the Department approved 25,163 licensing requests, 97 percent of which were answered within established service standards. An increasing number of clients submitted their requests for radio authorizations using the Department's electronic
services, which help clients access the radio frequency spectrum more quickly.
| Operations Sector – Marketplace | 2006-07 | ||
|---|---|---|---|
| Planned Spending and Resources | Total Authorities as Per Public Accounts | Actual Spending and Resources | |
| Financial Resources | $87.0 million | $87.5 million | $86.5 million |
| Human Resources | 1,357 FTEs | - | 1,258 FTEs |
2.1.3 Program Activity: Spectrum, Information Technologies and Telecommunications Sector – Marketplace
Spectrum, Information Technologies and Telecommunications (SITT) Sector – Marketplace is responsible for developing regulations, policies, procedures and standards that govern Canada's spectrum and telecommunications industries and the digital economy. It ensures a modern telecommunications policy and regulatory framework, and effectively manages the radio frequency spectrum in the public interest to meet the communications needs of all Canadians and to encourage the adoption of enabling technologies across the economy.
Sub-Program Activities: SITT Sector – Marketplace is delivered via two sub-program activities:
- Spectrum/Telecom Program
- Electronic Commerce Branch
A policy and regulatory framework to govern Canada's radiocommunications and telecommunications infrastructure in support of Canadian marketplace requirements, and to shape the digital economy
Industry Canada measures progress toward this expected result, in part, through the following indicator:
| Indicator | Progress in 2006-07 |
|---|---|
| Degree of client satisfaction in the Canadian marketplace with the current policy and regulatory framework | Continuing the renewal of legislation and the regulatory framework, including issuing the first-ever policy direction to the Canadian Radio-television and Telecommunications Commission (CRTC) under the Telecommunications Act. The policy direction to the CRTC requires it to rely on market forces to the maximum extent feasible. Overall, feedback from industry and media was positive. |
Industry Canada committed to the following for 2006-07:
- Publish a renewed Spectrum Policy Framework to oversee the Canadian Spectrum Management Program.
- Follow up on the Canadian Wireless Telecommunications Association's implementation plan for wireless number portability.
- Ensure that Canada is at the forefront in terms of new telecommunications services and equipment.
- Assess the impact of restrictions on foreign investment in telecommunications.
- Update the Department's antenna tower-siting procedures.
- Develop the government's telecommunications policy agenda.
- Ensure that Canadian communications networks are safe and secure.
Results Achieved
Spectrum Management
- One of Industry Canada's key objectives is to ensure that radio frequency spectrum – a finite public resource used by wireless carriers to provide a growing range of telecommunications services and for broadcasting, public security, emergency, and private and commercial uses – is managed in a fair, efficient and effective manner.
- The publication of a renewed Spectrum Policy Framework for Canada, which is the policy foundation for the Canadian Spectrum Management Program, was announced in late spring 2007. The new framework is a timely updating and modernization of the existing document that communicates the underlying principles that the Department and the Minister will rely upon in exercising their authority
under the Radiocommunication Act to manage the radio frequency spectrum resource in Canada. The new framework will be streamlined, shortened, updated and reoriented to reflect current practices and current government policy.
- Industry Canada launched a licensing initiative in July 2006 to authorize the development of Canadian satellite communications services that will increase and improve broadcasting and telecommunications services to Canadian entrepreneurs and consumers. The consultations process was completed in January 2007, and the Department provided a recommendation to the Minister of
Industry on the assignment of the licences in spring 2007.
- Another priority action in the area of spectrum management was the launch of a public consultation on a framework to auction spectrum in the 2-GHz range, including spectrum for advanced wireless services. The notice was published on February 24, 2007, in the Canada Gazette. This consultation is the first step in a process leading to an
auction of spectrum licences, expected in early 2008. A total of 105 MHz of spectrum will be made available.
Wireless Number Portability
- The availability of wireless number portability (WNP) in all major urban communities across the country was announced on March 14, 2007. WNP will enable wireless phone service subscribers to change service providers and keep their existing phone numbers. It will also allow
consumers to move a phone number from a wireline phone to a wireless phone and vice versa.
Antenna Siting
- The Department has reviewed the final report of the National Antenna Tower Policy Review and is in the process of drafting an update to its procedures. In finalizing these procedures, the Department is giving consideration to the report's recommendations as well as to the comments received through public consultation. The approval and implementation of the updated procedures will take
place in the 2007-08 reporting period.
Telecommunications Policy
- An assessment and analysis of the Telecommunications Policy Review Panel report proposal on foreign investment restrictions in the telecommunications sector was conducted by Industry Canada, leading to ministerial advice on this matter.
- The Department also has a key role in representing Canada's telecommunications and spectrum interests internationally. In fiscal year 2006-07, Industry Canada successfully achieved all of the Canadian objectives at the International Telecommunication Union (ITU) Plenipotentiary Conference. The Canadian objectives were
developed in consultation with Canadian industry and other government departments, and achieved through skilful negotiation at the conference. Canadian objectives included:
- the re-election of Canada to the ITU Governing Council;
- the election of a Canadian candidate to the Radio Regulations Board, giving Canada influence over the adjudication of issues and disputes concerning the Radiocommunication Regulations;
- securing an agreement on a range of measures to make the ITU's budgeting and management functions more effective and transparent; and
- the successful adoption of Canadian views on issues guiding the work of the ITU and its sectors for the next four years, including preparations for the 2007 World Radiocommunication Conference and Radiocommunication Assembly.
- the re-election of Canada to the ITU Governing Council;
- Industry Canada also plays an important role in shaping the digital economy. Industry Canada develops effective legal and policy frameworks that promote the growth of the online marketplace in Canada and the conduct of e-commerce and e-business across all sectors of the economy. According to recent Statistics Canada data (Survey of Electronic Commerce and Technology in
Canada – SECT, 2006), growth in the value of online sales averaged 50 percent a year since 2001. The value of the Canadian online market in 2006 was approximately $50 billion. These results demonstrate that the Department's work in this area – including effective privacy
policies, cooperation with the private sector in dealing with spam and related threats through the Task Force on Spam, and support for emerging e-business platforms – has been effective in promoting the growth of the online marketplace.
Communications Security
- In support of shaping the digital economy, Industry Canada also works with its partners to improve confidence in the marketplace by protecting individual privacy and curbing threats to the Internet and online markets. Key actions led by the Department in 2006-07 included:
- Initiating the mandatory review of the Personal Information Protection and Electronic Documents Act (PIPEDA). The Department made representations to the parliamentary committee reviewing PIPEDA.
PIPEDA sets rules for the collection, use and disclosure of personal information used for commercial purposes, requiring organizations to take measures to protect the privacy of Canadians when handling personal data.
- The development of the Stop Spam Alliance, an international association of policy and regulatory bodies that have agreed to work together to strengthen laws and enforcement cooperation to deal with spam and related threats to the Internet and the online marketplace. The Alliance and other forms of trans-border cooperation will help to make domestic laws and policies in Canada and
other countries more effective in addressing the problem of spam.
- Initiating the mandatory review of the Personal Information Protection and Electronic Documents Act (PIPEDA). The Department made representations to the parliamentary committee reviewing PIPEDA.
PIPEDA sets rules for the collection, use and disclosure of personal information used for commercial purposes, requiring organizations to take measures to protect the privacy of Canadians when handling personal data.
| SITT Sector – Marketplace | 2006-07 | ||
|---|---|---|---|
| Planned Spending and Resources | Total Authorities as Per Public Accounts | Actual Spending and Resources | |
| Financial Resources | $59.9 million | $68.9 million | $67.0 million |
| Human Resources | 375 FTEs | - | 342 FTEs |
2.1.4 Program Activity: Office of Consumer Affairs – Marketplace
The Office of Consumer Affairs (OCA) plays a role in developing policies and non-regulatory instruments for consumer protection and in conducting consumer research, through working with other departments and governments, consumer organizations, industry and academia.
Sub-Program Activities: OCA's program activity is delivered via two sub-program activities:
- Consumer Policy
- Consumer Information and Coordination
Strengthened responses to consumer issues
Industry Canada measures progress toward this expected result, in part, through the following indicator:
| Indicator | Progress in 2006-07 |
|---|---|
| Number of initiatives responding to consumer issues with active engagement of the OCA | 30 initiatives responding to consumer issues with active engagement of the OCA |
Industry Canada committed to the following for 2006-07:
- Explore appropriate responses to the rapid growth of the payday lending industry and the issue of identity theft.
- Explore the following areas of internal policy research: virtual consumers, sustainable consumption and vulnerable consumers.
- Continue to seek cost-effective non-regulatory approaches to address consumer marketplace issues such as standards, guides and codes of conduct.
- Continue to enhance its consumer information website and its major tools to make it as effective as possible.
- Address the recommendations from an evaluation in 2004-05 regarding the Management of the Contributions Program for Non-Profit Consumer and Voluntary Organizations.
Results Achieved
Payday Lending and Identity Theft
- The OCA worked on intergovernmental projects to address common concerns regarding payday lending, identity theft and credit reporting. A joint identity theft consumer information campaign directed at law enforcement agencies was undertaken whereby over 20,000 copies of Identity Theft: A Checklist were distributed across
Canada. This publication is available at the Consumer Measures Committee website.
- Regarding payday lending, Bill C-26, An Act to amend the Criminal Code (criminal interest rate), received royal assent in May 2007. The amendments include specific provisions to address payday lending and enable provinces and territories to set limits on the cost of borrowing and regulate the business practices of payday lenders within their jurisdictions. The Act is the
culmination of several years of collaborative work among the Department of Justice, the OCA, and provincial and territorial governments.
Internal Policy Research
- The OCA has focused its internal policy research on vulnerable, virtual and sustainable consumers. Internal research on vulnerable consumers focused on consumer debt trends in Canada and supports continuing federal-provincial-territorial policy work on the alternative consumer credit market. Internal research on the virtual consumer
was published in the 2006 fall publication of the Consumer Trends Update, available on the OCA's home website. The publication's research article "The Expansion of Cellphone Services" details the important consumer cellphone services market. Finally, OCA policy analysts
initiated a broad scan of federal policies that affect sustainable consumption choices by Canadians; this work will continue into the next fiscal year and will support domestic and international policy development in this area.
Consumer Issues and Information
- The OCA continued to enhance and add to its array of consumer information tools. The 2007 edition of the Canadian Consumer Handbook was released and included new consumer information specifically tailored for seniors and youth. This publication is available at the Consumer Measures Committee
website. The OCA also released Cellphone Choices for Canadians: A Checklist, and Cellphone Choices for Canadians: A Guide. These publications are available online and in print. Online resources operated by OCA were enhanced to improve the ease with which consumers can
find useful information from a variety of governmental and non-governmental sources. Navigation was improved between the OCA home site and the multi-partner Canadian Consumer Information Gateway, which provides integrated access to federal, provincial, territorial and non-governmental
organization sources of consumer information.
- One of the main tools on the partnering site, the Complaint Courier, was updated to improve its performance for consumers and to add additional complaint types to reflect emerging consumer issues. During 2006-07, the number of visitors to the OCA's websites averaged 66,875 per month. Compared with the previous fiscal year, there was a
67-percent increase in the number of visitors to the Canadian Consumer Information Gateway site alone. The OCA also developed and implemented successful strategies for reaching a greater number of consumers in a cost-efficient manner through the media, with particular emphasis on disseminating cellphone advice and tips for preventing
identity theft. A direct mail campaign to 1,750 police stations across Canada was undertaken, which resulted in the distribution of more than 30,000 identity theft checklists. Media stories prompted the distribution of more than 35,000 copies of the cellphone checklist.
Contributions Program
- OCA's Contributions Program provides consumer and voluntary organizations with the means to produce high-quality and timely research on consumer issues that affect the marketplace. Improvements to the program resulting from the 2004-05 evaluation include greater transparency in the selection process, improved assessment procedures in
project proposals to ensure greater consistency and comparability in assessment outcomes, and better access to project summaries via OCA's online Consumer Policy Research Database.
- During 2006-07, the Contributions Program funded 30 research projects designed to help advance knowledge on current and emerging consumer issues and to assist in consumer policy development that affects a wide range of issues, such as consumer laws and their application, consumers and the environment, consumer issues in the Far North, and the readability of food labels. Information on
these projects can be found on the OCA website.
- Under the Contributions Program, four organizations applied for and received funding to improve their capacity to carry out consumer research and raise consumer issues in various public policy and media forums. The funding allowed an environmental organization to incorporate sustainable consumption into their organizational focus; helped a coalition of consumer groups develop common,
joint-action policy projects; improved Internet access to, and increased circulation for, an independent consumer magazine; and allowed a consumer organization to revise and improve its business and marketing plan.
| Office of Consumer Affairs – Marketplace | 2006-07 | ||
|---|---|---|---|
| Planned Spending and Resources | Total Authorities as Per Public Accounts | Actual Spending and Resources | |
| Financial Resources | $5.6 million | $6.0 million | $5.9 million |
| Human Resources | 23 FTEs | - | 23 FTEs |
2.1.5 Program Activity: Competition Bureau – Marketplace
The Competition Bureau is responsible for ensuring development of, and compliance with, marketplace frameworks with respect to competition.
Sub-Program Activities: Competition Bureau – Marketplace is delivered via three sub-program activities:
- Enforcement
- Framework Policy and Advocacy
- Services
Compliance with legislation under the Competition Bureau's jurisdiction
Industry Canada measures progress toward this expected result, in part, through the following indicator:
| Indicator | Progress in 2006-07 |
|---|---|
| Extent to which target groups comply with legislation under the Bureau's jurisdiction | The Fair Business Practices Branch identified more than 150 potentially problematic websites that promote bogus and misleading diabetes schemes. Notices were sent to the most problematic sites, and of the Canadian firms contacted, 80 percent have complied by removing misleading claims. |
Industry Canada committed to the following for 2006-07:
- Contribute to policy development.
- Be a competition advocate in the telecommunications and health sectors.
- Continue to work on modernizing the Competition Act.
- Combat fraudulent mass marketing, including telemarketing fraud and deceptive mass mail.
- Promote fraud awareness among consumers and businesses.
- Pursue enforcement action when businesses do not respond to the Bureau's concerns.
- Fight domestic and international cartels.
- Review mergers and acquisitions.
Results Achieved
Policy Development
- In 2006-07, the deregulation of the telecommunications industry was one of the Competition Bureau's top priorities. The Bureau provided analysis and advice regarding some key government policy decisions and documents that were released during the fiscal year. These include:
- the Telecom Policy Review Panel's report
- the Minister's Policy Direction calling for greater reliance on market forces
- the Minister's Order varying the CRTC's forbearance decision
- the introduction of Bill C-41, which allowed for monetary penalties to be brought against firms that abused their dominance in the telecommunications sector; and
- the House of Commons Standing Committee on Industry, Science and Technology's (INDU's) study on the deregulation of the telecommunications sector.
- the Telecom Policy Review Panel's report
- For each of the above initiatives, the Bureau provided competition analysis and advice regarding policy issues, either through public consultations or within the Department. The Bureau's input is reflected in the government's final policy decisions.
- To ease the transition for participants in the telecommunications industry from regulation to reliance on market forces and oversight under the Competition Act, the Bureau released a draft bulletin on its approach to the enforcement of the abuse of dominance provisions in the telecom sector.
The bulletin was developed through a joint CRTC/Bureau working group and included comments received from industry stakeholders. In addition, the Bureau provided comments to the CRTC on the competition issues raised in its
ongoing proceedings to review the regulatory framework for wholesale telecommunications services and the definition of essential facilities. The Bureau will continue to share its competition analysis and economic expertise with the CRTC throughout the remainder of this important public
proceeding.
Competition Advocacy
- As a result of the Bureau's advocacy in the health sector and with self-regulated professions, the Government of Alberta passed a new regulation that removed the requirement for dental hygienists to work under the supervision of a dentist. As a result, dental hygienists in Alberta will now be free to offer a number of services, including scaling and root planing, directly to clients. The
new regulation allows dental hygienists and dentists to compete in the provision of dental hygiene services. The ability of dental hygienists to self-initiate, or provide services autonomously, without being restricted by their competitors, will likely increase access to dental hygiene services and decrease prices for Albertans. For more information consult the news article Competition Bureau supports Alberta decision to allow greater competition in dental hygiene services.
Fraud Prevention and Awareness
- As Chair of the Fraud Prevention Forum, the Competition Bureau works closely with more than 75 public and private partners to raise awareness of the dangers of fraud, and to educate the public on how to "recognize it, report it and stop it." During Fraud Prevention Month, the Bureau provided consumers with information on many fraudulent activities they should be aware of, including bogus
weight-loss schemes, cure-all products, products that claim amazing health effects, phoney employment opportunities and fake office supply scams.
Competition Enforcement
- Promoting fair and accurate information in the marketplace is an ongoing priority of the Bureau. In pursuit of this priority, a key accomplishment of the Bureau in 2006-07 was to register a consent agreement stating that Canadian clothing manufacturer Grafton-Fraser Inc. had violated a provision of the Competition Act. Through an investigation, the Bureau concluded that
Grafton-Fraser had significantly inflated the regular price of certain garments sold in its stores, resulting in an overstatement of consumer savings when these garments were on sale. For more information, consult the news article Grafton-Fraser pays $1.2 million to settle misleading advertising case
with Competition Bureau.
- The Bureau has transferred resources to its regional offices across Canada to fight domestic cartels closer to the scenes of the crimes. It is building its investigative skills, establishing strong local contacts and raising awareness. Over the past year alone, the regional offices conducted 50 seminars on how to prevent and detect bid-rigging.
- Although there are no redeeming pro-competitive virtues associated with cartels, the situation is significantly more nuanced with respect to reviewing mergers. The Bureau always seeks to find the balance between guarding against anti-competitive mergers and imposing undue burdens on the positive transactions. The Bureau published several technical backgrounders and bulletins in 2006-07 to
facilitate business decisions and ensure transparency and predictability with the business community.
| Competition Bureau – Marketplace | 2006-07 | ||
|---|---|---|---|
| Planned Spending and Resources | Total Authorities as Per Public Accounts | Actual Spending and Resources | |
| Financial Resources | $48.1 million | $49.3 million | $42.1 million |
| Human Resources | 406 FTEs | - | 399 FTEs |
2.1.6 Program Activity: Canadian Intellectual Property Office – Marketplace
The Canadian Intellectual Property Office (CIPO), a special operating agency, is responsible for administering Canada's system of intellectual property (IP) rights, namely patents, trademarks, copyrights, industrial designs and integrated circuit topographies. In addition to granting and registering IP rights, CIPO disseminates information related to these rights to business, educational institutions and Canadians in general. It operates under a revolving fund regime and aims to accelerate Canada's economic development.
Delivery of quality and timely intellectual property products and services, and increase awareness and use of intellectual property
Industry Canada measures progress toward this expected result, in part, through the following indicators:
| Indicators | Progress in 2006-07 |
|---|---|
| Turnaround times for: | |
|
|
|
|
|
|
|
|
| Percentage of increased awareness and use of intellectual property (small and medium-sized enterprises segment) | 36 percent are familiar with intellectual property (baseline) |
Industry Canada committed to the following for 2006-07:
- Undertake further modernization of the intellectual property regime to encourage creativity and innovation and to promote affordable access to new knowledge for Canadians.
Results Achieved
Modernization of the Intellectual Property Regime
- In 2006-07, CIPO put forward proposed amendments to five intellectual property regulations to ensure that Canada's intellectual property regime is more user-friendly, cost-effective and responsive to the needs of Canadian universities and businesses. The main purpose of the regulatory changes was to clarify the patent regime
for small entities (i.e., entities employing 50 or fewer employees, or a university) while providing a relief mechanism for regular-sized entities that mistakenly pay fees at the small entity level. The amendments also improved the intellectual property regime by simplifying procedures and reducing processing times and costs, in keeping with the legislative principles of Smart Regulation and
the Paperwork Burden Reduction Initiative. These amendments come into force in 2007-08.
Additional Achievements
Service Improvement
In 2006-07, CIPO continued to focus on three main service improvement areas identified in CIPO's 2005 National Client Survey: communications, accessibility and turnaround times. Achievements in these three areas are detailed below:
- CIPO expanded corporate vehicles for communicating with clients and stakeholders, including adding a new client service page to its website and providing regular electronic news updates to keep clients informed of new initiative and service enhancements. The news updates provide valuable information to clients, as
demonstrated by a significant increase in the number of subscribers to CIPO's newsletter.
- To improve accessibility, CIPO implemented a toll-free number to improve services to clients across Canada. CIPO also improved access to its services by expanding the information holdings and functionality of its website with the goal of making more services
available online 24/7.
- In the patents and industrial design areas, continued progress was made in reducing turnaround times and inventory levels. Recruitment and training are ongoing strategies to attain shorter turnaround times in all intellectual property areas. Efforts to deliver quality and timely intellectual property rights serve a key role in enhancing Canada's climate of innovation.
| Canadian Intellectual Property Office – Marketplace | 2006-07 | ||
|---|---|---|---|
| Planned Spending and Resources | Total Authorities as Per Public Accounts | Actual Spending and Resources | |
| Financial Resources | ($7.7 million)* | $88.7 million | ($28.5 million)* |
| Human Resources | 951 FTEs | - | 897 FTEs |
* For more detail on CIPO's financial information, see Section 3, Table 3: Voted and Statutory Items and Table 7: Canadian Intellectual Property Office Revolving Fund.
2.2 Strategic Outcome: An Innovative Economy
The strategic outcome of an innovative economy refers to the development of an economy that ensures global competitiveness by supporting the creation of knowledge and the effective translation of this knowledge into new products and processes. This is vital, since an enhanced quality of life, better-paying jobs and the capacity to support social goals require an innovative and competitive economy. In today's knowledge-based economy, innovation is a key driving force for the creation of wealth and economic growth for Canadians. Industry Canada conducts a variety of activities to contribute to this strategic outcome, such as promoting the development, application and diffusion of new technologies, and assisting in harnessing the social and economic benefits of research and development.
More specifically, in fiscal year 2006-07 Industry Canada was responsible for bringing forward several policy initiatives that promote research and development in key innovation areas, including commercialization, health sciences, the environment and many more. Industry Canada championed for and successfully ensured that money was included in Budget 2007 for these initiatives. The Government of Canada also developed a science and technology (S&T) strategy – Mobilizing Science and Technology to Canada's Advantage – which highlights the importance of S&T to Canada and provides a framework to guide federal government decision making in support of S&T over the coming years. The S&T Strategy aims to strengthen Canada's position as an innovation leader by creating a business environment that is conducive to innovation, while sustaining Canada's research excellence. Furthermore, Industry Canada has been actively engaged in the development of Canada's hydrogen and fuel cell industry and completed a comprehensive national hydrogen and fuel cell framework, which offers a long-term vision for sector commercialization and outlines clear sector opportunities and priorities.
Additional accomplishments in 2006-07 include renewed support for the operation and development of CANARIE's advanced research network – Canada's not-for-profit advanced Internet development organization – in order to promote further progress in Canada's intelligent systems and advanced robotic industries. In 2006-07, Industry Canada also concluded a major demonstration of an experimental tactical communications network that highlights new capabilities that are possible with the use of advanced wireless and network technologies. Such demonstration projects allow other departments, such as the Department of National Defence, to make better-informed decisions regarding communications-related procurements.
The following section provides further detail on the ways in which Industry Canada is contributing to an innovative economy. Additional information can be found online at Section 5.2.2.
This strategic outcome is delivered through five program activities:
- Policy Sector – S&T and Innovation
- Industry Sector – S&T and Innovation
- Spectrum, Information Technologies and Telecommunications Sector – S&T and Innovation
- Communications Research Centre Canada – S&T and Innovation
- Technology Partnerships Canada – S&T and Innovation
Analysis by Program Activity
2.2.1 Program Activity: Policy Sector – Science and Technology and Innovation
Innovation, science and technology (S&T) are key drivers of economic growth that support the long-term productivity and competitiveness of the Canadian economy. S&T also underpins the government's ability to address public policy issues that matter to Canadians, such as health care, the environment and sustainable energy.
Sub-Program Activities: Policy Sector – S&T and Innovation is delivered via four sub-program activities and six sub-sub-program activities:
- Advisory Council on Science and Technology Secretariat
- Strategic Policy Branch
- Micro-Economic Policy Analysis Branch
- Innovation Policy Branch
- Canadian Institute for Advanced Research
- Pierre Elliott Trudeau Foundation
- Canada Foundation for Innovation
- Canada-Israel Industrial Research and Development Foundation (this program has been moved to Foreign Affairs and International Trade Canada)
- Council of Canadian Academies
- Pilot Fund for the Commercialization of University and Federal Lab Research
Development and coordination of policy frameworks in support of an innovative economy
Industry Canada measures progress toward this expected result, in part, through the following indicator:
| Indicator | Progress in 2006-07 |
|---|---|
| Policy proposals that are brought forward to reinforce the elements that advance an innovative economy and reflect a coordinated approach based on tools available across the sector |
The Policy Sector brought forward several proposals to advance an innovative economy and championed their inclusion in the budget. Budget 2007 invested approximately $1.9 billion in S&T, including the following:
|
Industry Canada committed to the following for 2006-07:
- Develop an S&T Strategy that will encompass a broad range of government support for research.
- Continue to conduct research and analysis on the issues of interest to Canadian small businesses.
- Undertake a review of the accountability and value for money of the granting councils' activities.
Results Achieved
S&T Strategy
- In 2006-07, the Government of Canada developed its S&T Strategy – Mobilizing Science and Technology to Canada's Advantage – which highlights the importance of S&T to Canada and provides a framework to guide federal government decision making
in support of S&T over the coming years. The S&T Strategy will aim to strengthen Canada's position as an innovation leader by creating a business environment that is conducive to innovation while sustaining Canada's research excellence.
- To achieve this goal, the Strategy sets out three key advantages distinct to S&T: an Entrepreneurial Advantage to translate knowledge into commercial applications that generate wealth for Canadians; a Knowledge Advantage to position Canada as a leader in generating new ideas and innovations; and a People
Advantage to make Canada a magnet for highly skilled people and create an economy with the best educated, most skilled and most flexible workforce in the world. The government signalled its commitment to the S&T Strategy by announcing $1.9 billion in new resources in Budget 2007 to support S&T initiatives.
Research and Analysis
- Research undertaken during 2006-07 included case studies of research and development (R&D) and commercialization that highlighted the challenges of collaborative innovation efforts such as attracting key personnel and financing and anticipating customer needs. Research and stakeholder analysis were also conducted on the supply of
risk capital in Canada. This identified a number of challenges, including tax barriers that impede access to sources of foreign capital by Canadian firms. This work supported the government's commitment to update the Canada-U.S. Tax Treaty to remove barriers. The research has also provided an indication of the magnitude of Canadian informal investment,
and explored reasons for Canada's relatively low returns on risk capital investments.
Review of Granting Councils
- In September 2006, pursuant to a commitment in the May 2006 Budget, Industry Canada commissioned a review of Canada's research granting councils. Its focus was on two of the councils – the Social Sciences and Humanities Research Council (SSHRC) and the Natural Sciences and Engineering
Research Council (NSERC). The Canadian Institutes of Health Research (CIHR) was not included, however, as CIHR recently went through a statutory five-year review by an international
panel of experts. A key finding of the evaluation was that the research funded by SSHRC and NSERC represents an essential and increasingly important contribution to almost every dimension of Canada's national life, and notably to the growth of
an internationally competitive economy and a strong, diverse society.
| Policy Sector – S&T and Innovation | 2006-07 | ||
|---|---|---|---|
| Planned Spending and Resources | Total Authorities as Per Public Accounts | Actual Spending and Resources | |
| Financial Resources | $46.2 million | $11.5 million | $10.6 million |
| Human Resources | 76 FTEs | - | 83 FTEs |
2.2.2 Program Activity: Industry Sector – Science and Technology and Innovation
Canada's prosperity depends increasingly on its ability to put knowledge to work. As the centre of analysis and knowledge on industrial sectors, the Industry Sector applies its expertise in the Canadian business landscape to enhance government decision making and industry development activities, and to help create conditions in which Canada exploits its knowledge. Several activities were undertaken in 2006-07 to create conditions leading to increased R&D and innovation, thereby enhancing Canada's knowledge advantage.
Sub-Program Activities: Industry Sector – Science and Technology and Innovation is delivered via eight sub-program activities and two sub-sub-program activities:
- Manufacturing Industries Branch
- Energy and Environmental Industries Branch
- Hydrogen Economy
- Service Industries Branch
- Aerospace, Defence and Marine Branch
- Life Sciences Branch
- Genome Canada
- Industrial Analysis and Sector Services Branch
- Automotive and Industrial Materials Branch
- Canadian Biotechnology Secretariat
A stronger knowledge-based economy in all industrial sectors
Industry Canada measures progress toward this expected result, in part, through the following indicator:
| Indicator | Progress in 2006-07 |
|---|---|
| R&D expenditures by industry in selected manufacturing and service sectors | All industries' Business Expenditure on Research and Development (BERD): $14.85 billion for 2006, up 1.3 percent over 2005 |
Industry Canada committed to the following for 2006-07:
- Enhance the research and analytic capabilities of the Department in order to identify challenges and opportunities that affect the manufacturing sector.
- Review the Industrial and Regional Benefits Policy and other initiatives to improve federal government procurement decisions.
- Deliver on the Government of Canada's sustainable development commitments with the development of Sustainable Development Strategy IV.
- Complete development of Technology Roadmaps.
- Examine the most appropriate role for Genome Canada and other agencies in providing support for genomics research.
- Ensure that the renewable energy sector has continued opportunities for development.
- Ensure that the federal government's commercialization strategy reflects the interests of Canadian Industry.
Results Achieved
Manufacturing
- The Industry Sector provided leadership on a broad range of issues that affect the manufacturing sector, and worked with stakeholders to address policy issues raised by the Canadian Manufacturing Coalition, Canadian Manufacturers & Exporters and other industry experts. The Sector also developed indicators of manufacturing performance as well as information on sustainable manufacturing
practices, and led a manufacturing network that brought together organizations from across the federal government to strengthen the Government of Canada's capacity to analyze, review and improve public policy on issues that affect Canada's manufacturing sector.
- In 2006-07, Industry Sector promoted the adoption of lean and sustainable manufacturing principles and practices through its Internet-based Canadian Resource Guide to High Performance Manufacturing and through its outreach activities. The Sector partnered with Environment Canada and the
National Research Council to pilot test a "lean and clean" workshop, aimed at training lean practitioners and advocates. The Industry Sector also initiated the development of a review of lean performance metrics to benchmark operational excellence and best practices.
- To increase industry awareness of sustainable manufacturing practices, the Industry Sector published a workbook, Going for the Green: A Manufacturer's Guide to Lean and Green, which was developed by a Canadian expert on sustainable practices in cooperation with Environment Canada.
Government Procurement
- The Sector continued to assess, on an ongoing basis, the Industrial and Regional Benefits (IRBs) Policy, to ensure that it adapts to changes in the marketplace. For additional information, visit the Industrial and Regional Benefits Policy website.
- The Industry Sector enhanced the economic benefits to Canada of federal procurement decisions in areas of strategic industrial interest, such as the aerospace, defence and marine industries. IRBs enable innovations to come to market and enhance the competitiveness of Canadian firms by providing opportunities in contractor supply
chains. Unprecedented levels of IRBs will apply on the "Canada First" defence procurements that the government announced in areas such as the Medium Support Vehicle System Project (logistics trucks), medium- to heavy-lift helicopters, joint-support ships, and tactical and strategic air lift.
- The Industry Sector also worked with Public Works and Government Services Canada (PWGSC) through 2006-07 on several procurement-related initiatives, including co-sponsoring a workshop on small and medium-sized enterprises (SMEs), innovation and public
procurement. The workshop brought together departmental representatives involved in promoting innovation and PWGSC staff, and focused on the procurement process and, specifically, SMEs in that process. Next steps include engaging several industry sectors in
further workshops to better understand their concerns over, and perspective on, procurement and innovation.
Sustainable Development Strategy IV
- Industry Canada, along with 30 federal departments and agencies, tabled its fourth Sustainable Development Strategy (SDS IV) in Parliament on December 13, 2006. A number of activities contributed to the development of SDS IV, including an
internal issues scan, an external issues scan, a mid-term evaluation of SDS III (completed) and public consultations.
- SDS IV outlines Industry Canada's sustainable development priorities for 2006-2009 in order to achieve the following strategic outcomes: sustainability-driven technologies and commercialization; sustainability tools, practices, research and awareness; and sustainability practices and operations within Industry Canada.
Industry Canada's SDS IV supports a competitive Canadian economy by positioning the Department as a leader in supporting sustainable development technologies and practices for businesses and consumers. To access Industry Canada's SDS IV, visit the
Sustainable Development website.
Technology Roadmaps
- Industry Sector has achieved an internationally recognized level of expertise in the development of Technology Roadmaps (TRMs), with 26 completed to date. TRMs are strategic tools through which sectors can determine their technology and skills priorities 5 to 10 years into the future. They also
help identify collaborative R&D arrangements that are critical to the long-term competitiveness of Canadian industries.
- In partnership with private industry, the Sector developed or was involved in the development of five TRMs in 2006-07: aluminum transformation, the biopharmaceutical industry, the welding and joining industry, the language industry, and carbon dioxide capture and storage. For more information on TRMs, visit the Technology Roadmaps website.
- Through the interdepartmental Technology Roadmap Working Group, the Sector led strategic planning activities for sectoral competitiveness. The Sector also signed a Memorandum of Understanding with Human Resources and Social Development Canada (HRSDC), with a key deliverable being TRMs done with HRSDC's sector councils. This linkage of technology and skills improves both the productivity and competitiveness of Canadian companies.
Genome Canada
- A genomics review process was launched to examine the most appropriate role for Genome Canada and other agencies in providing support for genomics research. Budget 2005 committed to strengthening the environment for research in Canada by providing Genome Canada with an additional $165 million for research in genomics. With this investment,
Genome Canada launched a third competition, resulting in funding for 33 innovative research projects and sophisticated S&T platforms across Canada in key areas such as agriculture, environment, fisheries, forestry and health.
Renewable Energy
- The Industry Sector increased the exposure of Canadian capabilities in renewable energy sectors to domestic and international stakeholders by completing the first phase of a wind power technology transfer study. The goal was to identify firms and support the development of wind energy supply chains within Canada. The Sector also supported an international networking session on investment
attraction at the Canadian Wind Energy Association's annual conference. The Industry Sector is actively engaged in the development of the hydrogen and fuel cell industry in Canada and completed a comprehensive national hydrogen and fuel cell framework, which offers a long-term vision for sector commercialization and outlines clear sector opportunities and priorities.
Commercialization
- Ensuring that Canada turns knowledge into commercial success is an important goal that the Sector strives to achieve by providing advice and bringing more new technologies and products to the marketplace to benefit all Canadians. The Sector has helped coordinate and oversee federal government initiatives domestically and internationally in the hydrogen and fuel cell sector with an overall
objective of achieving full-scale commercialization.
Additional Achievements
Biotechnology
- The Industry Sector has focused on Canadian challenges and opportunities for biotechnology companies in the health sector and in the development and use of biotechnology (bio-products and processes) in new and traditional industries. The Sector has also made efforts to establish ongoing capacities within the Industry Portfolio and with other federal programs to better coordinate existing
commercialization programs.
- Through efforts within Industry Canada, and work with the Organisation for Economic Co-operation and Development, the Sector has helped to better benchmark Canada's capacity to develop and use innovative biotechnology-derived human health products, as well as contribute to the identification and development of international best practices and mechanisms to deliver the health and economic
benefits of these products. With federal, provincial and industry partners, the Sector has been able to identify the conditions and opportunities for encouraging greater uptake of biotechnology in other sectors, such as agriculture, forest, chemical and energy.
Nanotechnology
- The Industry Sector helped facilitate the promotion and adoption of nanotechnology through targeted activities, the development of an inventory of companies that are actively engaged in the nanotechnology area, and the development of an inventory of products within Canada that are manufactured using nanotechnology. This work is designed to identify the levels of activity currently
undertaken in Canada and aid efforts to support the commercialization of particular research. This has been accomplished through partnerships with provincial and federal government departments and with regional groups such as NanoQu�bec and the National Institute of Nanotechnology.
| Industry Sector – S&T and Innovation | 2006-07 | ||
|---|---|---|---|
| Planned Spending and Resources | Total Authorities as Per Public Accounts | Actual Spending and Resources | |
| Financial Resources | $19.4 million | $5.0 million | $4.9 million |
| Human Resources | 100 FTEs | - | 129 FTEs |
2.2.3 Program Activity: Spectrum, Information Technologies and Telecommunications – Science and Technology and Innovation
Spectrum, Information Technologies and Telecommunications (SITT) Sector – Science and Technology (S&T) and Innovation supports advanced and applied research within the Canadian Information and Communications Technology Sector for the development of innovative technologies.
Sub-Program Activities: SITT Sector – S&T and Innovation is delivered via one sub-program activity and two sub-sub-program activities:
- Information and Communications Technologies Branch
- CANARIE
- Precarn
Improved research capacity and commercialization of information and communication technologies (ICTs)
Industry Canada measures progress toward this expected result, in part, through the following indicator:
| Indicator | Progress in 2006-07 |
|---|---|
| Accessibility to advanced research across Canada |
|
Industry Canada committed to the following for 2006-07:
Through the provision of funding:
- Enable the Canadian research community to pursue advanced research across Canada and around the world.
- Promote further progress in Canada's intelligent systems and advanced robotics industries.
Results Achieved
Advanced Research
- As announced in Budget 2007, Industry Canada was successful in renewing support for the operation and development of CANARIE's advanced research network. Industry Canada is responsible for administering the $120-million, five-year conditional grant to the not-for-profit corporation, CANARIE Inc. Through this essential network infrastructure, researchers
in Canadian universities, colleges, research institutes and government laboratories have the capacity to conduct collaborative research on a global basis in all fields of science that benefits Canadians in areas such as physics, life sciences and the environment.
Intelligent Systems and Advanced Robotics
- Precarn Inc. is a national, not-for-profit, industry-led consortium that supports pre-competitive R&D projects in the fields of intelligent systems and advanced robotics. To promote further progress in Canada's intelligent systems and advanced robotic industries, Precarn received a five-year,
$20-million conditional grant for Phase 4 of its program in 2005-06. In 2006-07, Precarn funded 21 projects across the country (total funding of $4.4 million). Industry Canada is responsible for administering the funding agreement with Precarn Inc.
| SITT Sector – S&T and Innovation | 2006-07 | ||
|---|---|---|---|
| Planned Spending and Resources | Total Authorities as Per Public Accounts | Actual Spending and Resources | |
| Financial Resources | $2.9 million | $25.4 million | $24.1 million |
| Human Resources | 4 FTEs | - | 4 FTEs |
2.2.4 Program Activity: Communications Research Centre Canada – Science and Technology and Innovation
Communications Research Centre Canada (CRC) is the federal government's centre of excellence for R&D in telecommunications. As part of its mandate, CRC is an independent source of technical advice for public policy decisions and regulations (e.g., spectrum management and telecom policy); a contributor to telecommunications standards; a technology supporter of public health, safety and environmental and defence needs; and an enabler of economic and social development. CRC conducts research on advanced telecommunications and information technologies to ensure an independent source of advice for public policy, and to support the development of new products and services for the ICT Sector.
Sub-Program Activities: CRC is delivered via three sub-program activities:
- CRC – Wireless and Photonics Research
- CRC – Defence and R&D
- CRC – Research Support
Develop and maintain a high level of expertise and knowledge in technologies of importance to the Canadian telecommunications sector
Excellence in government and industrial client support through R&D and advice
Industry Canada measures progress toward these expected results, in part, through the following indicators:
| Indicators | Progress in 2006-07 |
|---|---|
| Number of scientific publications (published and presented) | Journal papers: 93 Conference presentations: 155 Technical memoranda: 18 |
| Number of patents |
Active patents in CRC portfolio: 237
|
| Number of research partnerships | Total active collaborative agreements in place with industry: 33 (10 new in fiscal year 2006-07) Total active collaborative agreements in place with university or government: 45 (7 new in fiscal year 2006-07) |
| Contracted R&D |
Contracting-in agreements: 58 (48 new in fiscal year 2006-07)
|
| Number of intellectual property licences |
Intellectual property licences: 401 (42 new)
|
Industry Canada committed to the following in 2006-07:
- Perform R&D on communications technologies of significance to Canada, including radio, satellite, broadcasting and fibre optics.
- Undertake R&D and program delivery on a cost-recovery basis for key partners, such as the Department of National Defence and the Canadian Space Agency.
- Work with key partners to develop standards to facilitate the efficient delivery of telecommunications and broadcasting.
- Provide strategic advice as well as direct assistance for the development of policy, regulations and standards in the telecommunications sector.
- Provide independent, technical advice relating to spectrum management, communications policy and regulatory decision-making applications.
Results Achieved
Research and Development
- During 2006-07, CRC continued to conduct R&D on communications technologies of significant importance to Canada, including radio, satellite, broadcasting and fibre optics. This resulted in the publication of 248 external scientific and technical publications, 18 new
patent applications, 42 new licences for companies to use CRC technology, and 48 new contracting-in arrangements.
- In support of the Department of National Defence, CRC carried out research projects in 2006-07 valued at $5.3 million on a cost-recovery basis. During the past year, CRC concluded a major demonstration of an experimental tactical communications network
that highlighted new capabilities that are possible with the use of advanced wireless and network technologies. Such demonstration projects allow National Defence to make better-informed decisions regarding communications-related procurements to support ongoing and future operational requirements.
Telecommunications and Broadcasting
- In order to help extend access of broadband data networks to all Canadians, especially in underserved rural areas, CRC continued its work in 2006-07 with the Institute of Electrical and Electronics Engineers to develop a cognitive radio standard that would allow wireless broadband services to be delivered over unused TV
channels in sparsely populated areas. Recent progress in this area has resulted in convincing the Federal Communications Commission in the United States that this technology can be implemented without negatively affecting current television band incumbents. This is an important step toward approval of an international standard in 2008, which in turn will allow volume (and therefore
lower-cost) production of broadband access equipment for the user community.
- CRC also collaborated with the Canadian Space Agency in 2006-07 to expand broadband Internet in Nunavut and the Northwest Territories. High-frequency ground terminals linked to the Anik F2 satellite were installed in Pond Inlet and Arviat as part of CRC's
Satellite Multimedia Applications Research and Trials (SMART) Program. This program demonstrates the feasibility and benefits of providing broadband satellite communications services such as Internet access and video conferencing to Northern Canada so that local government agencies and the private sector can make
decisions on future deployments.
- Following eight years of research and development, in November 2006 CRC launched a new development tool kit for Software Defined Radio (SDR), a product that can accommodate any communications protocol and frequency band by simply downloading the appropriate software on
the selected radio hardware. This new development tool kit will speed the adoption of SDR in civilian markets, including the space, avionics, automobile, public safety and consumer electronics markets. SDR offers many significant benefits; for example, it would enable paramedics, police,
firefighters and other emergency personnel to quickly reconfigure their radios to a common communications protocol in order to interconnect and communicate in a crisis situation.
| Communications Research Centre Canada – S&T and Innovation | 2006-07 | ||
|---|---|---|---|
| Planned Spending and Resources | Total Authorities as Per Public Accounts | Actual Spending and Resources | |
| Financial Resources | $44.1 million | $54.7 million | $50.6 million |
| Human Resources | 412 FTEs | - | 385 FTEs |
2.2.5 Program Activity: Technology Partnerships Canada – Science and Technology and Innovation
Technology Partnerships Canada (TPC) provides funding support for strategic research, development and demonstration projects that produce economic, social and environmental benefits to Canadians. On December 31, 2006, TPC's terms and conditions ended, and the program closed its doors to applications. Although Industry Canada has stopped entering into TPC contribution agreements, the Department will continue to manage TPC's $3.5-billion portfolio for the next 27 years.
Sub-Program Activities: Technology Partnerships Canada – Science and Technology and Innovation program activity is delivered via two sub-program activities:
- TPC – Research and Development Support Program
- TPC – Hydrogen Early Adopters (h2EA) Program
Commercialization encouraged through strategic partnering in innovative research and development
Industry Canada measures progress toward this expected result, in part, through the following indicator:
| Indicator | Progress in 2006-07 |
|---|---|
| Total number of projects (which represents the number of strategic partnerships) |
|
Industry Canada committed to the following for 2006-07:
- The Program for Strategic Industrial Projects (PSIP) will contribute to the achievement of Canada's objectives of increasing economic growth, creating jobs and wealth and supporting sustainable development.
Results Achieved
Program for Strategic Industrial Projects
- TPC investments helped partner companies leverage new and increased investment on a ratio of close to $4 per $1 invested by TPC. TPC's repayable contributions assisted Canadians in developing new technologies and
innovation, as well as increasing our knowledge base. TPC's total cumulative repayments as of March 31, 2007, amounted to more than $224.2 million.
- The TPC portfolio will be managed by the Industrial Technologies Office (ITO). ITO will administer the TPC legacy portfolio, the Hydrogen Early Adopters
(h2EA) Program and the Program for Strategic Industrial Projects (PSIP), along with a new program, the Strategic Aerospace and Defence Initiative (SADI), which was launched on April 2, 2007.
PSIP continues to manage existing projects and is in negotiation with other potential investment projects in the automotive sector.
- The goal of the h2EA program was to foster the development of hydrogen and hydrogen-compatible technologies, such as fuel cells and those used to produce, store and distribute hydrogen. The h2EA program did not contract any new projects during 2006-07 and is no longer
accepting new applications for funding. The program will sunset on March 31, 2008.
| Technology Partnerships Canada – S&T and Innovation | 2006-07 | ||
|---|---|---|---|
| Planned Spending and Resources | Total Authorities as Per Public Accounts | Actual Spending and Resources | |
| Financial Resources | $510 million | $459.8 million | $409.9 million |
| Human Resources | 142 FTEs | - | 100 FTEs |
2.3 Strategic Outcome: Competitive Industry and Sustainable Communities
The strategic outcome of competitive industry and sustainable communities refers to developing Canadian industry that can compete globally for resources and customers, and provide Canadian communities with the skills and resources that will ensure their success. The ability of Canadian industries to compete globally is especially important given that Canada is a trading nation. Furthermore, because many Canadians live in rural and northern communities, it is essential that these people have access to the same opportunities as people living in larger cities. Industry Canada conducts a variety of activities to achieve this strategic outcome, such as articulating the interests of Canadian businesses in international trade negotiations, developing policies that will reduce the administrative burden on businesses, and delivering programs to specific community groups to develop the skills that are required to compete in today's marketplace.
More specifically, in 2006-07, Industry Canada worked with other departments to influence Canada's trade agenda. Industry Canada helped ensure that the interests of Canadian businesses were represented in multilateral trade forums such as the ongoing Doha Round of multilateral trade negotiations at the World Trade Organization, as well as regional trade talks with the European Free Trade Association and with South Korea.
Industry Canada also continued to deliver a number of programs and services in 2006-07 with the goal of helping small and medium-sized businesses manage their regulatory and paperwork burden. Initiatives such as Canada Business, a multi-channel government information service for businesses and start-up entrepreneurs, and BizPaL, an online service that simplifies the business permit and licence process, both continued to expand their reach and services in 2006-07. The response from clients of these programs has been extremely positive.
Industry Canada recognizes that sustainable communities are better positioned to grow. Industry Canada continued to support community development in 2006-07 by delivering significant funding through FedNor, thus supporting Northern Ontario's participation in the knowledge-based economy.
The following section provides further detail on the ways in which Industry Canada is contributing to competitive industry and sustainable communities through the work of its program activities. Additional information on the programs and initiatives mentioned in the following can be found online at Section 5.2.3.
This strategic outcome is delivered through four program activities:
- Policy Sector – Economic Development
- Operations Sector – Economic Development
- Industry Sector – Economic Development
- Spectrum, Information Technologies and Telecommunications Sector – Economic Development
Analysis by Program Activity
2.3.1 Program Activity: Policy Sector – Economic Development
Policy Sector – Economic Development is responsible for the development of industry and international business policy.
Sub-Program Activities: Policy Sector – Economic Development is delivered via four sub-program activities and one sub-sub-program activity:
- International and Intergovernmental Affairs
- Strategic Policy Branch
- Sustainable Development Strategy
- Micro-Economic Policy Analysis Branch
- Small Business Policy Branch
Development and coordination of policy frameworks in support of competitive industry and sustainable communities
Industry Canada measures progress toward this expected result, in part, through the following indicator:
| Indicator | Progress in 2006-07 |
|---|---|
| Ongoing policy and program oversight and development is advanced with a view to enhancing industry competitiveness | Provided ongoing policy and program oversight and development, as demonstrated by results for individual programs |
Industry Canada committed to the following for 2006-07:
- Develop and coordinate policy frameworks.
- Promote sustainable development both within and outside the Department.
- Coordinate and encourage other federal departments to make progress on trade initiatives.
- Ensure that investment proposals by non-Canadians demonstrate a net benefit to Canada.
- Conduct research and analysis in order to address the financing needs of small and medium-sized enterprises.
- Lead the prosperity agenda of the Security and Prosperity Partnership of North America.
Results Achieved
Policy Development and Coordination
- The Policy Sector has worked to advance programs that support the Department's legislated mandate. Initiatives stemming from economic and policy research and proposals submitted by the administrators of existing programs must be presented in a clear, succinct way. Proposals have demonstrated not only that they fill gaps, such as those created by a changing marketplace or international
pressures, but also that they have addressed issues in the most efficient and effective way. The Policy Sector provided advice, guidance and recommendations to partners developing these proposals. Some proposals were reviewed, assessed and considered in anticipation of putting them forward for possible inclusion in government budgets and fiscal updates.
Sustainable Development
- Industry Canada is a proponent of sustainable development and has made efforts to increase awareness of corporate social responsibility (CSR) and sustainability practices among Canadian industry, institutions and communities. The Department worked to broaden CSR
information and awareness by supporting and participating in the National Roundtables on Corporate Social Responsibility and the Canadian Extractive Industries Operating in Developing Countries hosted by Foreign Affairs and International Trade Canada; the National Round Table on the Environment and the Economy on Capital Markets and Sustainability; and the National CSR Conference hosted by the Conference Board of Canada. All these activities served to improve the knowledge capacity as well as the promotion of innovative sustainability tools and practices within Canadian industries. Using these practices can help firms become more responsive to the social, environmental and economic needs of the communities in
which they operate. These practices can also help firms reduce business risks and enhance their brand value, reputation and bottom-line performance. In addition, the Policy Sector has worked to integrate sustainability principles into the decision making of the Department by providing sustainable development training and awareness-raising seminars, and renewing the strategic environmental
assessment guidance for departmental policies, plans and programs.
Trade Policy
- The Policy Sector continued to develop and articulate departmental positions on a wide range of trade policy issues that affect Industry Canada. In 2006-07, the Policy Sector directly supported Canada's international trade agenda in a number of ways:
- by providing advice on industrial issues to Foreign Affairs and International Trade Canada and other departments, including Finance Canada, Health Canada, Environment Canada and Natural Resources Canada;
- through its participation in trade talks under the mandate of the Doha Round of multilateral trade negotiations at the World Trade Organization; and
- by negotiating trade and investment issues that affect Industry Canada and Canadian industrial sectors on a regional basis with partners such as the European Free Trade Association, and bilaterally in the context of free-trade negotiations with South Korea and investment negotiations with Peru.
- by providing advice on industrial issues to Foreign Affairs and International Trade Canada and other departments, including Finance Canada, Health Canada, Environment Canada and Natural Resources Canada;
- Furthermore, the Policy Sector provided advice to Industry Canada officials on the consistency of funding for projects under Technology Partnerships Canada and the Structured Financing Facility with international trade rules such as the World Trade Organization's Agreement on Subsidies and Countervailing Measures.
Investment Review
- The Investment Review Division (IRD) of Industry Canada continued to administer the Investment Canada Act in 2006-07 to ensure that investment proposals submitted by non-Canadians demonstrate a net benefit to Canada. A total of 39 applications were approved by the Minister of Industry subsequent to the review process
undertaken by IRD. Also, 30 post-implementation reviews were concluded to ensure that investors' commitments were fulfilled.
Research and Analysis
- Research undertaken by the Sector in 2006-07 included case studies of R&D and commercialization that highlighted the challenges of collaborative innovation efforts, such as attracting key personnel and financing, and anticipating customer needs. Research and stakeholder analysis were also conducted on the supply of risk capital in
Canada. This identified a number of challenges, including tax barriers impeding access to sources of foreign capital by Canadian firms. This work supported the government's commitment to update the Canada-U.S. Tax Treaty to remove barriers. The research has also provided an indication of the magnitude of Canadian informal investment and explored
reasons for Canada's relatively low returns on risk capital investments.
- Industry Canada officials have worked closely with the Business Development Bank of Canada (BDC) to ensure that its activities remain consistent with its public policy mandate and the government's agenda, and directed the commissioning of an independent report entitled "Analysis of BDC Venture Capital Activities and Strategies," an assessment of BDC's venture capital strategy and activities and its role in the Canadian marketplace. The report's findings have been, and will continue to be, used to refine BDC's strategies with respect to its venture capital activities.
- The program of research and analysis on the financing issues confronting small and medium-sized enterprises (SMEs) continued in 2006-07. Five research reports on various aspects of financing of SME exporters and a number of financing profiles were completed and
disseminated to small business stakeholders. The research improved Industry Canada's understanding of the financing needs of SMEs by revealing that it is more difficult for early-stage SME exporters to obtain commercial loans than it is for established firms. This
information is available through the Financing Data Initiative (FDI) website.
- The activities of the Policy Sector are supported by the economic analysis provided by its Micro-Economic Policy Analysis Branch (MEPA). MEPA's research and analysis contributes to building the knowledge base required for sound micro-economic policies aimed at
supporting a strong Canadian economy and a high standard of living for Canadians. During 2006-07, MEPA held several major workshops and conferences on various current and emerging economic issues such as productivity, the international mobility of highly skilled workers, and industrial competitiveness. In addition, it completed
and commissioned numerous research papers on a variety of micro-economic issues. These workshops, conferences and research papers provide the foundation for the policy advice the Department provides for modernizing Canada's marketplace frameworks in support of a highly competitive economy. Furthermore, these activities assist in the dissemination of research findings and contribute to an
informed public debate on key micro-economic policy issues, such as productivity, commercialization, investment and innovation. Published research papers and research volumes can be viewed on the Industry Canada website Strategis: Industry Canada Economic Research.
Prosperity Agenda
- In 2006-07, the Government of Canada hosted a trilateral Security and Prosperity Partnership (SPP) ministerial meeting. With its launch in March 2005, the SPP has provided a framework to improve North American competitiveness and ensure that citizens benefit
from high standards of health, safety and joint stewardship of the environment. The meeting, which took place on February 23, 2007, facilitated discussions among SPP stakeholders and built consensus toward new priorities and next steps on key SPP issues. The
meeting established a forward agenda leading to the upcoming leaders' summit with the Prime Minister of Canada and the presidents of the United States and Mexico, to be hosted by Canada in August 2007.
| Policy Sector – Economic Development | 2006-07 | ||
|---|---|---|---|
| Planned Spending and Resources | Total Authorities as Per Public Accounts | Actual Spending and Resources | |
| Financial Resources | $11.5 million | $14.0 million | $12.2 million |
| Human Resources | 82 FTEs | - | 84 FTEs |
2.3.2 Program Activity: Operations Sector – Economic Development
The Operations Sector – Economic Development is responsible for delivering programs, information and intelligence on investment and technology opportunities to the business community. The Sector provides a multi-channel, common entry point for business on behalf of the Government of Canada, and encourages client-centred service delivery and design.
Sub-Program Activities: The Operations Sector – Economic Development is delivered via nine sub-program activities and three sub-sub-program activities:
- Canada Small Business Financing Program (CSBF)
-
FedNor
- Community Futures Program
- Northern Ontario Development Program
- Eastern Ontario Development Program
- Sectoral Strategies and Services Branch / Canada-Ontario Infrastructure Program (COIP)
- Aboriginal Business Canada (ABC; transferred to Indian and Northern Affairs as of December 2006)
- Regional Delivery
- Section 41, Official Languages Act
- Service to Business: Strategy and Innovation
- Canada Business – National Secretariat
- Student Connections
Improved access to capital and information for SMEs and communities targeted by Operations Sector programs
Industry Canada measures progress toward this expected result, in part, through the following indicators:
| Indicators | Progress in 2006-07 |
|---|---|
| Number of loans – year-over-year – registered through the CSBF Program | Loans Registered by Fiscal Year 2006-07: 9,621 2005-06: 10,840 2004-05: 11,143 |
| Number of SMEs – year-over-year – created or strengthened through FedNor and ABC | 3,652 SMEs created or strengthened by FedNor through the Community Futures Development Corporation investment fund, an increase of 381 from 2005-06 ABC transferred to Indian and Northern Affairs, effective December 1, 2006 |
| Percentage of Ontario population that has benefited from investments made under COIP | 83 percent |
| Percentage of official-language minority communities (OLMCs) that have benefited from investments made under the Section 41 program | A 2004-05 report verified that investments are proportional to the demographic weight of OLMCs. A study to update these results is under way. |
| Increase in number of SMEs served through Canada Business service centres (service usage) |
|
Industry Canada committed to the following for 2006-07:
- Work with partners to help create an environment, in which communities can thrive, businesses can grow, and people can prosper in rural and Northern Ontario.
- Canada Business to expand its content syndication pilot project.
- Support the Government of Canada in realizing the objectives of its Paperwork Burden Reduction Initiative and Smart Regulations through BizPaL.
- Provide e-business and Internet training to SMEs.
- Continue to provide services tailored to the needs of businesswomen.
- Fulfill Industry Canada's responsibilities under the Environmental Assessment Act.
Results Achieved
Business and Community Development
- In 2006-07, FedNor committed $68 million to businesses and community organizations, which leveraged more than $72 million in additional funds from other sources. Combined, these funds supported business development and long-term economic growth in rural and Northern Ontario.
- To ensure Northern Ontario's effective participation in the knowledge-based economy, FedNor committed almost $6.5 million in 2006-07 to ICT projects, including the development of applications such as distance education,
telehealth, and e-business and web portals. These activities are helping rural and Northern Ontario residents overcome distance barriers to ensure competitive businesses and sustainable communities.
- FedNor also committed more than $3.5 million through its Youth Internship Program to support 135 internships, providing recent graduates with valuable work experience that could lead to permanent employment in Northern Ontario. Of the interns employed through the program since 1998,
70 percent are still working in Northern Ontario, helping the region to retain and develop highly qualified people who contribute to competitive businesses and sustainable communities.
- Through the Community Futures Program, FedNor also continued to support a network of 61 Community Futures Development Corporations (CFDCs) in Ontario, which provided support to SMEs through strategic community planning and implementation, repayable financing for local businesses, and a variety of business services for SMEs. During 2006-07, rural business communities were enhanced through a total investment of more than $56 million through CFDC lending activities, leveraging more than $101 million from other sources and helping create or maintain 3,652 jobs.
- FedNor also delivered the Eastern Ontario Development Program, designed to promote socio-economic development in rural Eastern Ontario. In 2006-07, $10 million was committed through the region's 15 CFDCs in five priority areas:
business and community development, skills development, access to capital, retention and attraction of youth, and technological enhancements. These investments helped build local capacity for development and create the conditions for increased business and employment opportunities.
Assisting Canadian Businesses
- Industry Canada amended regulations for the Canada Small Business Financing Program, based on stakeholders' comments. The goal was to reduce the administrative burden on lenders and to bring the program in line with current lending practices. A research agenda has also been implemented to begin preparations for the 2009 statutory comprehensive review. A review of the Capital Leasing Pilot
Project concluded that the vast majority of Canada small business capital leasing needs are being met in the marketplace without government assistance. Following the review, Industry Canada decided not to extend the pilot project or make capital leasing permanent.
- Canada Business, a multi-channel government information service for businesses and start-up entrepreneurs in Canada, continued to offer business clients access to key information and services through their preferred channel. Canada Business implemented client-centric design and development processes to ensure continual improvements to all of its online information and applications, which
is a key principal of the service delivery strategy. There were 5.5 million visits to the Canada Business website in 2006-07. Canada Business handled approximately 237,915 telephone, in-person and email contacts with Canadian entrepreneurs during 2006-07, an increase of 1.1 percent over the previous year.
- Canada Business conducted its first national client satisfaction survey encompassing the 13 service centres across Canada. Results showed a high degree of support for the service: 83 percent of clients expressed satisfaction with the overall quality of service, 81 percent expressed satisfaction with service delivery and 91 percent of surveyed clients experienced no problems
with all aspects of the service. The survey confirms that Canada Business supports business development and responds to the particular challenges and opportunities facing SMEs.
- In 2006-07, Canada Business also added five new pilot content syndication partnerships and expanded the scope of content. This increased the reach and accessibility of Canada Business information and services to a wider range of businesses in a cost-effective manner by directly rendering relevant information to partners' websites.
- A partnership among Canada Business, the Canada-Ontario Business Service Centre and the Network for Women Entrepreneurs was honoured with a Gold Award at the Public Sector Quality Fair in Toronto. The award recognized the highly effective and low-cost, client-centric delivery of information, through syndication, from Canada Business directly to the Network for Women Entrepreneurs' new
website.
- In 2006-07, BizPaL, an online service that simplifies the business permit and licence process for entrepreneurs, governments and third-party business service providers, continued to expand. It was made available in five provinces and 20 municipalities. The service continued to receive recognition and won several prestigious awards, including the Diamond Award of Excellence, Best of Show,
from the Canadian Information Productivity Awards program, which recognizes excellence in information technology and innovative implementation.
Student Connections
- Fiscal year 2006-07 marked the 10th anniversary of Student Connections, and the program celebrated a milestone with more than 200,000 clients trained. Over the past decade, more than 6,400 youth have gained valuable work experience by participating in Student Connections, and have learned first-hand about the challenges and opportunities of entrepreneurship faced by small and
medium-sized businesses. In 2006-07 alone, Student Connections provided e-business and Internet training to more than 16,600 clients, exceeding its target by more than 10 percent.
Environmental Assessment
- Industry Canada continued to fulfill its responsibilities under the Environmental Assessment Act by completing 158 project screenings and initiating four comprehensive studies of projects delivered by the Canada-Ontario Municipal Rural Infrastructure Fund, and the Canada-Ontario Infrastructure Program.
Services for Women Entrepreneurs
- The Network for Women Entrepreneurs (NWE), delivered by Industry Canada through the Canada-Ontario Business Service Centre, provides women entrepreneurs in Ontario with access to business information and services. Through the continual enhancement of the information available through its website, NWE saw its web traffic increase from 7,646 visits and 6,256 unique visitors in 2005-06 to 53,757 visits and 48,113 unique visitors in 2006-07. In addition, by building on existing resources and working with local partners, NWE presented 10 learning events across the province and
participated in 28 trade shows and networking events. Feedback from hosting organizations and participants has been extremely positive.
Additional Achievements
- Regional offices provided logistical and briefing support in 2006-07 for over 95 events and announcements involving the Minister, the Secretary of State (Small Business and Tourism), other federal ministers, and departmental senior management. In 2006, the regional offices also provided on-the-ground support to a cross-country series of ministerial round tables with senior representatives
from research, industry, labour and education examining the issues of commercialization, prosperity, and a science and technology strategy.
| Operations Sector – Economic Development | 2006-07 | ||
|---|---|---|---|
| Planned Spending and Resources | Total Authorities as Per Public Accounts | Actual Spending and Resources | |
| Financial Resources | $349.4 million | $353.1 million | $352.8 million |
| Human Resources | 465 FTEs | - | 328 FTEs |
2.3.3 Program Activity: Industry Sector – Economic Development
In support of continuous economic growth and a high quality of life for Canadians in the future, the Industry Sector led several initiatives to help Canadian firms move up the value chain by becoming more competitive both domestically and globally. The following was undertaken by the Sector in 2006-07 to support the global reach and agility of Canadian firms in the marketplace.
Sub-Program Activities: The Industry Sector – Economic Development is delivered via seven sub-program activities and four sub-sub-program activities:
- Manufacturing Industries Branch
- Canadian Apparel and Textile Industries Program
- Energy and Environmental Industries Branch
- Border Air Quality Strategy
- Service Industries Branch
- Language Industry Initiative (LII)
- Aerospace, Defence and Marine Branch
- Structured Financing Facility (SFF)
- Life Sciences Branch
- Industrial Analysis and Sector Services Branch
- Automotive and Industrial Materials Branch
More firms capable of competing in global markets
Industry Canada measures progress toward this expected result, in part, through the following indicators:
| Indicators | Progress in 2006-07 |
|---|---|
| Dollar value of exports |
|
| Number of Canadian firms in the export market as a proportion of all firms in operation in Canada |
|
| Dollar value of investments (domestic and foreign) |
|
Industry Canada committed to the following for 2006-07:
- Build on several initiatives to deepen understanding of developments in global value chains and their economic implications for Canada and continue to ensure that policy initiatives reflect the realities of today's global supply chains.
- Continue to assess trade policy initiatives to determine potential challenges and opportunities for Canadian firms and to strengthen the Department's ability to analyze industrial trade issues.
- Advance the Smart Regulation Implementation Strategy and lead a program of policy research and evidence-based analysis of regulatory initiatives aimed at promoting regulatory efficiency.
- Continue to strengthen the position of Canadian businesses with foreign markets.
Results Achieved
Global Value Chains
- The Industry Sector expanded its expertise in global value chains (GVCs) through economic and policy research initiatives, such as the Policy Research Data Group feasibility project, logistics and supply chain management key performance indicators initiative, sectoral case studies in various industries (automotive and apparel), as well as
analysis of appropriate metrics to assess Canada's involvement in GVCs.
- The Sector also began identifying policy implications of GVCs through various analytical decks and building an outreach strategy to engage other government departments and stakeholders, as well as represent the Department of Industry at the Organisation for Economic Co-operation and Development committee and working group meetings.
Trade
- In order to advance Canada's trade policy agenda, the Industry Sector contributed to Free Trade Agreement negotiations by providing expert advice and sectoral analysis in several areas (pharmaceuticals and medical devices sectors, wood products, shipbuilding, and automotive).
- The Sector also helped stimulate trade and investment flows that benefit Canadian firms by participating in domestic and international visit programs and by disseminating marketing tools, information and intelligence. Key initiatives include several trade shows (such as BIO 2006, Interbuild, AMERICANA 2007, and Aerospace Maintenance Repair and Overhaul) and business development missions
for Canadian environmental forest equipment, textiles and aerospace companies.
- Industry Sector's role enabled Canadian companies to maintain and enhance market presence, access new markets, secure key contacts, identify sales leads and opportunities for strategic alliances, and seek investments. Some key conferences that were attended by Industry Canada representatives included AMERICANA 2007 – Canada's premier biennial international environmental
conference – and BIO 2006, among others. Industry Canada's participation in these events and conferences provided an opportunity for the Department to exhibit Canadian organizations, establish contact with key representatives in important industries, and promote investment and business development in Canada. The Sector also worked with other departments to develop an
automotive trade and investment strategy, and contributed economic analysis to the development of the Clean Air Regulatory Agenda.
Smart Regulation
- Since 2004-05, the Industry Sector has contributed to the Smart Regulation Implementation Strategy, which aimed to strengthen Canada's regulatory performance and establish a culture of continuous improvement in regulatory management across all levels of government. The Industry Sector advanced the strategy by contributing research and analysis to increase the government's understanding of
the sectoral impacts of regulation, in part through co-chairing the interdepartmental Theme Table on Innovation, Productivity and Business Environment.
- The Sector also undertook a study to identify key regulatory differences between Canada and the United States in priority sectors, which advanced our knowledge base and helped determine priorities for further sectoral research and regulatory analysis. Furthermore, the Sector initiated improvements to the federal regulatory system by working with the Treasury Board Secretariat to develop a
guide to help regulators analyze the impact of new regulatory proposals on Canadian businesses and industries.
- During 2006-07, the Smart Regulation Implementation Strategy was replaced with an Action Plan for implementing the Cabinet Directive on Streamlining Regulation.
SourceCAN
- SourceCAN is a secure electronic doorway to the global e-marketplace led by the Industry Sector that matches Canadian companies and their products and services with opportunities posted daily by 48 domestic and foreign corporations and governments. In 2006-07, SourceCAN received about 850,000 opportunities, and 7.6 million bid matches were generated. For more information on
SourceCAN, visit the SourceCAN website.
Additional Achievements
Tourism Industry
- In December 2006, federal, provincial and territorial ministers approved the National Tourism Strategy framework, encouraging a higher level of collaboration on issues that affect the competitiveness of the Canadian tourism industry. Within the context of the framework, federal, provincial and territorial governments decided to focus on six priority areas where they can collaborate
to grow the industry. These are border crossings, transportation infrastructure, product development, human resource development, tourism information and statistics, and tourism marketing.
- In addition, the Industry Sector signed a Memorandum of Understanding with the Canadian Tourism Commission to guide the Commission in aligning its activities with government policy and objectives, both domestically and abroad.
Security and Prosperity Partnership of North America
- The Industry Sector contributed to the development and implementation of initiatives under the Manufactured Goods and Sectoral and Regional Competitiveness (MGSRC) Working Group of the Security and Prosperity Partnership of North America (SPP).
- The Sector worked to enhance Canadian sectoral competitiveness by providing sector and policy expertise in support of the SPP and by developing the Regulatory Cooperation Framework with co-leads from other government departments. Other important initiatives under the MGSRC working group included a trilateral steel strategy and a strategy to combat counterfeiting and piracy.
Special Programs
- The Industry Sector has managed a small number of targeted interventions, through which the Government of Canada sought to encourage selected Canadian industries to become more competitive in the face of particularly intense international pressures through investing in capital, equipment and skills.
- Examples of these interventions included the Structured Financing Facility, which stimulated economic activities in the Canadian shipbuilding and industrial marine sector, and the Canadian Apparel and Textile Industries Program. The Textile Production Efficiency Component of the Canadian Textiles Program (CANtex) helped Canadian textile
manufacturers improve their productivity and reorient their production toward higher-value-added products for niche markets.
| Industry Sector – Economic Development | 2006-07 | ||
|---|---|---|---|
| Planned Spending and Resources | Total Authorities as Per Public Accounts | Actual Spending and Resources | |
| Financial Resources | $95.5 million | $73.3 million | $68.4 million |
| Human Resources | 257 FTEs | - | 246 FTEs |
2.3.4 Program Activity: Spectrum, Information Technologies and Telecommunications Sector – Economic Development
Spectrum, Information Technologies and Telecommunications (SITT) Sector – Economic Development promotes economic development by ensuring that Canadians, communities and businesses have access to reliable, modern ICT infrastructure and the skills to fully participate in the digital economy. It also enhances entrepreneurship and lifelong learning by fostering the creation of advanced, enabling applications and technologies. Finally, it supports the development of a competitive ICT industry in Canada.
Sub-Program Activities: SITT Sector – Economic Development is delivered via two sub-program activities and three sub-sub-program activities:
- Information and Communications Technologies Branch
- Information Highway Applications Branch
- Broadband for Rural and Northern Development Pilot Program
- Francommunaut�s virtuelles
- National Satellite Initiative
Canadians and communities overcome barriers and have access to modern ICT infrastructure.
Canadian ICT companies are positioned for growth in the global marketplace.
Industry Canada measures progress toward these expected results, in part, through the following indicators:
| Indicators | Progress in 2006-07 |
|---|---|
| Number of Canadians and communities accessing and using ICTs | The 2005 biennial Canadian Internet Use Survey reported that 68 percent of Canadians were using the Internet (58 percent in rural areas and in small towns). |
| Level of awareness of opportunities, gaps and barriers affecting ICT sector growth | To maintain current analysis on the sector, Industry Canada produced statistical reports on ICT sector performance and briefs on other critical issues and emerging trends, including highly qualified people, research and development, intellectual property transfer, scientific research and experimental development, science and technology, and investment and trade. |
Industry Canada committed to the following for 2006-07:
- Ensure that Canadians have access to ICTs and modern ICT infrastructure.
- Provide economic analysis that is critical to priority setting and decision making for the ICT sector.
Results Achieved
Access to Information Communication Technologies (ICTs)
- In 2006-07, Industry Canada secured additional funding to continue supporting programs such as the Community Access Program and Computers for Schools (CFS), which have played a key role in supplementing Canadians' access to ICTs and modern ICT infrastructure.
- In 2006-07, the Community Access Program supported approximately 4,000 public Internet access sites located in every Canadian province and territory.
- Industry Canada's Computers for Schools initiative has refurbished and distributed approximately 800,000 computers, of which almost 86,000 were in fiscal year 2006-07. The refurbishment system devised by Computers for Schools has been recognized as a sustainable and best practice both domestically and internationally.
- Industry Canada programs such as the Broadband for Rural and Northern Development Pilot Program and the National Satellite Initiative helped bring high-capacity Internet to remote and rural communities. The Broadband for Rural and Northern Development Pilot Program is responsible for connecting 875 communities (14 percent of all communities in Canada), of which 540 communities were
connected during the 2006-07 fiscal year.
- Industry Canada's National Satellite Initiative also provided some level of broadband service to a total of 91 communities, 51 of which were connected during the 2006-07 fiscal year.
- Industry Canada also continued to deliver Francommunaut�s virtuelles through funding provided by the Action Plan for Official Languages. This program promotes the use of ICTs by the country's Francophone and Acadian communities by funding projects that aim to expand French-language Internet content, applications and
services. During the 2005-2007 period, support was provided to 35 projects that were evaluated and recommended by the program's National Advisory Committee and approved by Industry Canada. These are multi-year projects; therefore, data for the 2006-07 period could not be isolated.
Economic Analysis
- In 2006-07, Industry Canada supported the development of a competitive ICT industry in Canada by publishing several analytical reports on the ICT sector. Some of the topics addressed in these reports included telecommunications wireless equipment and
the e health, e-security and e-gaming industries. These reports discuss what constitutes the industry, its past and current performance, global technology trends, business opportunities, Canada's strengths, the current policy environment and key issues, and current and future challenges. Industry Canada also supported the development of a competitive ICT industry by addressing key issues – such as highly qualified people, scientific research and experimental development, intellectual property transfer and commercialization – in policy forums and securing intelligence in these areas.
Additional Achievements
Industry Canada also supported Canada's ICT sector's efforts to compete globally by generating 533 sales leads through the coordination of Canadian pavilions at international trade shows and by organizing 31 corporate calls on investment targets. These activities contribute to the ongoing growth of the Canadian ICT sector and, in turn, create economic growth and jobs for Canadians.
| SITT Sector – Economic Development | 2006-07 | ||
|---|---|---|---|
| Planned Spending and Resources | Total Authorities as Per Public Accounts | Actual Spending and Resources | |
| Financial Resources | $76.0 million | $81.5 million | $76.9 million |
| Human Resources | 165 FTEs | - | 146 FTEs |
Section 3: Supplementary Information
3.1 Financial Summary Tables
|
|
|||||||
| ($ millions)* | 2004-05 Actual2 |
2005-06 Actual |
2006-07
|
||||
| Main Estimates | Planned Spending | Total Authorities | Total Actuals | ||||
|
|
|||||||
| A Fair, Efficient and Competitive Marketplace | |||||||
| Policy Sector – Marketplace | - | 7.2 | 9.3 | 9.0 | 7.4 | 6.2 | |
| Operations Sector – Marketplace | - | 110.2 | 87.2 | 87.0 | 87.5 | 86.5 | |
| Spectrum, Information Technologies and Telecommunications Sector – Marketplace | - | 73.4 | 60.2 | 59.9 | 68.9 | 67.0 | |
| Chief Information Office Sector – Marketplace1 | - | 0.6 | - | - | - | - | |
| Office of Consumer Affairs | - | 5.6 | 5.6 | 5.6 | 6.0 | 5.9 | |
| Competition Bureau | - | 55.7 | 45.3 | 48.1 | 49.3 | 42.1 | |
| Canadian Intellectual Property Office Revolving Fund3 | - | (27.6) | (7.7) | (7.7) | 88.7 | (28.5) | |
|
|
|||||||
| Subtotal | - | 225.2 | 199.9 | 201.9 | 307.8 | 179.3 | |
| An Innovative Economy | |||||||
| Policy Sector – S&T and Innovation | - | 42.2 | 10.5 | 46.2 | 11.5 | 10.6 | |
| Industry Sector – S&T and Innovation | - | 172.5 | 19.5 | 19.4 | 5.0 | 4.9 | |
| Spectrum, Information Technologies and Telecommunications Sector – S&T and Innovation | - | 20.8 | 2.9 | 2.9 | 25.4 | 24.1 | |
| Communications Research Centre Canada | - | 56.5 | 44.4 | 44.1 | 54.7 | 50.6 | |
| Technology Partnerships Canada | - | 473.7 | 418.0 | 510.0 | 459.8 | 409.9 | |
|
|
|||||||
| Subtotal | - | 765.7 | 495.4 | 622.7 | 556.5 | 500.1 | |
| Competitive Industry and Sustainable Communities | |||||||
| Policy Sector – Economic Development | - | 27.2 | 11.5 | 11.5 | 14.0 | 12.2 | |
| Operations Sector – Economic Development | - | 377.4 | 347.7 | 349.4 | 353.1 | 352.8 | |
| Industry Sector – Economic Development | - | 83.0 | 83.9 | 95.5 | 73.3 | 68.4 | |
| Spectrum, Information Technologies and Telecommunications Sector – Economic Development | - | 119.6 | 59.3 | 76.0 | 81.5 | 76.9 | |
| Chief Information Office Sector – Economic Development1 | - | 18.9 | - | - | - | - | |
|
|
|||||||
| Subtotal | - | 626.2 | 502.4 | 532.3 | 522.0 | 510.3 | |
|
|
|||||||
| Budgetary Main Estimates | 1,376.6 | 1,617.0 | 1,197.6 | 1,356.9 | 1,386.3 | 1,189.7 | |
| Non-Budgetary Main Estimates | 0.8 | 0.8 | 2.8 | - | |||
|
|
|||||||
| Total | 1,376.6 | 1,617.0 | 1,198.4 | 1,357.7 | 1,389.0 | 1,189.7 | |
|
|
|||||||
| Less: Non-respendable revenue | (599.1) | (485.4) | (575.6) | (522.3) | |||
| Plus: Cost of services received without charge | 77.9 | 79.8 | 79.7 | 84.8 | |||
|
|
|||||||
| Net Cost of Department | 855.4 | 1,211.4 | 1,198.4 | 861.7 | 1,389.0 | 752.3 | |
|
|
|||||||
| Full-Time Equivalents | 5,739 | 5,683 | N/A | 6,104 | N/A | 5,521 | |
|
|
|||||||
* Minor differences are due to rounding.
Note 1: Because the Chief Information Office Sector no longer exists as of 2006-07, figures were provided for 2005-06 only.
Note 2: No breakdown is available for 2004-05 Actuals. The strategic outcomes and Program Activity Architecture were implemented in Industry Canada's financial system starting in 2005-06.
Note 3: Details for the Canadian Intellectual Property Office Revolving Fund figures are provided in Section 3.1, Table 7.
| 2006-07 ($ millions)* | |||||||||
| Program Activity by Strategic Outcome | Budgetary | Plus: Non- Budgetary |
Total | ||||||
| Operating | Capital | Grants | Contributions and Other Transfer Payments | Total: Gross Budgetary Expenditures | Less: Respendable Revenue | Total: Net Budgetary Expenditures | Loans, Investments, and Advances | ||
| A Fair, Efficient and Competitive Marketplace | |||||||||
| Policy Sector – Marketplace | |||||||||
| Main Estimates | 8.7 | 0.1 | 0.6 | - | 9.3 | - | 9.3 | - | 9.3 |
| Planned Spending | 8.4 | 0.1 | 0.6 | - | 9.0 | - | 9.0 | - | 9.0 |
| Total Authorities | 6.7 | 0.1 | 0.6 | - | 7.4 | - | 7.4 | - | 7.4 |
| Total Actuals | 5.8 | 0.1 | 0.3 | - | 6.2 | - | 6.2 | - | 6.2 |
| Operations Sector – Marketplace | |||||||||
| Main Estimates | 125.6 | 2.0 | - | - | 127.6 | (40.5) | 87.2 | - | 87.2 |
| Planned Spending | 125.4 | 2.0 | - | - | 127.4 | (40.5) | 87.0 | - | 87.0 |
| Total Authorities | 124.9 | 3.0 | - | - | 127.9 | (40.5) | 87.5 | - | 87.5 |
| Total Actuals | 124.7 | 2.7 | - | - | 127.4 | (40.5) | 86.5 | - | 86.5 |
| Spectrum, Information Technologies and Telecommunications Sector – Marketplace | |||||||||
| Main Estimates | 51.4 | 1.9 | 6.9 | - | 60.2 | - | 60.2 | - | 60.2 |
| Planned Spending | 51.1 | 1.9 | 6.9 | - | 59.9 | - | 59.9 | - | 59.9 |
| Total Authorities | 53.6 | 8.4 | 6.9 | - | 68.9 | - | 68.9 | - | 68.9 |
| Total Actuals | 52.5 | 8.3 | 6.2 | - | 67.0 | - | 67.0 | - | 67.0 |
| Office of Consumer Affairs | |||||||||
| Main Estimates | 3.8 | 0.1 | - | 1.7 | 5.6 | - | 5.6 | - | 5.6 |
| Planned Spending | 3.8 | 0.1 | - | 1.7 | 5.6 | - | 5.6 | - | 5.6 |
| Total Authorities | 4.2 | 0.1 | - | 1.7 | 6.0 | - | 6.0 | - | 6.0 |
| Total Actuals | 4.1 | 0.1 | - | 1.7 | 5.9 | - | 5.9 | - | 5.9 |
| Competition Bureau | |||||||||
| Main Estimates | 55.4 | 0.4 | - | - | 55.8 | (10.5) | 45.3 | - | 45.3 |
| Planned Spending | 58.2 | 0.4 | - | - | 58.6 | (10.5) | 48.1 | - | 48.1 |
| Total Authorities | 56.7 | 3.1 | - | - | 59.8 | (10.5) | 49.3 | - | 49.3 |
| Total Actuals | 49.8 | 2.9 | - | - | 52.6 | (10.5) | 42.1 | - | 42.1 |
| Canadian Intellectual Property Office | |||||||||
| Main Estimates | 126.0 | - | - | - | 126.0 | (133.7) | (7.7) | - | (7.7) |
| Planned Spending | 126.0 | - | - | - | 126.0 | (133.7) | (7.7) | - | (7.7) |
| Total Authorities | 222.5 | - | - | - | 222.5 | (133.7) | 88.7 | - | 88.7 |
| Total Actuals | 120.0 | - | - | - | 120.0 | (148.5) | (28.5) | - | (28.5) |
| Subtotal – Marketplace | |||||||||
| Main Estimates | 370.9 | 4.5 | 7.4 | 1.7 | 384.5 | (184.7) | 199.9 | - | 199.9 |
| Planned Spending | 372.9 | 4.5 | 7.4 | 1.7 | 386.5 | (184.7) | 201.9 | - | 201.9 |
| Total Authorities | 468.5 | 14.8 | 7.4 | 1.7 | 492.5 | (184.7) | 307.8 | - | 307.8 |
| Total Actuals | 357.0 | 14.0 | 6.5 | 1.7 | 379.1 | (199.9) | 179.3 | - | 179.3 |
| An Innovative Economy | |||||||||
| Policy Sector – S&T and Innovation | |||||||||
| Main Estimates | 10.4 | 0.1 | - | - | 10.5 | - | 10.5 | - | 10.5 |
| Planned Spending | 16.0 | 0.1 | - | 30.1 | 46.2 | - | 46.2 | - | 46.2 |
| Total Authorities | 11.4 | 0.1 | - | - | 11.5 | - | 11.5 | - | 11.5 |
| Total Actuals | 10.5 | 0.1 | - | - | 10.6 | - | 10.6 | - | 10.6 |
| Industry Sector – S&T and Innovation | |||||||||
| Main Estimates | 19.5 | 0.1 | - | - | 19.5 | - | 19.5 | - | 19.5 |
| Planned Spending | 19.4 | 0.1 | - | - | 19.4 | - | 19.4 | - | 19.4 |
| Total Authorities | 4.9 | 0.1 | - | - | 5.0 | - | 5.0 | - | 5.0 |
| Total Actuals | 4.9 | 0.1 | - | - | 5.0 | - | 5.0 | - | 5.0 |
| Spectrum, Information Technologies and Telecommunications Sector – S&T and Innovation | |||||||||
| Main Estimates | 2.9 | - | - | - | 2.9 | - | 2.9 | - | 2.9 |
| Planned Spending | 2.9 | - | - | - | 2.9 | - | 2.9 | - | 2.9 |
| Total Authorities | 1.4 | - | 24.0 | - | 25.4 | - | 25.4 | - | 25.4 |
| Total Actuals | 0.1 | - | 24.0 | - | 24.1 | - | 24.1 | - | 24.1 |
| Communications Research Centre Canada | |||||||||
| Main Estimates | 50.1 | 3.0 | - | - | 53.1 | (8.7) | 44.4 | - | 44.4 |
| Planned Spending | 49.8 | 3.0 | - | - | 52.8 | (8.7) | 44.1 | - | 44.1 |
| Total Authorities | 54.2 | 9.2 | - | - | 63.4 | (8.7) | 54.7 | - | 54.7 |
| Total Actuals | 51.3 | 8.2 | - | - | 59.5 | (8.9) | 50.6 | - | 50.6 |
| Technology Partnerships Canada | |||||||||
| Main Estimates | 42.2 | 2.4 | - | 373.5 | 418.0 | - | 418.0 | - | 418.0 |
| Planned Spending | 40.5 | 2.4 | - | 467.2 | 510.0 | - | 510.0 | - | 510.0 |
| Total Authorities | 64.6 | 3.8 | - | 391.4 | 459.8 | - | 459.8 | - | 459.8 |
| Total Actuals | 64.3 | 3.4 | - | 342.2 | 409.9 | - | 409.9 | - | 409.9 |
| Subtotal – S&T and Innovation | |||||||||
| Main Estimates | 125.1 | 5.5 | - | 373.5 | 504.0 | (8.7) | 495.4 | - | 495.4 |
| Planned Spending | 128.6 | 5.5 | - | 497.3 | 631.3 | (8.7) | 622.7 | - | 622.7 |
| Total Authorities | 136.6 | 13.2 | 24.0 | 391.4 | 565.2 | (8.7) | 556.5 | - | 556.5 |
| Total Actuals | 131.0 | 11.8 | 24.0 | 342.2 | 509.1 | (8.9) | 500.2 | - | 500.2 |
| Competitive Industry and Sustainable Communities | |||||||||
| Policy Sector – Economic Development | |||||||||
| Main Estimates | 11.4 | 0.1 | - | - | 11.5 | - | 11.5 | - | 11.5 |
| Planned Spending | 11.4 | 0.1 | - | - | 11.5 | - | 11.5 | - | 11.5 |
| Total Authorities | 13.8 | 0.1 | 0.0 | - | 14.0 | - | 14.0 | - | 14.0 |
| Total Actuals | 12.1 | 0.1 | 0.0 | - | 12.2 | - | 12.2 | - | 12.2 |
| Operations Sector – Economic Development | |||||||||
| Main Estimates | 85.2 | 2.1 | - | 260.4 | 347.7 | - | 347.7 | - | 347.7 |
| Planned Spending | 86.8 | 2.1 | - | 260.5 | 349.4 | - | 349.4 | - | 349.4 |
| Total Authorities | 89.1 | 3.0 | - | 261.0 | 353.1 | - | 353.1 | - | 353.1 |
| Total Actuals | 88.9 | 2.9 | - | 261.0 | 352.8 | - | 352.8 | - | 352.8 |
| Industry Sector – Economic Development | |||||||||
| Main Estimates | 41.0 | 0.5 | - | 42.4 | 83.9 | - | 83.9 | 0.8 | 84.7 |
| Planned Spending | 40.6 | 0.5 | - | 54.4 | 95.5 | - | 95.5 | 0.8 | 96.3 |
| Total Authorities | 51.0 | 0.8 | - | 21.5 | 73.3 | - | 73.3 | 2.8 | 76.1 |
| Total Actuals | 50.1 | 0.7 | - | 17.5 | 68.4 | - | 68.4 | - | 68.4 |
| Spectrum, Information Technologies and Telecommunications Sector – Economic Development | |||||||||
| Main Estimates | 33.9 | 0.2 | - | 25.2 | 59.3 | - | 59.3 | - | 59.3 |
| Planned Spending | 35.0 | 0.2 | - | 40.8 | 76.0 | - | 76.0 | - | 76.0 |
| Total Authorities | 22.2 | 0.3 | - | 59.1 | 81.5 | - | 81.5 | - | 81.5 |
| Total Actuals | 19.6 | 0.2 | - | 57.1 | 76.9 | - | 76.9 | - | 76.9 |
| Subtotal – Economic Development | |||||||||
| Main Estimates | 171.5 | 2.9 | - | 328.0 | 502.4 | - | 502.4 | 0.8 | 503.2 |
| Planned Spending | 173.8 | 2.9 | - | 355.7 | 532.3 | - | 532.3 | 0.8 | 533.1 |
| Total Authorities | 176.1 | 4.2 | 0.0 | 341.6 | 522.0 | - | 522.0 | 2.8 | 524.7 |
| Total Actuals | 170.7 | 4.0 | 0.0 | 335.5 | 510.3 | - | 510.3 | - | 510.3 |
| Grand Total | |||||||||
| Main Estimates | 667.5 | 12.9 | 7.4 | 703.1 | 1,390.9 | (193.4) | 1,197.6 | 0.8 | 1,198.4 |
| Planned Spending | 675.3 | 12.9 | 7.4 | 854.6 | 1,550.2 | (193.4) | 1,356.9 | 0.8 | 1,357.7 |
| Total Authorities | 781.2 | 32.3 | 31.5 | 734.6 | 1,579.6 | (193.4) | 1,386.3 | 2.8 | 1,389.0 |
| Total Actuals | 658.7 | 29.9 | 30.5 | 679.5 | 1,398.5 | (208.8) | 1,189.7 | - | 1,189.7 |
* Minor differences are due to rounding.
|
2006-07 ($ millions)* |
|||||
| Voted or Statutory Item | Truncated Vote or Statutory Wording | Main Estimates | Planned Spending | Total Authorities | Total Actuals |
|
|
|||||
| 1 | Operating expenditures | 420.9 | 428.7 | 436.7 | 416.1 |
| 5 | Capital expenditures | 12.9 | 12.9 | 32.3 | 29.9 |
| 10 | Grants and contributions | 607.1 | 758.6 | 682.2 | 626.1 |
| (S) | Minister of Industry salary and motor car allowance | 0.1 | 0.1 | 0.1 | 0.1 |
| (S) | Insurance payments under the Enterprise Development and Regional Development Program | 10.0 | 10.0 | - | - |
| (S) | Canadian Intellectual Property Office Revolving Fund1 | (7.7) | (7.7) | 88.7 | (28.5) |
| (S) | Liabilities under the Small Business Loans Act (SBLA) | 4.0 | 4.0 | 2.5 | 2.5 |
| (S) | Liabilities under the Canada Small Business Financing Act (CSBFA) | 89.5 | 89.5 | 81.3 | 81.3 |
| (S) | Contributions to employee benefit plans | 60.8 | 60.8 | 57.9 | 57.9 |
| (S) | Spending of proceeds from the disposal of surplus Crown assets | - | - | 0.5 | 0.2 |
| (S) | Refunds to amounts credited to revenues in previous years | - | - | 0.5 | 0.5 |
| (S) | Court awards | - | - | 3.6 | 3.6 |
| (S) | Losses on foreign exchange | - | - | - | - |
| (S) | Liabilities for loan guarantee payments pursuant to paragraph 14(1) of the Department of Industry Act | - | - | - | - |
| (S) | Council of Canadian Academies | - | - | - | - |
| (S) | Grant to Genome Canada | - | - | - | - |
| (S) | Grant to Precarn Incorporated | - | - | - | - |
| (S) | Grant to Canadian Youth Business Foundation | - | - | - | - |
|
|
|||||
| Total Budgetary | 1,197.6 | 1,356.9 | 1,386.3 | 1,189.7 | |
| L15 | Payments pursuant to subsection 14(2) of the Department of Industry Act |
0.3 | 0.3 | 0.3 | - |
| L20 | Loans pursuant to paragraph 14(1)(a) of the Department of Industry Act |
0.5 | 0.5 | 0.5 | - |
| L97b | Advances to regional offices and employees posted abroad. Appropriation Act No. 1, 1970. Limit $1,950,000 (net) | - | - | 2.0 | - |
|
|
|||||
| Total Non-Budgetary | 0.8 | 0.8 | 2.8 | - | |
|
|
|||||
| Total Department | 1,198.4 | 1,357.7 | 1,389.0 | 1,189.7 | |
|
|
|||||
* Minor differences are due to rounding.
Note 1: Details for the Canadian Intellectual Property Office Revolving Fund figures are provided in Section 3.1, Table 7.
|
|
|
| ($ millions)* | 2006-07 |
|
|
|
| Accommodation provided by Public Works and Government Services Canada | 53.3 |
| Contributions covering employer's share of employees' insurance premiums and expenditures paid by Treasury Board of Canada Secretariat (TBS) (excluding revolving funds) | 25.6 |
| Workers' compensation coverage provided by Human Resources and Social Development Canada | 0.6 |
| Salary and associated expenditures of legal services provided by Justice Canada | 5.3 |
|
|
|
| Total 2006-07 services received without charge | 84.8 |
|
|
|
* Minor differences are due to rounding.
|
|
||||||
| ($ millions) | Actual 2004-05 |
Actual 2005-06 |
2006-07
|
|||
| Main Estimates | Planned Spending | Total Authorities | Total Actual | |||
|
|
||||||
| Competitive Industry and Sustainable Communities | ||||||
| Industry Sector – Economic Development | ||||||
| Payments pursuant to subsection 14(2) of the Department of Industry Act | - | - | 0.3 | 0.3 | 0.3 | - |
| Loans pursuant to paragraph 14(1)(a) of the Department of Industry Act | - | - | 0.5 | 0.5 | 0.5 | - |
| Operations Sector – Economic Development | ||||||
| Advances to regional offices and employees posted abroad. Appropriation Act No. 1, 1970. Limit $1,950,000 (net) | - | - | - | - | 2.0 | - |
|
|
||||||
| Total | - | - | 0.8 | 0.8 | 2.8 | - |
|
|
||||||
|
Respendable Revenue |
|||||||
| ($ millions)* | Actual 2004-05 |
Actual 2005-06 |
2006-07
|
||||
| Main Estimates | Planned Revenue | Total Authorities | Total Actual | ||||
|
|
|||||||
| A Fair, Efficient and Competitive Marketplace | |||||||
| Operations Sector – Marketplace | |||||||
| Bankruptcy and Insolvency Administration | 30.9 | 31.9 | 31.9 | 31.9 | 31.9 | 32.3 | |
| Corporations Regulation | 7.5 | 7.9 | 8.6 | 8.6 | 8.6 | 8.6 | |
| Competition Bureau | |||||||
| Competition Law and Policy | 10.5 | 10.4 | 10.5 | 10.5 | 10.5 | 10.5 | |
| Canadian Intellectual Property Office Revolving Fund | 127.2 | 137.3 | 133.7 | 133.7 | 133.7 | 148.5 | |
|
|
|||||||
| Subtotal | 176.1 | 187.5 | 184.7 | 184.7 | 184.7 | 199.9 | |
| An Innovative Economy | |||||||
| Communications Research Centre Canada | |||||||
| Communications Research | 7.9 | 8.4 | 8.7 | 8.7 | 8.7 | 8.9 | |
|
|
|||||||
| Subtotal | 7.9 | 8.4 | 8.7 | 8.7 | 8.7 | 8.9 | |
|
|
|||||||
| Total Respendable Revenue | 184.0 | 195.9 | 193.4 | 193.4 | 193.4 | 208.8 | |
|
Non-Respendable Revenue |
|||||||
| ($ millions)* | Actual 2004-05 |
Actual 2005-06 |
2006-07
|
||||
| Main Estimates | Planned Revenue | Total Authorities | Total Actual | ||||
|
|
|||||||
| A Fair, Efficient and Competitive Marketplace | |||||||
| Operations Sector – Marketplace | |||||||
| Bankruptcy and Insolvency Supervision | 1.0 | 1.0 | 3.3 | 3.3 | 3.3 | 2.7 | |
| Corporations Regulation (including NUANS�) | 0.7 | 1.6 | 1.9 | 1.9 | 1.9 | 3.2 | |
| Trade Measurement Regulation | 1.9 | 1.6 | 1.8 | 1.8 | 1.8 | 1.2 | |
| Prior Year Refunds, Interest and Other | 27.7 | 26.7 | - | - | - | 24.6 | |
| Competition Bureau – Marketplace | |||||||
| Fines | 8.5 | 8.1 | - | - | - | 6.6 | |
| Consumer Labelling and Advertising Regulation | 0.1 | 0.1 | 0.1 | 0.1 | 0.1 | 0.1 | |
| Prior Year Refunds, Interest and Other | - | 2.2 | - | - | - | 4.3 | |
| Spectrum, Information Technologies and Telecommunications Sector – Marketplace** | 385.8 | 205.6 | 371.4 | 371.4 | 371.4 | 205.0 | |
|
|
|||||||
| Subtotal | 425.7 | 247.0 | 378.5 | 378.5 | 378.5 | 247.7 | |
| An Innovative Economy | |||||||
| Communications Research Centre Canada | |||||||
| Communications Research | 1.2 | 1.5 | 1.5 | 1.5 | 1.5 | 3.0 | |
| Technology Partnerships Canada – Special Operating Agency | |||||||
| Receipts from Repayable Contributions | 37.3 | 79.9 | 76.7 | 76.7 | 76.7 | 92.0 | |
| Prior Year Refunds, Interest and Other | - | 11.3 | - | - | - | 22.9 | |
|
|
|||||||
| Subtotal | 38.5 | 92.8 | 78.2 | 78.2 | 78.2 | 117.9 | |
| Competitive Industry and Sustainable Communities | |||||||
| Spectrum, Information Technologies and Telecommunications Sector – Economic Development | - | 2.1 | - | - | - | 1.9 | |
| Operations Sector – Economic Development | |||||||
| SBLA/CSBFA Service Fees | 55.7 | 59.3 | 59.9 | 59.9 | 59.9 | 60.0 | |
| Receipts from Repayable Contributions | - | 20.3 | 11.4 | 11.4 | 11.4 | 7.9 | |
| Return on Investment | 15.2 | 18.2 | 14.8 | 14.8 | 14.8 | 21.1 | |
| Prior Year Refunds, Interest and Other | - | 3.0 | - | - | - | 16.0 | |
| Industry Sector – Economic Development | |||||||
| Receipts from Repayable Contributions | 64.0 | 32.9 | 32.8 | 32.8 | 32.8 | 40.1 | |
| Prior Year Refunds, Interest and Other | - | 9.9 | - | - | - | 9.7 | |
|
|
|||||||
| Subtotal | 134.9 | 145.7 | 118.9 | 118.9 | 118.9 | 156.7 | |
|
|
|||||||
| Total Non-Respendable Revenue | 599.1 | 485.4 | 575.6 | 575.6 | 575.6 | 522.3 | |
|
|
|||||||
| Total Respendable and Non-Respendable Revenue | 783.1 | 681.4 | 769.0 | 769.0 | 769.0 | 731.1 | |
|
|
|||||||
* Minor differences are due to rounding.
** Actual revenues for 2005-06 and 2006-07 do not include that portion of deferred revenue that is being realized in the current year. Planned revenue includes $171.1 million related to the amortization of licence fee revenue received in previous years.
|
Statement of Operations |
|||||||
| ($ millions)* | Actual 2004-05 |
Actual 2005-06 |
2006-07
|
||||
| Main Estimates | Planned Spending | Total Authorities | Total Actual | ||||
|
|
|||||||
| Respendable Revenue | 115.6 | 124.7 | 129.3 | 129.3 | 129.3 | 138.3 | |
|
|
|||||||
| Expenses | |||||||
| Operating: | |||||||
| Salaries and employee benefits | 68.7 | 75.1 | 87.5 | 87.5 | 87.5 | 81.5 | |
| Depreciation | 15.7 | 14.8 | 15.1 | 15.1 | 15.1 | 13.4 | |
| Repairs and maintenance | 1.1 | 1.2 | 1.1 | 1.1 | 1.1 | 1.1 | |
| Administrative and support services | 16.0 | 17.5 | 21.0 | 21.0 | 21.0 | 23.5 | |
| Utilities, materials and supplies | 8.6 | 9.2 | 10.9 | 10.9 | 10.9 | 10.2 | |
| Marketing | - | - | - | - | - | - | |
| Interest | - | - | - | - | - | - | |
|
|
|||||||
| Total Expenses | 110.1 | 117.8 | 135.6 | 135.6 | 135.6 | 129.7 | |
|
|
|||||||
| Subtotal Surplus (Deficit) | 5.5 | 6.9 | (6.3) | (6.3) | (6.3) | 8.6 | |
| Deferred capital assistance | 6.4 | 6.4 | 6.4 | 6.4 | 6.4 | 6.4 | |
|
|
|||||||
| Surplus (Deficit) | 11.9 | 13.3 | 0.1 | 0.1 | 0.1 | 15.0 | |
|
Statement of Cash Flows |
|||||||
| ($ millions)* | Actual 2004-05 |
Actual 2005-06 |
2006-07
|
||||
| Main Estimates | Planned Spending | Total Authorities | Total Actual | ||||
|
|
|||||||
| Surplus (Deficit) | 11.9 | 13.3 | 0.1 | 0.1 | 0.1 | 15.0 | |
|
|
|||||||
| Add Non-Cash Items: | |||||||
| Depreciation/amortization | 15.7 | 14.8 | 15.1 | 15.1 | 15.1 | 13.4 | |
| Deferred capital assistance | (6.4) | (6.4) | (6.4) | (6.4) | (6.4) | (6.4) | |
| Investing Activities: | |||||||
| Acquisition of depreciable assets | (2.9) | (7.6) | (6.0) | (6.0) | (6.0) | (4.5) | |
| Changes in short- and long-term assets/liabilities | 13.9 | 13.5 | 4.9 | 4.9 | 4.9 | 11.0 | |
|
|
|||||||
| Cash Surplus (requirement) | 32.2 | 27.6 | 7.7 | 7.7 | 7.7 | 28.5 | |
|
Projected Use of Authority |
|||||||
| ($ millions)* | Actual 2004-05 |
Actual 2005-06 |
2006-07
|
||||
| Main Estimates | Planned Spending | Total Authorities | Total Actual | ||||
|
|
|||||||
| Authority | 5.0 | 5.0 | 5.0 | 5.0 | 5.0 | 5.0 | |
| Drawdown: | |||||||
| Balance as at April 1 | 74.8 | 107.2 | 122.8 | 122.8 | 122.8 | 134.8 | |
| TB Vote 5 | 0.2 | - | - | - | - | 0.3 | |
| Adjustment of unused authority via Supplementary Estimates "B" | 0.4 | ||||||
| Adjustment TB Vote 5 – Previous years | (1.8) | ||||||
| Budget 2006 Spending Restraint | (50.0) | ||||||
| Projected surplus (drawdown) | 32.2 | 27.6 | 7.7 | 7.7 | 7.7 | 28.5 | |
|
|
|||||||
| 107.2 | 134.8 | 130.5 | 130.5 | 130.5 | 112.2 | ||
|
|
|||||||
| Projected Balance at March 31 | 112.2 | 139.8 | 135.5 | 135.5 | 135.5 | 117.2 | |
|
|
|||||||
* Minor differences are due to rounding.
|
2006-07 |
||||
| Organization ($ millions)* |
A Fair, Efficient and Competitive Marketplace | An Innovative Economy | Competitive Industry and Sustainable Communities | Total |
|
|
||||
| Policy Sector | ||||
| Main Estimates | 9.3 | 10.5 | 11.5 | 31.3 |
| Planned Spending | 9.0 | 46.2 | 11.5 | 66.7 |
| Total Authorities | 7.4 | 11.5 | 14.0 | 32.9 |
| Total Actuals | 6.2 | 10.6 | 12.2 | 29.0 |
| Operations Sector | ||||
| Main Estimates | 87.2 | - | 347.7 | 434.9 |
| Planned Spending | 87.0 | - | 349.4 | 436.4 |
| Total Authorities | 87.5 | - | 353.1 | 440.5 |
| Total Actuals | 86.5 | - | 352.8 | 439.3 |
| Industry Sector | ||||
| Main Estimates | - | 19.5 | 84.7 | 104.2 |
| Planned Spending | - | 19.4 | 96.3 | 115.7 |
| Total Authorities | - | 5.0 | 76.1 | 81.1 |
| Total Actuals | - | 4.9 | 68.4 | 73.3 |
| Spectrum, Information Technologies and Telecommunications Sector | ||||
| Main Estimates | 60.2 | 2.9 | 59.3 | 122.4 |
| Planned Spending | 59.9 | 2.9 | 76.0 | 138.8 |
| Total Authorities | 68.9 | 25.4 | 81.5 | 175.9 |
| Total Actuals | 67.0 | 24.1 | 76.9 | 167.9 |
| Communications Research Centre Canada | ||||
| Main Estimates | - | 44.4 | - | 44.4 |
| Planned Spending | - | 44.1 | - | 44.1 |
| Total Authorities | - | 54.7 | - | 54.7 |
| Total Actuals | - | 50.6 | - | 50.6 |
| Technology Partnerships Canada – Special Operating Agency | ||||
| Main Estimates | - | 418.0 | - | 418.0 |
| Planned Spending | - | 510.0 | - | 510.0 |
| Total Authorities | - | 459.8 | - | 459.8 |
| Total Actuals | - | 409.9 | - | 409.9 |
| Office of Consumer Affairs | ||||
| Main Estimates | 5.6 | - | - | 5.6 |
| Planned Spending | 5.6 | - | - | 5.6 |
| Total Authorities | 6.0 | - | - | 6.0 |
| Total Actuals | 5.9 | - | - | 5.9 |
| Competition Bureau | ||||
| Main Estimates | 45.3 | - | - | 45.3 |
| Planned Spending | 48.1 | - | - | 48.1 |
| Total Authorities | 49.3 | - | - | 49.3 |
| Total Actuals | 42.1 | - | - | 42.1 |
| Canadian Intellectual Property Office Revolving Fund | ||||
| Main Estimates | (7.7) | - | - | (7.7) |
| Planned Spending | (7.7) | - | - | (7.7) |
| Total Authorities | 88.7 | - | - | 88.7 |
| Total Actuals | (28.5) | - | - | (28.5) |
| Total Department | ||||
| Main Estimates | 199.9 | 495.3 | 503.2 | 1,198.4 |
| Planned Spending | 201.9 | 622.6 | 533.2 | 1,357.7 |
| Total Authorities | 307.8 | 556.5 | 524.8 | 1,389.0 |
| Total Actuals | 179.3 | 500.1 | 510.3 | 1,189.7 |
|
|
||||
* Minor differences are due to rounding.
3.2 User Fees / External Fees
Supplementary information on service standards for external fees can be found at the Treasury Board of Canada Secretariat website.
Access to Information and Privacy (ATIP)
| 2006-07 | ||||||||
| A. User Fee | Fee Type | Fee-Setting Authority |
Date Last Modified |
Forecast Revenue ($000) |
Actual Revenue ($000) |
Full Cost ($000) |
Performance Standard* |
Performance Results* |
| Access to Information and Privacy (ATIP) fees | Regulatory | Access to Information Act and Privacy Act | 1983 | 3 | 3 | 1,611 | Framework under development by TBS | Statutory deadlines met 95 percent of the time |
| Total | 3 | 3 | 1,611 | |||||
| Planning Years | |||||
| Forecast Revenue ($000) | Estimated Full Cost ($000) | ||||
| 2007-08 | 2008-09 | 2009-10 | 2007-08 | 2008-09 | 2009-10 |
| 3 | 3 | 3 | 1,862 | 1,862 | 1,862 |
| B. Other Information | |||||
| The Access to Information Act (ATI Act) states that all formal requests submitted must be accompanied by a $5.00 application fee payable to the Receiver General for Canada. All fees prescribed and received pursuant to the ATI Act are returned to the Consolidated
Revenue Fund. All fees collected and waived under the ATI Act are detailed in the Department's annual access to information and privacy report to Parliament. Figures reflect the allocation for Information and Privacy Rights Administration only. |
|||||
* According to prevailing legal opinion, where the corresponding fee introduction or most recent modification occurred prior to March 31, 2004:
- the performance standard, if provided, may not have received parliamentary review;
- the performance standard, if provided, may not respect all establishment requirements under the User Fees Act (e.g., international comparison, independent complaint address); and
- the performance result, if provided, is not legally subject to section 5.1 of the User Fees Act regarding fee reductions for unachieved performance.
Canada Small Business Financing Program
| 2006-07 | ||||||||
| A. User Fee | Fee Type | Fee- Setting Authority |
Date Last Modified |
Forecast Revenue ($000) |
Actual Revenue ($000) |
Full Cost ($000) |
Performance Standard* |
Performance Results* |
| CSBFA Loans component (registration and administration fees) Capital leases component (registration and administration fees) |
Regulatory | Canada Small Business Financing Act (CSBFA) | Fees were established for the CSBFA in April 1999, and for the Capital Leasing Pilot Project in April 2002 | CSBFA: 58,300 |
CSBFA: 57,550 |
4,070 | The following standards were set: Two days or less to register loans/leases Twenty days or less to process claims |
The following results were obtained: Standard of two days or less to register loans/leases met 100 percent of the time Time required to process a claim in 2006-07 was an average of 13 days Standard of 20 days or less to process claims met 80 percent of the time |
| SBLA Administration fees requests |
Regulatory services | Small Business Loans Act (SBLA) | A 1.25-percent administration fee was established in 1995 | SBLA: 1,600 |
SBLA: 1,582 |
The following standard was set: Twenty days or less to process claims |
The following results were obtained: Time required to process a claim in 2006-07 was an average of 13 days Standard of 20 days or less to process claims met 80 percent of the time |
|
| Total | 59,900 | 59,132 | 4,070 | |||||
| Planning Years | |||||
| Forecast Revenue ($000) | Estimated Full Cost ($000) | ||||
| 2007-08 | 2008-09 | 2009-10 | 2007-08 | 2008-09 | 2009-10 |
| 59,300 | 58,460 | 58,000 | 5,304 | 5,154 | 5,099 |
| B. Other Information | |||||
| "Full Cost" figures represent the cost of the CSBF directorate to administer the CSBF and SBLA programs. Full cost does not include expenses with claim payments made to financial institutions as a result of defaulted loans or leases. These expenses are covered in financial tables for Transfer Payment Programs. | |||||
* According to prevailing legal opinion, where the corresponding fee introduction or most recent modification occurred prior to March 31, 2004:
- the performance standard, if provided, may not have received parliamentary review;
- the performance standard, if provided, may not respect all establishment requirements under the User Fees Act (e.g., international comparison, independent complaint address); and
- the performance result, if provided, is not legally subject to section 5.1 of the User Fees Act regarding fee reductions for unachieved performance.
Canadian Intellectual Property Office (CIPO)
| 2006-07 | ||||||||
| A. User Fee | Fee Type | Fee-Setting Authority |
Date Last Modified |
Forecast Revenue ($000) |
Actual Revenue ($000) |
Full Cost ($000) |
Performance Standard* |
Performance Results* |
| Fees are charged for services that are provided by a regulating authority | Regulatory CIPO grants or registers ownership for five types of intellectual property: patents, trademarks, copyright, industrial designs and integrated circuit topographies |
Financial Administration Act Patent Act Trade-marks Act Copyright Act Industrial Design Act Integrated Circuit Topography Act Department of Industry Act |
January 1, 2004 | Patents: 99,107 |
Patents: 108,165 |
123,272 | 80 percent of applications with a request for examination processed in less than 27 months | 77 percent of applications with a request for examination processed in less than 27 months |
| Trademarks: 26,443 |
Trademarks: 26,394 |
Processed within 6 months of the filing date at the start of 2006-07, to four months at the end of 2006-07 | Processed within 5.5 months of filing date | |||||
| Industrial Design: 2,681 |
Industrial Design: 2,375 |
Processed within 13 months of receipt of application | Processed within 11.1 months from receipt of application | |||||
| Copyright: 550 |
Copyright: 591 |
Processed within 3 working days from receipt of application | Processed within 2.3 working days from receipt of application | |||||
| Information: 567 |
Information: 686 |
Percentage of increased awareness and use of intellectual property (SMEs segment) | 36 percent familiar with intellectual property (baseline) | |||||
| Total | 129,348 | 138,211 | 123,272 | |||||
| Planning Years | |||||
| Forecast Revenue ($000) | Estimated Full Cost ($000) | ||||
| 2007-08 | 2008-09 | 2009-10 | 2007-08 | 2008-09 | 2009-10 |
| 139,683 | 146,048 | 149,306 | 133,519 | 142,796 | 149,306 |
| B. Date Last Modified The last amendments to the schedule of fees came into force January 1, 2004. |
|||||
| C. Other Information Turnaround times for examining trademark applications did not meet expectations, due to unexpected high attrition in 2006-07. Recruitment of new trademark examiners will redress the situation. |
|||||
* According to prevailing legal opinion, where the corresponding fee introduction or most recent modification occurred prior to March 31, 2004:
- the performance standard, if provided, may not have received parliamentary review;
- the performance standard, if provided, may not respect all establishment requirements under the User Fees Act (e.g., international comparison, independent complaint address); and
- the performance result, if provided, is not legally subject to section 5.1 of the User Fees Act regarding fee reductions for unachieved performance.
Competition Bureau
| 2006-07 | ||||||||
| A. User Fee | Fee Type | Fee-Setting Authority |
Date Last Modified |
Forecast Revenue ($000) |
Actual Revenue ($000) |
Full Cost ($000) |
Performance Standard* |
Performance Results* |
| Combined Merger Notification and Advance Ruling Certificate requests | Regulatory | Department of Industry Act, Competition Bureau Fee and Service Standards Policy | April 1, 2003 | 1,682 | 2,200 | 5,612 | Non-complex: 14 days Complex: 10 weeks Very complex: 5 months |
94.5 percent 90.9 percent 66.7 percent |
| Merger Notification | Regulatory | 861 | 1,150 | 11,224 | Non-complex: 14 days Complex: 10 weeks Very complex: 5 months |
94.5 percent 90.9 percent 66.7 percent |
||
| Advance Ruling Certificate requests | Other products and services | 8,307 | 10,625 | 1,870 | ||||
| Written Opinions: the Commissioner may provide binding opinions on proposed business conduct | Other products and services | 53 | 81 | 412 | Performance standards vary, ranging from 2 weeks to 10 weeks for different sections of the Competition Act | 77.3 percent | ||
| CA number: Provide a CA number for fabric tags | Other products and services | Department of Industry Act | November 1997 | 97 | 118 | 177 | There are no performance standards for this service | The majority of requests are answered instantly |
| Total | 11,000 | 14,174 | 19,296 | |||||
| Planning Years | |||||
| Forecast Revenue ($000) | Estimated Full Cost ($000) | ||||
| 2007-08 | 2008-09 | 2009-10 | 2007-08 | 2008-09 | 2009-10 |
| 13,125 | 13,125 | 13,125 | 21,365 | 21,365 | 21,365 |
* According to prevailing legal opinion, where the corresponding fee introduction or most recent modification occurred prior to March 31, 2004:
- the performance standard, if provided, may not have received parliamentary review;
- the performance standard, if provided, may not respect all establishment requirements under the User Fees Act (e.g., international comparison, independent complaint address); and
- the performance result, if provided, is not legally subject to section 5.1 of the User Fees Act regarding fee reductions for unachieved performance.
Corporations Canada
| 2006-07 | ||||||||
| A. User Fee | Fee Type | Fee-Setting Authority |
Date Last Modified |
Forecast Revenue ($000) |
Actual Revenue ($000) |
Full Cost ($000) |
Performance Standard* |
Performance Results* |
| Corporations Canada has several product offerings, including file articles of incorporation, letters patent, file articles of continuance, file statements of revocation of intent to dissolve, file annual returns, and name searches | Regulatory | Canada Business Corporations Act (CBCA), Canada Corporations Act (CCA), Canada Cooperatives Act | No activity in 2006-07 Most recent consultations were undertaken in 2000-01, when Corporations Canada introduced a reduction in the incorporation fee and annual return fee |
Incorporations under the CBCA: 4,300 |
Incorporations under the CBCA: 4,457 |
12,874 | Internet: | |
| CBCA incorporation applications received by 1:00 p.m. EST via e-commerce are processed by 5:00 p.m. EST |
91.5 percent of CBCA incorporations received via e-commerce issued within standard | |||||||
| Visitors: | ||||||||
| Clients who come to headquarters between 8:30 a.m. and 2:30 p.m. will receive one-hour, over-the-counter service |
100 percent of requests (CBCA incorporations and restated articles) issued within standard | |||||||
| Batches: | ||||||||
| Batches of five or more articles are processed within the same day if received before 8:00 a.m. |
100 percent of requests issued within standard | |||||||
| Incorporations under the CCA Part II: 195 |
Incorporations under the CCA Part II: 232 |
CCA Part II incorporation applications are processed within 20 business days | 100 percent of CCA Part II incorporations received by mail are issued within standard | |||||
| Annual returns under CBCA: 3,500 |
Annual returns under CBCA: 4,000 |
CBCA annual returns are processed and available on the Corporations Canada website within five business days | 99 percent of annual returns received by mail are available on the Corporations Canada website within standard | |||||
| Annual summaries under CCA: 390 |
Annual summaries under CCA: 336 |
CCA annual summaries are processed and available on the Corporations Canada website within 20 business days | 99 percent of annual summaries received by mail are available on the Corporations Canada website within standard | |||||
| Amendments under CBCA: 1,135 |
Amendments under CBCA: 1,523 |
Amendments under the CBCA incorporation applications received by 1:00 p.m. EST via e-commerce are processed by 5:00 p.m. EST | 94.3 percent of amendments under the CBCA incorporation received via e-commerce issued within standard | |||||
| Other services such as revival, certificate, copies: 980 |
Other services such as revival, certificate, copies: 1,233 |
Service standards are available on the Corporations Canada website at the Services and Contacts page | ||||||
| Total | 10,500 | 11,784 | 12,874 | |||||
| Planning Years | |||||
| Forecast Revenue ($000) | Estimated Full Cost ($000) | ||||
| 2007-08 | 2008-09 | 2009-10 | 2007-08 | 2008-09 | 2009-10 |
| 10,500 | 10,500 | 10,500 | 12,823 | 12,366 | 12,366 |
* According to prevailing legal opinion, where the corresponding fee introduction or most recent modification occurred prior to March 31, 2004:
- the performance standard, if provided, may not have received parliamentary review;
- the performance standard, if provided, may not respect all establishment requirements under the User Fees Act (e.g., international comparison, independent complaint address); and
- the performance result, if provided, is not legally subject to section 5.1 of the User Fees Act regarding fee reductions for unachieved performance.
Measurement Canada
| 2006-07 | ||||||||
| A. User Fee | Fee Type | Fee- Setting Authority |
Date Last Modified |
Forecast Revenue ($000) |
Actual Revenue ($000) |
Full Cost ($000) |
Performance Standard* |
Performance Results* |
| Measurement standards certification and measuring device approval | Regulatory | Weights and Measures Act | 1993 | 260 | 262 | 1,024 | Certificate of Calibration is issued in 60 calendar days | Performance standard met, on average, 95 percent of the time |
| Notice of Approval issued in 90 days if device is in compliance with requirements | Performance standard met, on average, 85 percent of the time | |||||||
| Measuring device inspection | Regulatory | Weights and Measures Act | 1993 | 900 | 638 | 2,495 | Inspection is performed within 10 calendar days of receipt of request | Performance standard met, on average, 80 percent of the time |
| Measuring apparatus certification and electricity and natural gas meter approval | Regulatory | Electricity and Gas Inspection Act | 1995 | 160 | 161 | 630 | Certificate of Calibration is issued in 60 calendar days | Performance standard met, on average, 95 percent of the time |
| Notice of Approval issued in 90 days if meter is in compliance with requirements | Performance standard met, on average, 80 percent of the time | |||||||
| Electricity and gas meter inspection | Regulatory | Electricity and Gas Inspection Act | 1995 | 200 | 87 | 203 | Inspection is performed within 10 calendar days of receipt of request | Performance target met 80 percent of the time |
| Electricity and gas accreditation | Regulatory | Electricity and Gas Inspection Act | 1995 | 110 | 77 | 179 | Accreditation is granted within one month of an audit that demonstrates that the applicant has met all requirements | Performance target met 100 percent of the time |
| Total | 1,630 | 1,225 | 4,530 | |||||
| Planning Years | |||||
| Forecast Revenue ($000) | Estimated Full Cost ($000) | ||||
| 2007-08 | 2008-09 | 2009-10 | 2007-08 | 2008-09 | 2009-10 |
| Measurement Standards Certification and Measuring Device Approval | |||||
| 260 | 260 | 260 | 1,016 | 1,016 | 1,016 |
| Measuring Device Inspection | |||||
| 900 | 900 | 900 | 3,519 | 3,519 | 3,519 |
| Measuring Apparatus Certification and Electricity and Natural Gas Meter Approval | |||||
| 160 | 160 | 160 | 625 | 625 | 625 |
| Electricity and Gas Meter Inspection | |||||
| 200 | 200 | 200 | 782 | 782 | 782 |
| Electricity and Gas Accreditation | |||||
| 110 | 110 | 110 | 431 | 431 | 431 |
| Total: 1,630 | Total: 1,630 | Total: 1,630 | Total: 6,373 | Total: 6,373 | Total: 6,373 |
* According to prevailing legal opinion, where the corresponding fee introduction or most recent modification occurred prior to March 31, 2004:
- the performance standard, if provided, may not have received parliamentary review;
- the performance standard, if provided, may not respect all establishment requirements under the User Fees Act (e.g., international comparison, independent complaint address); and
- the performance result, if provided, is not legally subject to section 5.1 of the User Fees Act regarding fee reductions for unachieved performance.
Office of the Superintendent of Bankruptcy
| 2006-07 | ||||||||
| A. User Fee | Fee Type | Fee-Setting Authority |
Date Last Modified |
Forecast Revenue ($000) |
Actual Revenue ($000) |
Full Cost ($000) |
Performance Standard* |
Performance Results* |
| Registration fee | Regulatory | Bankruptcy and Insolvency Act and Rules | 2001 | 9,268 | 9,336 | 13,281 | Registration of new estates: 90 percent of the time within two days | 99.9 percent of estates registered within standard |
| Superintendent levy | Regulatory | Bankruptcy and Insolvency Act and Rules | 2001 | 22,479 | 21,923 | 31,188 | Letters of comment: issued 90 percent of the time within 21 business days of receipt of the Statement of Affairs | 92.7 percent of letters issued within standard |
| Name search fee | Regulatory | Bankruptcy and Insolvency Act and Rules | 2001 | 2,450 | 2,758 | 3,923 | Faxes answered within 24 hours | 99.9 percent of faxes responded to within standard |
| Trustee licence fee | Regulatory | Bankruptcy and Insolvency Act and Rules | 2001 | 970 | 1,011 | 1,438 | No standard Annual fee is paid by a trustee in order to retain his/her licence. The licence is annulled if the fee is not paid. |
N/A |
| Total | 35,167 | 35,027 | 49,830 | |||||
| Planning Years | |||||
| Forecast Revenue ($000) | Estimated Full Cost ($000) | ||||
| 2007-08 | 2008-09 | 2009-10 | 2007-08 | 2008-09 | 2009-10 |
| Registration Fee | |||||
| 9,190 | 9,292 | 9,497 | 12,996 | 13,071 | 13,181 |
| Superintendent Levy | |||||
| 21,784 | 21,864 | 22,132 | 30,806 | 30,759 | 30,719 |
| Name Search Fee | |||||
| 2,751 | 2,751 | 2,751 | 3,890 | 3,870 | 3,818 |
| Trustee Licence Fee | |||||
| 1,000 | 1,000 | 1,000 | 1,414 | 1,407 | 1,388 |
| Total: 34,725 | Total: 34,907 | Total: 35,380 | Total: 49,107 | Total: 49,107 | Total: 49,107 |
* According to prevailing legal opinion, where the corresponding fee introduction or most recent modification occurred prior to March 31, 2004:
- the performance standard, if provided, may not have received parliamentary review;
- the performance standard, if provided, may not respect all establishment requirements under the User Fees Act (e.g., international comparison, independent complaint address); and
- the performance result, if provided, is not legally subject to section 5.1 of the User Fees Act regarding fee reductions for unachieved performance.
Spectrum Management
| 2006-07 | ||||||||
| A. User Fee | Fee Type | Fee-Setting Authority |
Date Last Modified |
Forecast Revenue ($000) |
Actual Revenue ($000) |
Full Cost ($000) |
Performance Standard* |
Performance Results* |
| Radio licences | Regulatory | Financial Administration Act Radiocommunication Act Department of Industry Act |
Radio licence fees: 2000 | 205,000 | 217,472 | 98,171 | ||
| 1. Land mobile service: a) Pre-determined (fixed parameters) |
1a) Processing time of three weeks (15 working days) per transaction | 1a) Three-week processing standard met 98.1 percent of the time | ||||||
| b) Non-pre-determined (requiring frequency assignment and electromagnetic compatibility study) | 1b) Processing time of seven weeks (35 working days) per transaction | 1b) Seven-week processing standard met 96.2 percent of the time | ||||||
| 2. Fixed service | 2. Processing time of four weeks (20 working days) per transaction | 2. Four-week processing standard met 93.6 percent of the time | ||||||
| 3. Space service | 3. Processing time of nine weeks (45 working days) per transaction | 3. Nine-week processing standard met 99.1 percent of the time | ||||||
| Radio and terminal equipment approval | Regulatory | Financial Administration Act | The fees were last modified January 21, 1998 | 1,000 | 1,537 | 2,351 | Three to five weeks | Twelve calendar days on average; 35 days maximum; standard met 85 percent of the time |
| Total | 206,000 | 219,009 | 100,521 | |||||
| Planning Years | |||||
| Forecast Revenue ($000) | Estimated Full Cost ($000) | ||||
| 2007-08 | 2008-09 | 2009-10 | 2007-08 | 2008-09 | 2009-10 |
| Radio Licences | |||||
| 210,000 | 210,000 | 210,000 | 93,447 | 93,447 | 93,447 |
| Radio and Terminal Equipment Approval | |||||
| 1,150 | 570 | 530 | 1,784 | 890 | 828 |
| Total: 211,150 | Total: 210,570 | Total: 210,530 | Total: 95,231 | Total: 94,337 | Total: 94,275 |
* According to prevailing legal opinion, where the corresponding fee introduction or most recent modification occurred prior to March 31, 2004:
- the performance standard, if provided, may not have received parliamentary review;
- the performance standard, if provided, may not respect all establishment requirements under the User Fees Act (e.g., international comparison, independent complaint address); and
- the performance result, if provided, is not legally subject to section 5.1 of the User Fees Act regarding fee reductions for unachieved performance.
3.3 Response to Parliamentary Committees, Audits and Evaluations
| Responses to the Auditor General (including to the Commissioner of the Environment and Sustainable Development) |
| Commissioner of the Environment and Sustainable Development – Petitions The environmental petitions process is a formal way for Canadians to bring concerns about the environment and sustainable development to the attention of federal ministers and obtain a timely response. The environmental petitions process was created as a result of a 1995 amendment to the Auditor General Act. On behalf of the Auditor General of Canada, the Commissioner of the Environment and Sustainable Development manages the petitions process and monitors responses by making sure that the questions and issues that Canadians raise are answered by federal ministers. The Minister responded to the following petitions in 2006-07: Petition No. 167 – Alternative Fuels Act Petition No. 170 – Friends to the Earth Petition No. 171 – Bio Vectra, Targeted Biopharmaceutical Solutions Petition No. 172 – Residential Exposure Assessment and Risk Analysis Petition No. 174 – Cellular Telephone Tower and the Canadian Assessment Act |
3.4 Sustainable Development Strategy
| Details of Industry Canada's Sustainable Development Strategy | |
|---|---|
| 1. What are the key goals, objectives, and/or long-term targets of the SDS? | Industry Canada tabled its fourth Sustainable Development Strategy 2006-2009 (SDS IV) in December 2006. SDS IV supports a competitive economy and aims to position Industry Canada as a leader in supporting sustainable development technologies and practices for business and consumers. To achieve these objectives, SDS IV aims to achieve three strategic outcomes: sustainability-driven technologies and commercialization; sustainability tools, practices, research and awareness; and sustainability practices and operations within Industry Canada. The strategic outcomes represent the long-term benefits to stakeholders that can be derived from the implementation of the Department's Sustainable Development Strategy. |
| 2. How do your key goals, objectives, and/or long-term targets help achieve your department's strategic outcomes? | SDS IV's strategic outcomes are aligned with the Department's strategic outcomes. The Department is committed to establishing a fair, efficient and competitive marketplace, which helps to establish a robust business environment that encourages R&D investment and entrepreneurship. SDS IV's strategic outcome of "sustainability tools, practices, research and awareness" supports the implementation of business sustainability strategies designed to reduce risk, manage liabilities, improve productivity performance, and
respond to consumer demands for sustainable products and services. The Department is committed to promoting an innovative economy, which drives science and technology progress and ensures that discoveries made in Canada contribute to the quality of life of Canadians. SDS IV's strategic outcome of "sustainability-driven technologies and commercialization" supports investment in the generation and commercialization of knowledge, in support of the development of environmental and enabling technologies. The Department is committed to supporting the development of competitive industry and sustainable communities, which promotes business investment and development, long-term growth and sustainable development. SDS IV's strategic outcome of "sustainability tools, practices, research and awareness" supports the adoption of sustainability-enhancing business-process-improvement tools and practices, and responds to heightened consumer demands for products and services that are more sustainable. The third strategic outcome of SDS IV, "implementing sustainability practices and operations within Industry Canada," contributes to the Department's corporate management function by promoting sustainability management systems and processes, greening operations programming, and training and capacity-building initiatives. |
| 3. What were your targets for the reporting period? | SDS IV is a three-year Department-wide plan for progressing toward sustainable development. Work will take place on 26 action items on an ongoing basis throughout the three-year period (2006-2009) to achieve the planned outcomes. Each of the three strategic outcomes has a specific target. Target 1: Work in partnership with industry and others to increase development, commercialization, adoption and diffusion of environmental, energy and bio-based technologies. By December 2009, Industry Canada will complete the implementation of nine action plan items. Target 2: Work in partnership with industry, consumers and others to increase use by firms, industries and institutions of sustainability and corporate social responsibility practices, and increased consumer awareness of sustainability issues. By December 2009, 11 action plan items will be completed. Target 3: Enhance the capacity of Industry Canada's management systems by increasing implementation of sustainable operations and practices, and integration of sustainable development principles into departmental planning, performance measurement and evaluation frameworks. By December 2009, six action plan items will be implemented. |
| 4. What is your progress to date? | Industry Canada has made progress over the past 10 years in achieving its targets set out in previous SDSs, and it is the Department's goal to continue to improve its work in this area over the period of SDS IV. These efforts will
continue to focus on supporting long-term competitiveness through the dissemination of information, tools and practices to Canadian industry and consumers. Industry Canada will also continue to improve the integration of sustainability principles into its planning, performance measurement and evaluation frameworks, and improve its greening operations performance. SDS IV contains 26 action items, which are designed to deliver on the three strategic outcomes. A total of 11 branches from across Industry Canada are responsible for the implementation of these action items. Highlights from the first reporting period (December 2006–March 31, 2007) include: Biorefineries: Life Sciences Branch developed a Technology Roadmap focusing on technology to enable production of value-added chemicals from under-used materials in the forest sector. Computers for Schools (CFS): Information Highway Applications Branch (IHAB) reported that its program diverted approximately 1,505 tonnes (1,659 imperial tons), of CPUs from landfill through re-use. Greening Operations: The Facilities Management Branch (Environmental Steward) increased employee awareness and promoted green operations by initiating a weekly online article "Environmental Practices." Renewed Strategic Environmental Assessment (SEA): Strategic Policy Branch (SPB) launched a renewed SEA guidance document, and a publicly accessible website, including a public statements page. SPB also held a sustainable development training course for 17 departmental employees. |
| 5. What adjustments have you made, if any? (To better set the context for this information, discuss how lessons learned have influenced your adjustments.) | Industry Canada's SDS IV contains 26 action items, which will be delivered over the three-year life of the Strategy. Many of the ongoing initiatives of the SDS have been modified to reflect changes in individual branch priorities and resources, and views expressed by stakeholders at consultations. As well, new initiatives have been developed to take into account issues raised by stakeholders and evaluations of past strategies. These adjustments are reported through the Department's monitoring and reporting system. As well, semi-annual Strategy progress reports are submitted to both the Director General Policy Committee and to the Deputy Minister, and highlights are posted online. To date, one round of SDS IV progress reports has been completed. |
Section 4: Other Items of Interest
4.1 Section 41, Official Languages Act
The Department has established a coordinated strategic framework to maximize participation by official-language minority communities in existing federal economic development programs and services. This framework integrates the government's Action Plan for Official Languages. Industry Canada and the four regional development agencies continued implementation of this plan in 2006-07. In addition, work continued on a major research effort on minority communities, and consultations strengthened partnerships with them.
During the past year, Industry Canada's commitment to official-language minority communities has been strengthened through a number of key activities. A dialogue has been maintained, on an ongoing basis and at various levels, to better understand the priorities and challenges that official-language minority communities are facing. In particular, Industry Canada's network of regional advisors and coordinators is dedicated to working exclusively with these communities and has been reinforced with new communications tools. At the same time, Industry Canada has continued awareness-building efforts internally as well as externally to ensure that managers and community leaders are informed about community needs and evolving programs. A formative evaluation was completed on all departmental programs, activities and projects that have been implemented to support the economic development of official-language minority communities. The recommendations were accepted and are being enacted. A DVD was also developed that features interactive geographic maps showing the locations of official-language minority communities across the country, using Statistics Canada data. This tool will provide a more comprehensive statistical portrait of the communities to help the Department determine future initiatives.
Throughout all of these activities, as well as in other efforts, Industry Canada has strengthened partnerships with the regional development agencies to ensure a coordinated presence within official-language minority communities.
4.2 Industry Canada's Organizational Chart
Industry Canada's organizational chart illustrates the Department's accountability structure.
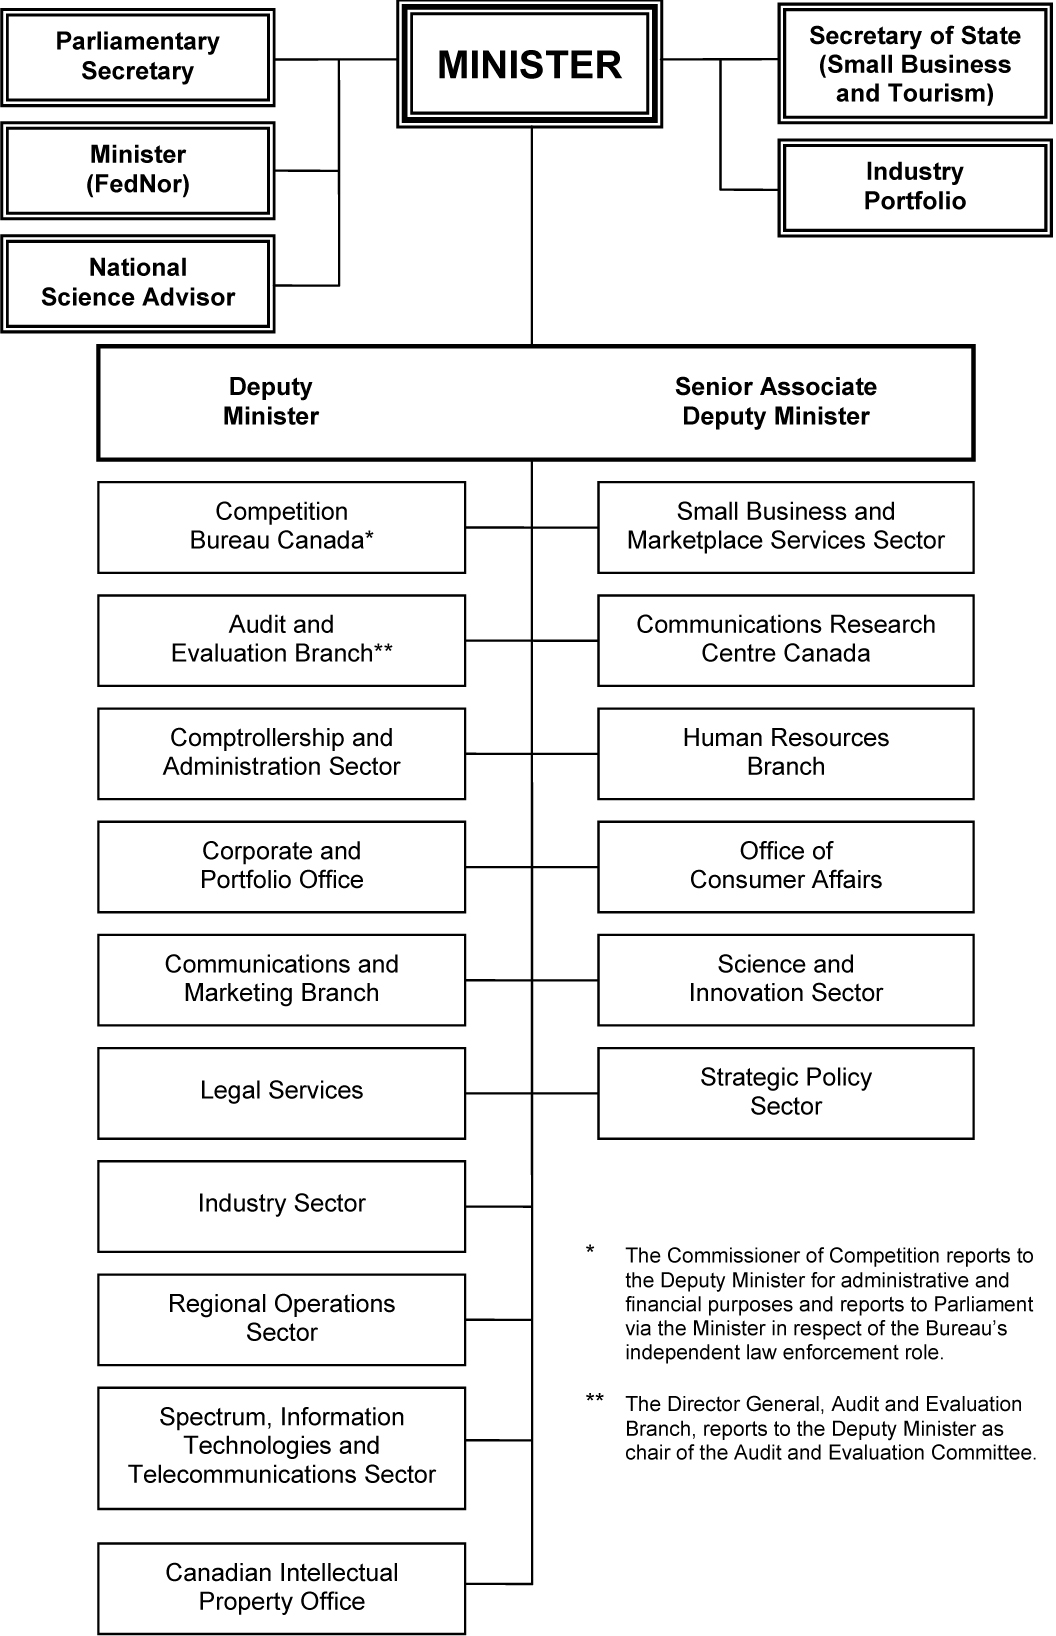
4.3 Organizational Changes within Industry Canada
The Department's organizational chart shown above reflects a number of recent organizational changes that are outlined in further detail below. It is important to note that the 2006-07 DPR does not reflect this new organizational structure. The organizational changes include the following:
- Policy Sector: The previous Policy Sector has been reshaped to create a more focused Strategic Policy group, and a new Science and Innovation group that will better focus on innovation policy in its broadest sense.
- Operations Sector: The previous Operations Sector has been split into the Small Business and Marketplace Services Sector and the Regional Operations Sector following a realignment of Industry Canada's operational agenda.
4.4 Machinery of Government Changes
In 2006-07, changes in the machinery of government affected Industry Canada and its Portfolio in the following ways:
- Aboriginal Business Canada (ABC) – ABC was transferred from Industry Canada to Indian and Northern Affairs Canada as of December 2006. Given that this change occurred late in the fiscal year, the Main Estimates for 2007-08 do not reflect the
transfer. The transfer will be reflected in the 2007-08 Supplementary Estimates and the 2008-09 Main Estimates.
- National Science Advisor (NSA) – The NSA was transferred from the Privy Council Office to Industry Canada as of May 2006. Due to the timing of this transfer, the financial and human resources associated with the NSA are included with Corporate Services, and the resources are divided across all programs and services.
- Secretary of State (Small Business and Tourism) – On January 4, 2007, the Secretary of State (Small Business and Tourism) was appointed. The Secretary of State is responsible for small business and tourism, including outreach to key stakeholders and business associations such as the Canadian Federation of Independent Business and the Tourism Industry
Association of Canada. Industry Canada supports the Secretary of State in his endeavours to address key priorities pertaining to small business and tourism.
Section 5: Information Available Online
5.1.1 Summary Table of Priorities by Strategic Outcome
| Departmental Priority | Supported by Program Activity | Indicator | Performance Status |
|---|---|---|---|
| A Fair, Efficient and Competitive Marketplace | |||
| Continuing to modernize marketplace frameworks in support of a highly competitive and innovative economy for the benefit of all Canadians |
|
Barriers to competition | In 2003, Canada tied for sixth place among Organisation for Economic Co-operation and Development (OECD) member countries in terms of having the least restrictive barriers to competition. Note: Industry Canada recognizes that data sources for this indicator are no longer relevant. Revised indicators and associated data sources are being developed. |
| Regulatory and administrative capacity | In 2003, Canada ranked second among OECD countries in terms of having the least restrictive regulatory and administrative capacity. Note: Industry Canada recognizes that data sources for this indicator are no longer relevant. Revised indicators and associated data sources are under development. |
||
| An Innovative Economy | |||
| Ensuring the strategic allocation of resources Supporting the generation and commercialization of knowledge |
|
Government expenditure on research and development (R&D) | In 2006-07, the federal government's expenditure on R&D totalled $5.7 billion. In 2006, about 18 percent of Canada's R&D was funded by the federal government. |
| Gross domestic expenditure on R&D (GERD) as a percentage of gross domestic product (GDP) | In 2006, GERD accounted for about 1.96 percent of the GDP. | ||
| University-industry collaboration in R&D | In 2006, the business enterprise funded about $899 million of the R&D performed by the higher-education sector, which is about 8.26 percent of the total R&D performed by universities. | ||
| Investment in venture capital | $1.94 billion invested in 397 Canadian companies | ||
| Competitive Industry and Sustainable Communities | |||
| Implementing strategic frameworks for priority industrial sectors that have an important impact on the Canadian economy Working with Canadians to position them to take advantage of economic opportunities, support business development, provide long-term growth and promote sustainable development |
|
Investment in machinery and equipment as a proportion of GDP | Statistics Canada data show that investment in machinery and equipment in Canada increased by about 8 percent in 2005 to $101.3 million (effective date for actual value 2005). |
| Use of information and communications technologies (ICTs) | Canada is 10th among OECD countries in the level of investment in ICTs and third among G-7 countries behind the U.S. and the U.K. (effective date for actual value 2005). | ||
5.1.2 Additional Information on User Fees (Table B)
Information on Additional Information on User Fees can be found at: http://www.tbs-sct.gc.ca/est-pre/estime.asp
5.1.3 Progress Against the Department's Regulatory Plan
| Regulations | Expected Results | Performance Measurement Criteria | Results Achieved |
|---|---|---|---|
| Industry Canada's Fees for Services Related to Telecommunications and Radio Equipment Fees – Introduction of new fees and revocation of existing fees for services offered by Industry Canada's Certification and Engineering Bureau. | The new fees will address the needs of the telecommunications market, as the existing fees have not been changed in more than 10 years and have become inappropriate. | Approval of proposal for new fees and revocation of existing fees | A proposal was tabled by the Minister of Industry Canada before the House of Commons (September 18, 2006) and the Senate (September 26, 2006). The proposal was deemed approved as of October 27, 2006, as recommended by the Senate Standing Committee on Transport and Communications. Industry Canada is proceeding with the remainder of the regulatory process to implement proposed fee changes. |
| Amendments to the Patented Medicines (Notice of Compliance) Regulations under the Patent Act | The amendments make it easier for generic drug companies to predict when they may enter the market with a lower-cost version of an innovative, patented drug. | Approval of the regulatory change by Cabinet | Cabinet approval of the regulatory change |
| Regulatory amendment to Schedule I of the Patent Act | The amendment added a triple-dose combination HIV-AIDS drug to the list of patented pharmaceutical products that are eligible to be exported to developing countries under Canada's Access to Medicines Regime. | Approval of the regulatory change by Cabinet | Cabinet approval of the regulatory change |
5.1.4 Details on Project Spending
Information on Details on Project Spending can be found at: http://www.tbs-sct.gc.ca/est-pre/estime.asp
5.1.5 Details on Transfer Payments Programs
Information on Transfer Payments Programs can be found at: http://www.tbs-sct.gc.ca/est-pre/estime.asp
5.1.6 Conditional Grants (Foundations)
Information on Conditional Grants (Foundations) can be found at: http://www.tbs-sct.gc.ca/est-pre/estime.asp
5.1.7 Horizontal Initiatives
Information on Horizontal Initiatives can be found at: http://www.tbs-sct.gc.ca/est-pre/estime.asp
5.1.8 Financial Statements of the Canadian Intellectual Property Office Revolving Fund
Management Report
We have prepared the accompanying financial statements of the Canadian Intellectual Property Office Revolving Fund (the "Fund") as required by and in accordance with the policy of Treasury Board on revolving funds and the reporting requirements and standards of the Receiver General for Canada. These financial statements were prepared by the management of the Fund in accordance with the significant accounting policies set out in Note 2 of the statements, on a basis consistent with that of the preceding year.
Responsibility for the integrity and objectivity of these financial statements rests with the management of the Fund. The information included in these financial statements is based on management's best estimates and judgement with due consideration given to materiality. To fulfil its accounting and reporting responsibilities, the Fund maintains a set of accounts, which provides a centralized record of the Fund's financial transactions. Financial information contained in the ministerial statements and elsewhere in the Public Accounts of Canada is consistent with that in these financial statements, unless indicated otherwise.
The Fund's directorate of financial services develops and disseminates financial management and accounting policies and issues specific directives, which maintain standards of accounting and financial management. The Fund maintains systems of financial management and internal control which gives due consideration to costs, benefits and risks. They are designed to provide reasonable assurance that transactions are properly authorized by Parliament, are executed in accordance with prescribed regulations, and are properly recorded to maintain accountability of Government funds and safeguard the assets under the Fund's administration. The Fund also seeks to assure the objectivity and integrity of data in its financial statements by the careful selection, training and development of qualified staff, by organizational arrangements that provide appropriate divisions of responsibility and by communication programs aimed at ensuring that its regulations, policies, standards and managerial authorities are understood throughout the organization.
At the request of the Fund, these financial statements have been examined by external auditors, their role being to express an opinion as to whether the financial statements present fairly the financial position as at March 31, 2007 and the results of operations and cash flow for the year then ended in accordance with the accounting principles for revolving funds of the Government of Canada as described in Note 2 to the financial statements.
Approved by:
Graham Frost
Director Planning, Finance & Administration
Andr� Rousseau CGA
Manager, Finance and Administration
June 19, 2007
Date
|
|
|||||
| (in thousands of dollars) |
2007
|
2006
|
|||
| Estimates | Actual | Estimates | Actual | ||
|
|
|||||
| Net results | $ 110 | $ 14,986 | $ 80 | $ 13,294 | |
| Add: items not requiring the use of funds | 8,719 | 5,517 | 11,003 | 7,843 | |
|
|
|||||
| Operating source (use) of funds | 8,829 | 20,503 | 11,083 | 21,137 | |
| Less: items requiring use of funds | |||||
| Net capital acquisitions | 6,000 | 4,515 | 8,500 | 7,571 | |
| Net other assets and liabilities | (4,890) | (12,494) | (13,039) | (14,032) | |
| Other items | - | - | - | - | |
|
|
|||||
| Authority provided (used) | $ 7,719 | $ 28,482 | $ 15,622 | $ 27,598 | |
|
|
|||||
|
|
||
| (in thousands of dollars) | 2007 | 2006 |
|
|
||
| Credit (debit) balance in the accumulated net charge against the Fund's authority | $ (110,844) | $ (131,695) |
| Transfer from Treasury Board Vote 5 | (264) | - |
| Supplementary Estimates | (390) | - |
|
|
||
| $ (111,498) | $ (131,695) | |
| Add: PAYE charges against the appropriation account after March 31 | 3,889 | 4,306 |
| Less: amounts credited to the appropriation account after March 31 | 1,565 | 1,393 |
| Other items | 3,020 | 6,018 |
|
|
||
| Net authority provided, end of year | (112,194) | (134,800) |
| Authority limit | 5,000 | 5,000 |
|
|
||
| Unused authority carry forward | $ 117,194 | $ 139,800 |
|
|
||
|
|
||||
| (in thousands of dollars) | 2007 | 2006 | ||
|
Assets |
||||
| Current | ||||
| Petty cash | 2 | 2 | ||
| Accounts receivable | ||||
| Government of Canada | 861 | 1,742 | ||
| Outside parties | 1,565 | 1,395 | ||
| Unbilled revenues | 7,259 | 6,071 | ||
| Prepaid expenses | 234 | 222 | ||
|
|
||||
| 9,921 | 9,432 | |||
| Capital assets (Note 3) | 17,461 | 26,368 | ||
| Unbilled revenues | 998 | 2,172 | ||
|
|
||||
| $ 28,380 | $ 37,972 | |||
| Liabilities | ||||
| Current | ||||
| Deposit accounts | 1,884 | 1,889 | ||
| Accounts payable | ||||
| Government of Canada | 1,841 | 2,797 | ||
| Outside parties | 6,997 | 6,692 | ||
| Deferred revenues | 37,160 | 29,498 | ||
|
|
||||
| 47,882 | 40,876 | |||
| Employee termination benefits and vacation pay | 8,464 | 7,035 | ||
| Deferred revenues | 46,891 | 44,370 | ||
|
|
||||
| 55,355 | 51,405 | |||
| Deferred capital assistance (Note 4) | 1,595 | 7,980 | ||
| Commitments (Note 6) | ||||
| Contingencies (Note 10) | ||||
| Net Assets / Liabilities (note 5) | (76,452) | (62,289) | ||
|
|
||||
| $ 28,380 | $ 37,972 | |||
|
|
||||
|
|
||||
| (in thousands of dollars) | 2007 | 2006 | ||
|
|
||||
| Revenues |
$ 138,258 | $ 124,722 | ||
| Expenses | ||||
| Salaries and employee benefits | 81,486 | 75,058 | ||
| Professional services | 20,751 | 15,149 | ||
| Amortization of capital assets | 13,369 | 14,777 | ||
| Accommodation | 7,625 | 6,952 | ||
| Materials and supplies | 1,921 | 1,780 | ||
| Information | 308 | 260 | ||
| Communications | 879 | 824 | ||
| Travel | 657 | 603 | ||
| Freight and postage | 383 | 309 | ||
| Repairs and maintenance | 1,140 | 1,234 | ||
| Training | 910 | 662 | ||
| Rentals | 175 | 205 | ||
| Loss on disposal of capital assets | 53 | - | ||
|
|
||||
| 129,657 | 117,813 | |||
| Net results before amortization of deferred capital assistance | 8,601 | 6,909 | ||
|
|
||||
| Amortization of deferred capital assistance | 6,385 | 6,385 | ||
|
|
||||
| Net results | 14,986 | 13,294 | ||
| Net assets (liabilities), beginning of year | (62,289) | (45,368) | ||
| Net financial resources used (provided) and change in the accumulated net charge against the Fund's authority account, during the year | 20,851 | (30,215) | ||
| Transfer of part of the accumulated surplus to the accumulated net charge against the Fund's authority (Note 1) | (50,000) | - | ||
|
|
||||
| Net assets (liabilities), end of year | $ (76,452) | $ (62,289) | ||
|
|
||||
|
|
||||
| (in thousands of dollars) | 2007 | 2006 | ||
|
Operating activities |
||||
| Net results | $ 14,986 | $ 13,294 | ||
| Add: Amortization of capital assets | 13,369 | 14,777 | ||
| Add: Loss on disposal of capital assets | 53 | - | ||
| Less: Amortization of deferred capital assistance | 6,385 | 6,385 | ||
|
|
||||
| 22,023 | 21,686 | |||
| Changes in working capital (Note 7) | 6,517 | 9,819 | ||
| Changes in other assets and liabilities | ||||
| Unbilled revenues | 1,174 | (992) | ||
| Employee termination benefits and vacation pay | 1,429 | 837 | ||
| Deferred revenues | 2,521 | 6,436 | ||
|
|
||||
| 5,124 | 6,281 | |||
|
|
||||
| Net financial resources provided by operating activities | 33,664 | 37,786 | ||
| Investing activities | ||||
| Capital assets acquired | (4,515) | (7,571) | ||
| Financing activities | ||||
| Transfer of part of the accumulated surplus to the accumulated net charge against the Fund's authority (Note 1) | (50,000) | - | ||
|
|
||||
| Net financial resources provided (used) and change in the accumulated net charge against the Fund's authority account, during the year | (20,851) | 30,215 | ||
| Accumulated net charge against the Fund's authority account, beginning of year | 131,695 | 101,480 | ||
|
|
||||
| Accumulated net charge against the Fund's authority account, end of year (Note 5) | $ 110,844 | $ 131,695 | ||
|
|
||||
Notes to Financial Statements
- Purpose and authority
The Canadian Intellectual Property Office Revolving Fund (the "Fund") grants or registers exclusive ownership of intellectual property in Canada. In exchange, the Fund acquires intellectual property information and state-of-the-art technology which it disseminates to Canadian firms, industries and individuals to improve economic performance, competitiveness and to stimulate further invention and innovation.
The Fund was established on April 1, 1994. The authority to make expenditures out of the Consolidated Revenue Fund, was granted on February 22, 1994 and has an authorized limit of $15 million. During the fiscal year ended March 31 2002, the Fund's authorized limit was reduced from $15 million to $5 million. The Fund has continuing non-lapsing authority from Parliament to make payments out of the Consolidated Revenue Fund for working capital, capital acquisitions and temporary financing of accumulated operating deficits. The Fund may retain surpluses to continue to automate operations.
Pursuant to Treasury Board decision # 833200 (Budget 2006 Spending Restraint), dated November 30, 2006 and effective in 2006-07, the Fund tranferred $50 million of its accumulated surplus to the accumulated net charge against the Fund's authority ("ANCAFA").
- Significant accounting policies
Basis of accounting
The financial statements have been prepared in accordance with the reporting requirements for revolving funds described by the Receiver General for Canada. The basis of accounting used in these financial statements differs from Canadian generally accepted accounting principles because: services received without charge from other government departments are not reported as expenses; the expenses and liability for termination benefits excludes the portion not funded by the Fund; and contingent liabilities are disclosed rather than recorded. The significant accounting policies are as follows:
Revenue recognition
Revenue derived from processing patent, trademark and industrial design applications is recognized using the percentage of completion method as work progresses. Fees received in advance of work being completed are recorded as deferred revenues. When work is completed prior to the receipt of the fee, the amount is recorded as unbilled revenue. Maintenance fees and other revenue are recognized upon receipt. Fees are prescribed by various Orders in Council.
Capital assets and amortization
Capital assets are recorded at cost. Capital assets are amortized on a straight-line basis over their estimated useful lives, beginning in the month after acquisition, as follows:
Software 3 years Hardware 3-5 years Furniture 10 years Equipment 10 years Leasehold Improvements 5 years Systems Estimated useful life, beginning in the year of deployment Deferred capital assistance
The Fund received $63,848,000 from the Crown for the development of the Techsource automation project, which was implemented in 1997-1998. The deferred capital assistance is amortized on a straight-line basis over the estimated useful life of the Techsource system.
Employee termination benefits
Employees of the Fund are entitled to specified termination benefits, calculated based on salary levels in effect at the time of termination as provided for under collective agreements and conditions of employment. Employee termination benefits earned prior to an employee joining the Revolving Fund are a liability of the Treasury Board and accordingly have not been recorded in the accounts. As at March 31, 2007, the Treasury Board liability for the Fund's employees is $4.8 million (2006 – $4.8 million). The liability for benefits earned after an employee joins the Revolving Fund is recorded in the accounts as the benefits accrue to employees.
The Treasury Board will only fund this portion of the past services up to and including the fifteenth year of the revolving fund's operation. In 2009-2010, the long-term liability account for termination benefits will be adjusted accordingly with an offset against the revolving fund's accumulated surplus.
Pension Plan
Employees of the Fund are covered by the Public Service Superannuation Plan administered by the Government of Canada. Under present legislation, contributions made by the Fund to the Plan are limited to an amount equal to the employee's contributions on account of current service. These contributions represent the total pension obligations of the Fund and are charged to operations on a current basis. The Fund is not required under present legislation to make contributions with respect to actuarial deficiencies of the Public Service Superannuation Account and/or with respect to charges to the Consolidated Revenue Fund for the indexation of payments under the Supplementary Retirement Benefits Act.
Use of Estimates
The preparation of financial statements in conformity with generally accepted accounting principles requires management to make estimates and assumptions that affect the reported amounts of assets and liabilities and disclosure of contingent assets and liabilities at the date of the financial statements and the reported amounts of revenues and expenses during the period. Capital assets, revenues and human resource related accrued liabilities are the most significant items for which estimates are used. Actual results could differ from these estimates. These estimates are reviewed annually and as adjustments become necessary, they are recorded in the financial statements in the period in which they become known.
- Capital assets and accumulated amortization
|
|
|||||||
| Cost March 31, 2006 |
Additions | Disposals | Cost March 31, 2007 |
Accumulated amortization | Net carrying value | ||
|
|
|||||||
| Leasehold improvements | 20,604 | 1,577 | 22,188 | 16,790 | 5,391 | ||
| Software | 7,906 | 1,631 | 9,537 | 7,035 | 2,502 | ||
| Hardware | 2,602 | 90 | 2,692 | 2,450 | 242 | ||
| Equipment | - | - | - | - | |||
| Furniture | - | - | - | - | |||
| Systems | |||||||
| Intrepid | 3,735 | 249 | 3,984 | 3,793 | 191 | ||
| TechSource | 85,535 | 2,705 | 88,240 | 83,550 | 4,690 | ||
| Other | 11,164 | 11,164 | 9,973 | 1,191 | |||
| Systems under development | 5,044 | (1,737) | 53 | 3,254 | 3,254 | ||
|
|
|||||||
| Total | 136,590 | 4,515 | 53 | 141,052 | 123,591 | 17,461 | |
|
|
|||||||
4. Deferred capital assistance
|
|
||
| (in thousands of dollars) | 2007 | 2006 |
|
|
||
| Deferred capital assistance contribution | $ 63,848 | $ 63,848 |
| Less: accumulated amortization | 62,253 | 55,868 |
|
|
||
| Net book value | $ 1,595 | $ 7,980 |
|
|
||
5. Net assets / liabilities
Accumulated net charge against the Fund's authority ("ANCAFA")
The accumulated net charge against the Fund's authority is the cash position of the Revolving Fund, held by the Government on behalf of the Revolving Fund.
Accumulated surplus
The accumulated surplus is an accumulation of each year's surpluses including the absorption of the opening deficit of $9,448,000 upon establishment of the Revolving Fund.
|
|
||
| (in thousands of dollars) | 2007 | 2006 |
|
|
||
| Accumulated surplus, beginning of year | $ 69,406 | $ 56,112 |
| Net results | $ 14,986 | $ 13,294 |
| Transfer of part of the accumulated surplus to the ANCAFA (Note 1) | $ (50,000) | $ - |
|
|
||
| Accumulated surplus, end of year | $ 34,392 | $ 69,406 |
| ANCAFA, end of year | $ (110,844) | $ (131,695) |
|
|
||
| Net assets / liabilities | $ (76,452) | $ (62,289) |
|
|
||
6. Commitments
(in thousands of dollars)
The Fund has commitments for:
Maintenance services for the TechSource System:
| 2008 | 6,170 |
| 2009 | 6,686 |
| 2010 | 7,247 |
|
|
|
| $ 20,103 |
Operating leases for its office premises:
| 2008 | 7,656 |
| 2009 | 4,847 |
| 2010 | 64 |
|
|
|
| $ 12,567 |
Applications development and maintenance support within the framework of the Continued Systems Improvements Program (CSIP):
| 2008 | 3,169 |
|
|
|
| $ 3,169 |
Access to online databases:
| 2008 | 216 |
|
|
|
| $ 216 |
7. Changes in working capital
Components of the changes in current assets and liabilities include:
|
|
||
| (in thousands of dollars) | 2007 | 2006 |
|
|
||
| Accounts receivable (net of bad debt) | $ 711 | $ (90) |
| Unbilled revenues (short term) | (1,188) | 1,437 |
| Prepaid expenses | (12) | (138) |
| Deposit accounts | (5) | 378 |
| Accounts payable | (651) | 2,088 |
| Deferred revenues (short term) | 7,662 | 6,144 |
|
|
||
| $ 6,517 | $ 9,819 | |
|
|
||
8. Related party transactions
Through common ownership, the Fund is related to all Government of Canada created departments, agencies and Crown corporations. Payments for accommodation, translation, legal services, compensation and benefits services, mail services, security services and mainframe and computing services are made to related parties in the normal course of business.
9. Insurance
The Fund does not carry insurance on its property. This is in accordance with the Government of Canada policy of self-insurance.
10. Contingencies
Sick Leave
Employees are permitted to accumulate unused sick leave. However, such leave entitlements do not vest and can be used only in the event of illness. The amount of accumulated sick leave entitlements which will become payable in future years cannot reasonably be determined and accordingly have not been recorded in the accompanying financial statements. Payments of sick leave benefits are included in current operations as incurred.
11. Income taxes
The Fund is not subject to income taxes.
5.1.9 Financial Statements of the Department of Industry
Statement of Management Responsibility
Responsibility for the integrity and objectivity of the accompanying financial statements for the year ended March 31, 2007 and all information contained in this report rests with departmental management. These statements have been prepared by management in accordance with Treasury Board accounting policies, which are consistent with Canadian generally accepted accounting principles for the public sector.
Management is responsible for the integrity and objectivity of the information in these financial statements. Some of the information in the financial statements is based on management's best estimates and judgement and gives due consideration to materiality. To fulfil its accounting and reporting responsibilities, management maintains a set of accounts that provides a centralized record of the department's financial transactions. Financial information submitted to the Public Accounts of Canada and included in the department's Departmental Performance Report is consistent with these financial statements.
Management maintains a system of financial management and internal control designed to provide reasonable assurance that financial information is reliable, that assets are safeguarded and that transactions are in accordance with the Financial Administration Act, are executed in accordance with prescribed regulations, within Parliamentary authorities, and are properly recorded to maintain accountability of Government funds. Management also seeks to ensure the objectivity and integrity of data in its financial statements by careful selection, training and development of qualified staff, by organizational arrangements that provide appropriate divisions of responsibility, and by communication programs aimed at ensuring that regulations, policies, standards and managerial authorities are understood throughout the department.
Management is supported by the Departmental Audit and Evaluation Committee (DAEC). This Committee approves the departmental audit and evaluation plan and oversees the internal audit and evaluation activities in the Department. It also reviews the results of audits and evaluations as well as management responses and action plans developed to address audit or evaluation recommendations.
The financial statements of the department have not been audited.
|
Deputy Head Ottawa, Canada |
Chief Financial Officer Date |
|
|
|||||||
| (in thousands of dollars) |
2007
|
2006
|
|||||
| Marketplace | Science, technology & innovation | Economic development | Total | Total | |||
|
|
|||||||
| Expenses | |||||||
| Transfer payments | |||||||
| Industry | - | 219,303 | 12,001 | 231,304 | 268,359 | ||
| Other | 8,139 | 270,000 | 218,650 | 496,789 | 392,494 | ||
|
|
|
||||||
| Total Transfer Payments | 8,139 | 489,303 | 230,651 | 728,093 | 660,853 | ||
|
|
|
||||||
| Operating expenses | |||||||
| Salaries and employee benefits | 267,278 | 108,838 | 139,079 | 515,195 | 517,821 | ||
| Professional and special services | 43,298 | 19,684 | 28,249 | 91,231 | 104,313 | ||
| Accommodation | 13,328 | 20,792 | 19,192 | 53,312 | 52,027 | ||
| Travel | 11,740 | 2,546 | 5,794 | 20,080 | 23,179 | ||
| Amortization | 10,708 | 5,325 | 2,211 | 18,244 | 17,126 | ||
| Communication | 7,887 | 4,333 | 5,996 | 18,216 | 18,189 | ||
| Furniture and equipment | 8,544 | 4,856 | 3,898 | 17,298 | 12,783 | ||
| Equipment repair and maintenance | 5,817 | 4,317 | 2,644 | 12,778 | 20,729 | ||
| Rentals | 9,268 | 448 | 1,258 | 10,974 | 10,185 | ||
| Utilities, materials and supplies | 3,548 | 3,750 | 2,496 | 9,794 | 10,923 | ||
| Postage | 1,270 | 1,241 | 376 | 2,887 | 1,986 | ||
| Loss on disposal of capital assets | 55 | 12 | 12 | 79 | 161 | ||
| Other operating expenses | 10,989 | (5,044) | (7,794) | (1,849) | 22,741 | ||
|
|
|
||||||
| Total operating expense | 393,730 | 171,098 | 203,411 | 768,239 | 812,163 | ||
|
|
|
||||||
| Transferred operations | |||||||
| Office of the Registrar of Lobbyists | - | - | - | - | 958 | ||
|
|
|
||||||
| Total expenses | 401,869 | 660,401 | 434,062 | 1,496,332 | 1,473,974 | ||
|
|
|
||||||
| Revenues | |||||||
| Sales of services | 591,037 | 10,041 | 63,546 | 664,624 | 640,004 | ||
| Dividends | 5,212 | 8,130 | 7,505 | 20,847 | 16,786 | ||
| Revenue from fines | 6,857 | - | - | 6,857 | 8,064 | ||
| Amortization of discounts | 254 | 395 | 3,823 | 4,472 | 4,473 | ||
| Other revenue | 623 | 702 | 1,923 | 3,248 | 4,234 | ||
| Gains on disposal of assets | 170 | 16 | 27 | 213 | 203 | ||
|
|
|
||||||
| 604,153 | 19,284 | 76,824 | 700,261 | 673,764 | |||
|
|
|
||||||
| Transferred operations | |||||||
| Office of the Registrar of Lobbyists | - | - | - | - | 2 | ||
|
|
|
||||||
| Total revenues | 604,153 | 19,284 | 76,824 | 700,261 | 673,766 | ||
|
|
|||||||
| Net cost of operations | (202,284) | 641,117 | 357,238 | 796,071 | 800,028 | ||
|
|
|||||||
The accompanying notes form an integral part of these financial statements.
|
|
|||
| (in thousands of dollars) | 2007 | 2006 | |
|
Assets |
|||
| Financial assets | |||
| Accounts receivables and advances (Note 4) | 215,227 | 193,915 | |
| Loans (Note 5) | 280,303 | 266,053 | |
| Investments (Note 6) | 1,066,400 | 1,066,400 | |
|
|
|||
| Total financial assets | 1,561,930 | 1,526,368 | |
|
|
|||
| Non-financial assets | |||
| Prepayments | 234 | 222 | |
| Tangible capital assets (Note 7) | 107,674 | 97,464 | |
|
|
|||
| Total non-financial assets | 107,908 | 97,686 | |
|
|
|||
| Total | 1,669,838 | 1,624,054 | |
|
Liabilities |
|||
| Accounts payable and accrued liabilities (Note 8) | 627,073 | 495,229 | |
| Vacation and compensatory leave | 24,149 | 25,872 | |
| Deferred revenue (Note 9) | 1,125,237 | 1,285,782 | |
| Allowance for loan guarantee (Note 12) | 409,828 | 432,444 | |
| Allowance for employee severance benefits (Note 11) | 83,557 | 79,341 | |
| Other liabilities (Note 10) | 25,163 | 19,537 | |
|
|
|||
| 2,295,007 | 2,338,205 | ||
| Equity of Canada (Note 13) | (625,169) | (714,151) | |
|
|
|||
| Total | 1,669,838 | 1,624,054 | |
|
|
|||
Contingent liabilities (Note 12)
Contractual obligations (Note 14)
The accompanying notes form an integral part of these financial statements.
|
|
||
| (in thousands of dollars) | 2007 | 2006 |
|
|
||
| Equity of Canada, beginning of year | (714,151) | (1,091,473) |
| Net cost of operations | (796,071) | (800,208) |
| Current year appropriations used (Note 3) | 1,189,667 | 1,617,037 |
| Revenue not available for spending | (502,866) | (491,458) |
| Change in net position in the Consolidated Revenue Fund (Note 3) | 116,783 | (27,806) |
| Services provided without charge by other government departments (Note 15) | 84,829 | 79,757 |
| Equity adjustment (Note 13) | (3,360) | - |
|
|
||
| Equity of Canada, end of year | (625,169) | (714,151) |
|
|
||
The accompanying notes form an integral part of these financial statements.
|
|
|||
| (in thousands of dollars) | 2007 | 2006 | |
|
Operating activities |
|||
| Net cost of operations | 796,071 | 800,208 | |
| Non-cash items: | |||
| Amortization of tangible capital assets | (18,244) | (18,189) | |
| Gain on disposal and write-down of tangible capital assets | 59 | 43 | |
| Loss on writeoffs of tangible capital assets | - | (2,795) | |
| Adjustment to tangible capital assets | (421) | 189 | |
| Services provided without charge (Note 15) | (84,829) | (79,757) | |
| Variations in Statement of Financial Position: | |||
| Decrease in liabilities | 43,198 | 265,902 | |
| Increase in financial assets | 35,562 | 108,214 | |
| Increase in prepaid expenses | 12 | 138 | |
| Change in equity (Note 13) | 3,346 | - | |
|
|
|||
| Cash used by operating activities | 774,754 | 1,073,953 | |
|
|
|||
| Capital investment activities | |||
| Acquisitions of tangible capital assets | 29,090 | 24,051 | |
| Proceeds from disposal of tangible capital assets | (260) | (231) | |
|
|
|||
| Cash used by capital investment activities | 28,830 | 23,820 | |
|
|
|||
| Net cash provided by Government of Canada | 803,584 | 1,097,773 | |
|
|
|||
The accompanying notes form an integral part of these financial statements.
Industry Canada
Notes to the Financial Statements (Unaudited)
- Authority and Objectives
The authorities for the programs for which Industry Canada is responsible, are derived from the Department of Industry Act. Many other acts are under the responsibility of the Minister of Industry, and Treasury Board also defines other specific Industry authorities.
Industry Canada aims to help Canadians contribute to the knowledge economy and improve productivity and innovation performance through its three strategic outcomes, which are mutually reinforcing. Sound marketplace frameworks help establish a business environment that supports innovation, investment and entrepreneurial activity. Fostering innovation in science and technology helps ensure that discoveries and breakthroughs happen here in Canada, and that the social and economic benefits of these innovations contribute to improving Canadians' standard of living and quality of life. Encouraging investment in technology will help Canadian businesses to compete in the global marketplace and increase opportunities for trade. Successful businesses combined with a sound environment form the sustainable communities that attract investment. Taken together, the Department's strategic outcomes support growth in employment, income and productivity, and promote sustainable development in Canada.
Industry Canada's activities are delivered at its headquarters in Ottawa as well as in the regions. There are six regional offices with service points located across Canada.
Industry Canada has a number of transfer payment programs through which it provides grants and contributions to recipients in targeted groups and sectors. Each transfer payment program has specific objectives and expected results that support the achievement of Industry Canada's strategic objectives.
-
Summary of Significant Accounting Policies
The financial statements have been prepared in accordance with Treasury Board accounting policies, which are consistent with Canadian generally accepted accounting principles for the public sector.
Significant accounting policies are as follows:- Parliamentary appropriations
Industry Canada is financed through Parliamentary appropriations. Appropriations provided to the department do not parallel financial reporting according to generally accepted accounting principles since appropriations are primarily based on cash flow requirements. Consequently, items recognized in the statement of operations and the statement of financial position are not necessarily the same as those provided through appropriations from Parliament. Note 3 provides a high-level reconciliation between the bases of reporting.
- Consolidation
The financial statements include the accounts of Industry Canada including the revolving fund Canadian Intellectual Property Office (CIPO) and special operating agencies Measurement Canada, Superintendent of Bankruptcy and Technology Partnerships Canada. The accounts of these sub-entities have been consolidated with those of the department and all inter-organizational balances and transactions have been eliminated. The department's investment in the Business Development Bank of Canada (BDBC) is recorded at cost. The net results of the BDBC are not consolidated in these financial statements as the department is not deemed to control the Crown corporation.
- Net cash provided by government
Industry Canada operates within the Consolidated Revenue Fund (CRF), which is administered by the Receiver General for Canada. All cash received by Industry Canada is deposited to the CRF and all cash disbursements made by the department are paid from the CRF. The net cash provided by Government is the difference between all cash receipts and all cash disbursements including transactions between departments of the federal government.
- Change in net position in the Consolidated Revenue Fund
This is the difference between the net cash provided by Government and appropriations used in a year, excluding the amount of non-respendable revenue recorded by the department. It results from timing differences between when a transaction affects appropriations and when it is processed through the CRF.
- Revenue
- Revenues from regulatory fees are recognized in the accounts based on the services provided in the year.
- Funds received from external parties for specified purposes are recorded upon receipt as deferred revenues. These revenues are recognized in the period in which the related expenses are incurred.
- Other revenues are accounted for in the period in which the underlying transaction or event occurred that gave rise to the revenues.
- Revenues that have been received but not yet earned are recorded as deferred revenues.
- Expense
The following expenses are recorded on the accrual basis:- Grants are recognized in the year in which the conditions for payment are met. In the case of grants which do not form part of an existing program, the expense is recognized when the Government announces a decision to make a non-recurring transfer, provided the enabling legislation or authorization for payment receives parliamentary approval prior to the completion of the financial statements;
- Contributions are recognized in the year in which the recipient has met the eligibility criteria or fulfilled the terms of a contractual transfer agreement;
- Vacation pay and compensatory leave are expensed as the benefits accrue to employees under their respective terms of employment.
- Services provided without charge by other government departments for accommodation, the employer's contribution to the health and dental insurance plans and worker's compensation costs and legal services are recorded as operating expenses at their estimated cost.
- Employee future benefits
- Pension benefits: Eligible employees participate in the Public Service Pension Plan, a multi-employer plan administered by the Government of Canada. The department's contributions to the Plan are charged to expenses in the year incurred and represent the total departmental obligation to the Plan. Current legislation does not require the department to make contributions for any actuarial deficiencies of the Plan.
- Severance benefits: Employees are entitled to severance benefits under labour contracts or conditions of employment. These benefits are accrued as employees render the services necessary to earn them. The obligation relating to the benefits earned by employees is calculated using information derived from the results of the actuarially determined liability for employee
severance benefits for the Government as a whole.
- Receivables
Receivables are stated as amounts expected to be ultimately realized. A provision is made for receivables where recovery is considered uncertain.
- Allowances for loan guarantees
An allowance for loan guarantees is recorded for potential losses on loan guarantees when it is likely that a payment will be made in the future to honour a guarantee and when the amount of the loss can be reasonably estimated.
The allowance for losses on outstanding loan guarantees is based upon forecasting models developed by program areas.
- Repayable contributions
Repayable contributions are contributions the recipient is expected to repay. Depending on their nature, they are classified as either unconditionally repayable or conditionally repayable and are accounted for differently.- Unconditionally repayable contributions are contributions that must be repaid without qualification. Normally, these contributions are provided with a low or no interest clause. They are recorded on the Statement of Financial Position as loans at their estimated present value, if they contain significant concessionary terms (defined to be when the grant portion is greater than 25% of the contribution). Otherwise, they are recorded at the face value of the loan. A portion of the unamortized discount is brought into income each year to reflect the change in the present value of the contributions outstanding. Appropriate allowances for uncollectible amounts are also established based on an individual appraisal of accounts.
- Conditionally repayable contributions are contributions that, all or a part of become repayable, if conditions specified in the contribution agreement come into effect. Accordingly, they are not recorded on the Statement of Financial Position until such time as the conditions specified in the agreement are satisfied, at which time they are then recorded as a receivable and
a corresponding reduction in transfer payment expense.
- Prepaid expenses
Includes prepaid expenses, deferred charges, and payments where, pursuant to a contract or contribution agreement, a payment is made before the completion of the work, delivery of the goods or rendering of the service.
- Contingent liabilities
Contingent liabilities are potential liabilities, which may become actual liabilities when one or more future events occur or fail to occur. To the extent that the future event is likely to occur or fail to occur, and a reasonable estimate of the loss can be made, an estimated liability is accrued and an expense recorded. If the likelihood is not determinable or an amount cannot be reasonably estimated, the contingency is disclosed in the notes to the financial statements.
- Environmental liabilities
Environmental liabilities reflect the estimated costs related to the management and remediation of environmentally contaminated sites. Based on management's best estimates, a liability is accrued and an expense recorded when the contamination occurs or when the department becomes aware of the contamination and is obligated, or is likely to be obligated to incur such costs. If the likelihood of the department's obligation to incur these costs is not determinable, or if an amount cannot be reasonably estimated, the costs are disclosed as contingent liabilities in the notes to the financial statements.
- Foreign currency transactions
Transactions involving foreign currencies are translated into Canadian dollar equivalents using rates of exchange in effect at the time of those transactions. Monetary assets and liabilities denominated in a foreign currency are translated into Canadian dollars using the rate of exchange in effect on September 30th.
- Tangible capital assets
All tangible capital assets and leasehold improvements having an initial cost of $10,000 or more are recorded at their acquisition cost. The department does not capitalize intangibles, works of art and historical treasures that have cultural, aesthetic or historical value; assets located on Indian Reserves and museum collections.
Amortization of tangible capital assets is done on a straight-line basis over the estimated useful life of the asset as follows:
Asset class Amortization period
Buildings 15 to 30 years Works and infrastructure 30 years Machinery and equipment 3 to 10 years Vehicles 5 to 10 years Assets under construction Once in service, in accordance with asset type Leasehold improvements Lesser of the remaining term of the lease or useful life of the improvement
- Measurement uncertainty
The preparation of these financial statements in accordance with Treasury Board accounting policies which are consistent with Canadian generally accepted accounting principles for the public sector requires management to make estimates and assumptions that affect the reported amounts of assets, liabilities, revenues and expenses reported in the financial statements. At the time of preparation of these statements, management believes the estimates and assumptions to be reasonable. The most significant items where estimates are used are contingent liabilities, environmental liabilities, the liability for employee severance benefits and the useful life of tangible capital assets. Actual results could significantly differ from those estimated. Management's estimates are reviewed periodically and, as adjustments become necessary, they are recorded in the financial statements in the year they become known.
- Parliamentary appropriations
-
Parliamentary appropriations
Industry Canada receives most of its funding through annual Parliamentary appropriations. Items recognized in the statement of operations and the statement of financial position in one year may be funded through Parliamentary appropriations in prior, current or future years. Accordingly, the Department has different net results of operations for the year on a government-funding basis than on an accrual accounting basis. The differences are reconciled in the following tables:(a) Reconciliation of net cost of operations to current year appropriations used:
(in thousands of dollars) 2007 2006
Net cost of operations 796,071 800,208 Adjustments for items affecting net cost of operations but not affecting appropriations: Add (Less): Revenue not available for spending 502,866 491,458 Repayment of conditionally repayable contributions 127,356 110,382 Services provided without charge (84,829) (79,757) Allowance for loan guarantees 58,709 (42,157) Bad debts/writeoffs/writedowns 3,261 (24,063) Amortization of tangible capital assets (18,244) (18,189) Employee severance benefits (4,216) (9,829) Payables at year-end 8,455 9,512 Refund of previous year expenses 9,343 9,419 Justice Canada fees (5,425) (5,313) Allowance for accrued liabilities 288 602 Vacation pay and compensatory leave 1,387 (368) (Loss) on disposal and writedown of tangible capital assets (154) (161) Year-end accrual of transfer payments (246,000) - Other 561 (1,614)
1,149,429 1,240,130
Adjustments for items not affecting net cost of operations but affecting appropriations: Add (Less): Payment of transfer payments to foundations - 225,000 Loans, Investments, and Advances 21,776 140,941 Deferred revenue (10,964) (13,347) Acquisitions of tangible capital assets 29,090 24,051 Allowance for Vacation Pay 336 262
40,238 376,907
Current Year Appropriation Used 1,189,667 1,617,037
(b) Appropriations provided and used
(in thousands of dollars) 2007 2006
Vote 1 – Operating expenditures 436,697 484,902 Vote 5 – Capital expenditures 32,265 19,865 Vote 10 – Grants and contributions 682,194 830,476 Statutory amounts 235,115 489,430
1,386,271 1,824,673 Less: Appropriations available for future years (117,434) (140,031) Lapsed appropriations: Operating (79,170) (67,605)
Current year appropriations used 1,189,667 1,617,037
(c) Reconciliation of net cash provided by Government to current year appropriations used
(in thousands of dollars) 2007 2006
Net cash provided by Government of Canada 803,584 1,097,773 Revenue not available for spending 502,866 491,458
1,306,450 1,589,231
Change in net position in the Consolidated Revenue Fund Variation in financial assets (35,562) (108,214) Variation in liabilities (43,198) (265,902) Variation in prepaid expenses (12) (138) Other: Year-end accrual of transfer payments (246,000) - Repayment of conditionally repayable contributions 127,356 110,382 Allowance for loan guarantees 58,709 (42,157) Loans, investments and advances 21,776 140,941 Payment of transfer payments to foundations - 225,000 Miscellaneous 148 (32,106)
Change in net position in the Consolidated Revenue Fund (116,783) 27,806
Current year appropriation used 1,189,667 1,617,037
- Accounts receivables and advances
(in thousands of dollars) 2007 2006
ExternalAccounts receivable – other revenue 66,788 115,471 Allowance for doubtful accounts (31,442) (108,422) Accrued receivables 21,720 20,963 Employee advances 115 121 Other 735 102
Total external 57,916 28,235
Receivables from other Federal Government departments and agencies 157,311 165,680
Total accounts receivable and advances 215,227 193,915
- Loans
(in thousands of dollars) 2007 2006
Atlantic Development Board for Water Projects - 39 Atlantic Provinces Power Development Act
1,783 2,862 Enterprise Development Loans 110,000 110,000 Unamortized discount loans (34,583) (38,041)
75,417 71,959
Unconditionally repayable contributions 209,568 200,067 Less: Unamortized discount (6,275) (7,289) Less: Allowance for doubtful loans and advances (190) (1,585)
Net unconditionally repayable contributions 203,103 191,193
Loans and advances on expired loan guarantees 84,454 117,372 Less: Allowance for doubtful loans (84,454) (117,372)
Net loans on expired loan guarantees - -
Total loans 280,303 266,053
- Atlantic Development Board for Water Projects
Loans have been made to finance certain water projects that were carried over from the Atlantic Development Board. Final instalments were made in April 2006.
- Atlantic Provinces Power Development Act
Loans have been made to Atlantic Provinces, to assist in the generation of electrical energy by steam-driven generators in the provinces, and in the control and transmission of electric energy. The loans bear interest at rates from 4.5% to 8.5% per annum, and are repayable in annual instalments over the next 7 years, with final instalments due March 31, 2014.
- Enterprise development loans
These loans are made to industries engaged in manufacturing, processing or service industries in Canada in order to promote the establishment, improvement, growth, efficiency or international competitiveness of such industries, or to assist them in their financial restructuring. There is one interest-free loan outstanding which is repayable at maturity on April 1, 2017.
- Unconditionally repayable contributions
The unamortized discount on unconditionally repayable contributions is calculated by applying the 25% rule on an individual loan basis.
- Loans on expired loan guarantees
The Department guarantees loans to small business enterprises under the Small Business Loans Act, the Canada Small Business Financing Act, the Capital Leasing Pilot Project and other loan guarantee payments net of recoveries.
- Atlantic Development Board for Water Projects
- Investments
(in thousands of dollars) 2007 2006
Business Development Bank of Canada 1,066,400 1,066,400
Total investments 1,066,400 1,066,400
- Business Development Bank of Canada
The Corporation is an agent of Her Majesty, reports through the Minister of Industry, and is listed in Part I of Schedule III of the Financial Administration Act. Included in the account are:- Common Shares – The Government's investment in the common shares of the Corporation represents a book value of $808.4 million.
- Preferred Shares – The outstanding book value of preferred shares purchased pursuant to Section 23 of the Business Development Bank of Canada Act as at March 31, 2004 is $230 million.
- Contributed Capital – Contributed capital in the amount of $28 million was issued in 1999-2000 in counterpart of the transfer of the Cultural Industries Development Fund to the Corporation.
- Business Development Bank of Canada
- Tangible capital assets
(in thousands of dollars)
Cost Tangible capital asset class Opening balance
April 1Acquisitions during the year Disposals/ writeoffs, during the year Closing balance
March 31Land 1,450 - - 1,450 Buildings 35,112 440 - 35,552 Works and infrastructure 6,165 13 - 6,178 Machinery and equipment 127,783 14,616 1,711 140,688 Vehicles 12,427 1,074 1,134 12,367 Assets under construction 20,278 10,322 125 30,475 Leasehold improvements 17,985 2,625 - 20,610 Total 221,200 29,090 2,970 247,320
Accumulated amortization Tangible capital asset class Opening balance
April 1Amortization Disposals/ writeoffs, during the year Closing balance
March 31Current year net book value Previous year net book value Land - - - - 1,450 1,450 Buildings 17,508 1,260 - 18,768 16,784 17,604 Works and infrastructure 3,647 209 - 3,856 2,322 2,518 Machinery and equipment 88,604 12,806 1,260 100,150 40,538 39,179 Vehicles 8,378 1,341 1,074 8,645 3,722 4,049 Assets under construction - - - - 30,475 20,278 Leasehold improvements 5,599 2,628 - 8,227 12,383 12,386 Total 123,736 18,244 2,334 139,646 107,674 97,464 Amortization expense for the year ended March 31, 2007 is $18,244,139 (2006 – $18,189,357).
- Accounts payable and accrued liabilities
(in thousands of dollars) 2007 2006
ExternalAccounts payable 362,025 471,244 Accrued salaries and wages 10,158 10,699 Accrued liabilities 332 620 Transfer payments 246,000 - Other external payables 91 463
Total external
618,606 483,026 Other government departments 8,467 12,203
Total accounts payable and accrued liabilities 627,073 495,229
-
Deferred revenue
The majority of the department's deferred revenues result from the auction of radio licence frequencies. These revenues are recognized over a ten-year period. Another main source of deferred revenues comes from examination requests of intellectual property. These fees are charged in advance and recognized as revenue once the exam is completed.
Prime Minister's Awards were established to record amounts deposited by external parties to be used in support of the Prime Minister's Awards for Teaching Excellence.
(in thousands of dollars) 2007 2006
Opening balance 1,285,782 1,429,041 Licence fees received 203,159 201,715 Licence fees earned (373,750) (358,742)
(170,591) (157,027)
Fees for trademarks, patents and copyrights received 31,722 30,913 Fees for trademarks, patents and copyrights earned (21,540) (18,333)
10,182 12,580
Other services of regulatory nature received 763 1,400 Other services of regulatory nature earned (767) (453)
(4) 947
Prime Minister awards received - 50 Prime Minister awards disbursed (125) (190)
(125) (140)
Customer deposits received 55,593 51,676 Customer deposits disbursed (55,600) (51,295)
(7) 381
Deferred revenue, closing balance 1,125,237 1,285,782
-
Other Liabilities
Other liabilities represent funds received from third parties to be disbursed for a specified purpose. Activity during the year in these accounts is as follows:
(in thousands of dollars) Opening balance Receipts Payments Closing balance
Cost sharing projects 536 682 308 910 Securities in trust, Bankruptcy and Insolvency Act 83 - - 83 Contra – Securities in trust, Bankruptcy and Insolvency Act (31) - - (31) Unclaimed dividends and undistributed assets 13,359 2,995 1,245 15,109 Petro Canada enterprises unclaimed shares 963 - 2 961 Canada Business Corporations Act 3,999 3,403 96 7,306 Winding-up Act 530 197 - 727 Canada/provinces business service centre 98 400 400 98
Total other liabilities 19,537 7,677 2,051 25,163
Cost sharing projects – Industry Canada partners with other governments and external organizations to deliver programs and services that contribute to an innovative economy. The account was established to record amounts deposited by these partners.
Securities in trust and income from securities in trust, Bankruptcy and Insolvency Act – was established to record dividends paid on shares held by a bankrupt stockbroker on behalf of clients. As the shares were not registered in clients' names, dividends are paid to the last registered owner, in this case, the stockbroker. These dividends are forwarded to the Superintendent of Bankruptcy until such time as rightful owners are identified.
Unclaimed dividends and undistributed assets, Bankruptcy and Insolvency Act – This account represents amounts credited to the Receiver General in accordance with the provisions of the Act, pending distribution to creditors.
Petro-Canada Enterprises Inc. – unclaimed shares – was established to record the liability to shareholders who have not presented their shares for payment in accordance with Section 227 of the Canada Business Corporations Act.
Unclaimed dividends and undistributed assets, Canada Business Corporations Act – was established for the purpose of recording liabilities to creditors and shareholders who have not been located. The account is charged when funds are paid to them.
Winding-up Act – records deposits credited to the Receiver General as a result of the final winding-up of the operations of a company, in accordance with sections 138 and 139 of the Winding-up Act, pending distribution to the persons entitled thereto.
Canada/Provinces Business Service Centre – was established to record monies received from other provinces under cost-sharing agreements for the Canada-Ontario Business Service Centre.
-
Employee benefits
- Pension benefits
Industry Canada's employees participate in the Public Service Pension Plan, which is sponsored and administered by the Government of Canada. Pension benefits accrue up to a maximum period of 35 years at a rate of 2 percent per year of pensionable service, times the average of the best five consecutive years of earnings. The benefits are integrated with Canada/Qu�bec Pension Plans benefits and they are indexed to inflation.
Both the employees and the department contribute to the cost of the Plan. The 2006-07 expense amounts to $51,811,249 ($56,994,775 in 2005-06), which represents approximately 2.2 times (2.6 in 2005-06) the contributions by employees.
The department's responsibility with regard to the Plan is limited to its contributions. Actuarial surpluses or deficiencies are recognized in the financial statements of the Government of Canada, as the Plan's sponsor.
- Severance benefits
The department provides severance benefits to its employees based on eligibility, years of service and final salary. These severance benefits are not pre-funded. Benefits will be paid from future appropriations. Information about the severance benefits, measured as at March 31, is as follows:
(in thousands of dollars) 2007 2006
Accrued benefit obligation beginning of year 79,341 69,512 Expense for the year 13,297 17,137 Benefits paid during the year (9,081) (7,308)
Accrued benefit obligation end of year 83,557 79,341
- Pension benefits
-
Contingent liabilities
- Contaminated sites
Liabilities are accrued to record the estimated costs related to the management and remediation of contaminated sites where the department is obligated or likely to be obligated to incur such costs. The department has identified 2 sites where such action is possible and for which a liability of $132,281 has been recorded. The department's ongoing efforts to assess contaminated sites may result in additional environmental liabilities related to newly identified sites, or changes in the assessments or intended use of existing sites. These liabilities will be accrued by the department in the year in which they become known.
- Claims and litigation
Claims have been made against the department in the normal course of operations. Legal proceedings for claims totalling approximately $200,000 were still pending at March 31, 2007. Some of these potential liabilities may become actual liabilities when one or more future events occur or fail to occur. To the extent that the future event is likely to occur or fail to occur, and a reasonable estimate of the loss can be made, an estimated liability is accrued and an expense recorded in the financial statements.
- Loan guarantees
The department has guaranteed the following debts:
(in thousands of dollars) Authorized Limit Loan Guarantee Outstanding Balance Enterprise Development Program 1,200,000 212 Small Business Loans Act
Loan Guarantee Program1,798,828 74,874 Canada Small Business Financing Act
Loan Guarantee Program1,194,756 770,278 Capital Leasing Pilot Project 15,083 11,921 Air Carrier Loan Guarantee 931,350 176,962 Regional Aircraft Credit Facility 1,500,000 211,135 An allowance of $409,828,101 has been recorded for estimated losses on outstanding loan guarantees ($432,443,624 in 2006). The expenses related to loan guarantees are reported under other transfer payments in the Statement of Operations.
Enterprise Development Program – Loans are made to Canadian manufacturers and members of the service industry for the purpose of promoting the establishment, growth, efficiency and international competitiveness of Canadian industry. These loans also foster the expansion of Canadian industry and of Canadian trade to a person engaged or about to engage in manufacturing, processing or other commercial activity.
Small Business Loans Act (SBLA) Loan Guarantee Program and Canada Small Business Financing Act (CSBFA) Loan Guarantee Program – Loans are made directly by approved lenders to small business enterprises, providing for sharing of each individual loan loss, if any, on the basis of 85% government, 15% lender, to an aggregate, per lending institution not exceeding the Minister's contingent liability, as stated in Section 5 of the SBLA and Section 6(2) of the CSBFA.
The authorized limit represents the Crown's maximum liability incurred on the aggregate amount of loans made by the lender starting in April 1985 (SBLA) and April 1999 (CSBFA).
The outstanding guarantee for loans made starting in April 1985 (SBLA) and April 1999 (CSBFA) is the lesser of the Crown's net liability (authorized limit less claims paid by the Crown) or the outstanding loan amounts of the lenders.
Capital Leasing Pilot Project (CLPP) – Capital leases are entered directly by approved lenders to small business enterprises, providing for sharing of each individual lease loss, if any, on the basis of 85% government, 15% lessor to an aggregate, per leasing institution, not exceeding the Minister's contingent liability based upon the aggregate amount of leases registered per leasing institution, as stated in section 7 of the CLPP.
The authorized limit represents the Crown's maximum liability incurred on the aggregate amount of the capital leases having been entered or transferred since the period starting in April 2002.
The outstanding guarantee for capital leases entered into in April 2002, is the lesser of the Crown's net liability or the outstanding capital lease amount of the lessors.
Air Carrier Loan Guarantees – To provide for insurance of the financial obligations incurred by the purchaser resulting in an arrangement with a vendor, lessor or lender for the purchase of a deHavilland DHC-7 and DHC-8 aircraft.
Regional Aircraft Credit Facility – The department has extended loan guarantees on several Air Canada regional jets. Provisioning from the Canada Account Loss Provisioning Pool has been set aside by Finance Canada, manager of the funds. The loan guarantees began in the summer of 2005 and have a life of 15 years.
- Contaminated sites
- Equity Adjustment
(in thousands of dollars) 2007 2006
Aboriginal Business Canada / First Nations SchoolNet 3,346 - Office of the Registrar of Lobbyists 14 -
Total equity adjustment 3,360 -
Aboriginal Business Canada / First Nations SchoolNet – Pursuant to the Order in Council P.C. 2006-1351, an equity adjustment in the amount of $3,345,741 was processed to transfer out Aboriginal Business Canada and First Nations SchoolNet. The Order in Council transferred the control and supervision of Aboriginal Business Canada and First Nations SchoolNet from the Department of Industry to the Department of Indian Affairs and Northern Development (DIAND) effective December 1, 2006. The result was a mid-year transfer occurring the same date as the Order in Council, which included accounts receivable, capital assets and loan balances.
Office of the Registrar of Lobbyists – An equity adjustment for $14,335 related to Order in Council P.C. 2006-49, which transferred the control and supervision of the Office of the Registrar of Lobbyists from the Minister of Industry to the President of the Treasury Board effective February 6, 2006. As of April 1, 2006, Office of the Registrar of Lobbyists was reported separately. The adjustment pertained to the transfer of a capital asset that is reported on the Office of the Registrar of Lobbyists's financial statements.
- Contractual obligations
The nature of the department's activity results in some large multi-year contracts and obligations whereby the department will be committed to make future payments when the services/goods are rendered. Major commitments that can be reasonably estimated are as follows:
(in thousands of dollars) 2008 2009 2010 2011 Thereafter Total
Transfer payments 478,016 360,212 229,920 114,769 97,400 1,280,317 Other goods and services 43,193 12,272 1,143 335 3,639 60,582 Other 7,596 100 - - - 7,696
Total 528,805 372,584 231,063 115,104 101,039 1,348,595
- Related party transactions
Industry Canada is related as a result of common ownership to all Government of Canada departments, agencies, and Crown corporations. Industry Canada enters into transactions with these entities in the normal course of business and on normal trade terms. Also, during the year, the department received services, which were obtained without charge from other Government departments.
Services provided without charge:
During the year the department received without charge from other departments, accommodation, legal fees and the employer's contribution to the health and dental insurance plans. These services without charge have been recognized in the department's Statement of Operations as follows:
(in thousands of dollars) 2007 2006
Accommodation provided by Public Works and Government Services Canada (PWGSC) 53,312 52,027 Contributions covering employees' share of insurance premiums and expenditures paid by Treasury Board Secretariat 25,594 22,799 Workman's compensation coverage provided by Human Resources Skills Development Canada 627 449 Salary and associated expenditures of legal services provided by Justice Canada 5,296 4,482
Total services provided without charge 84,829 79,757
The Government has structured some of its administrative activities for efficiency and cost-effectiveness purposes so that one department performs these on behalf of all without charge. The costs of these services, which include payroll and cheque issuance services provided by Public Works and Government Services Canada and audit services provided by the Office of the Auditor General, are not included as an expense in the department's Statement of Operations.
- Comparative information
Comparative figures have been reclassified to conform to the current year's presentation.
5.1.10 Procurement and Contracting
Information on Procurement and Contracting can be found at: http://www.tbs-sct.gc.ca/est-pre/estime.asp
5.1.11 Client-Centred Service
Information on Client-Centred Service can be found at: http://www.tbs-sct.gc.ca/est-pre/estime.asp
5.1.12 Travel Policies
Information on Travel Policies can be found at: http://www.tbs-sct.gc.ca/est-pre/estime.asp
5.1.13 Storage Tanks
Information on Additional Information on User Fees can be found at: http://www.tbs-sct.gc.ca/est-pre/estime.asp
5.2 Results Information for Sub-Program and Sub-Sub-Program Activities by Strategic Outcome
- 5.2.1 A Fair, Efficient and Competitive Marketplace
- 5.2.2 An Innovative Economy
- 5.2.3 Competitive Industry and Sustainable Communities
5.2.1 A Fair, Efficient and Competitive Marketplace
This section provides information on each of the sub-program and sub-sub-program activities identified in Industry Canada's Program Activity Architecture. Activities are listed by the program activity and strategic outcome to which they contribute. Information on these program activities and the departmental strategic outcomes is provided in sections 1 and 2 of this document. By working to achieve the expected results for these activities, Industry Canada makes progress toward achieving results at the program activity and strategic outcome levels, and therefore toward fulfilling its mandate.
| Strategic Outcome | |
| A fair, efficient and competitive marketplace | |
| Program Activity: Policy Sector – Marketplace | |
| Sub-Program Activity: Marketplace Framework Policy Branch | |
| Development of legislative and/or regulatory policies pertaining to corporate insolvency and intellectual property to ensure that the marketplace framework laws are responsive to market needs | |
| Expected Result: Development of policy to support legislative and regulatory initiatives | |
| Performance Indicator | Results |
|
|
| Sub-Program Activity: Strategic Policy Branch | |
| Development of strategic frameworks for the marketplace | |
| Expected Result: Integration of departmental and governmental objectives into the development of marketplace policies | |
| Performance Indicator | Results |
|
|
| Sub-Program Activity: Micro-Economic Policy Analysis Branch | |
| Micro-economic analysis in support of marketplace policy development | |
| Expected Result: High-quality micro-economic research and analysis of significant policy issues as input to policy development | |
| Performance Indicators | Results |
| Number of: | |
|
|
|
|
|
|
|
|
|
|
| Sub-Program Activity: Small Business Policy Branch | |
| Research, analysis and action on regulatory compliance issues affecting SMEs | |
|
Expected Result: Immediate:
|
|
| Performance Indicators | Results |
| Immediate: | |
|
|
|
|
|
Expected Result: Long-term:
|
|
| Performance Indicator | Results |
| Long-term: | |
|
|
| Sub-Program Activity: Small Business Policy Branch | |
| Research, analysis and action on regulatory compliance issues affecting SMEs | |
Expected Result:
|
|
| Performance Indicator | Result |
|
|
| Sub-Program Activity: International and Intergovernmental Affairs | |
| Intergovernmental negotiation to reduce or eliminate barriers to the free movement of persons, goods, services and investments within Canada and to establish an open, efficient and stable domestic market | |
| Expected Result: Engaging with the provinces/territories to remove internal trade barriers | |
| Performance Indicator | Result |
|
|
| Sub-Program Activity: Regional Operations – Spectrum | |
| Compliance with spectrum regulations through licensing and enforcement | |
| Expected Result: Timely and effective assignment of radio frequency spectrum | |
| Performance Indicators | Results |
|
|
|
|
| Expected Result: Compliance with legislation, regulation and conditions of licence | |
| Performance Indicator | Result |
|
|
| Sub-Program Activity: Measurement Canada | |
| Integrity and accuracy of measurement in Canada | |
| Expected Result: Integrity and accuracy of measurement in Canada | |
| Performance Indicators | Results |
|
|
|
|
| Sub-Program Activity: Office of the Superintendent of Bankruptcy Canada | |
| Integrity of the insolvency system through supervision of the administration of all estates to which the Bankruptcy and Insolvency Act applies | |
| Expected Result: The integrity of the bankruptcy and insolvency system is protected | |
| Performance Indicator | Results |
|
|
| Expected Result: Efficiency of the insolvency process | |
| Performance Indicators | Results |
|
|
|
|
| Sub-Program Activity: Corporations Canada | |
| Administration of corporate laws and related acts, and duties of the Office of the Registrar General of Canada | |
| Expected Result: Improved compliance with corporate laws and regulations | |
| Performance Indicator | Result |
|
|
| Expected Result: Improved ease of use and timeliness of access to incorporation services and information | |
| Performance Indicator | Result |
|
|
| Expected Result: High level of key services delivered electronically | |
| Performance Indicator | Results |
|
|
| Expected Result: Improved and faster turnaround time for name search reports to business community and federal and provincial/territorial partners and stakeholders | |
| Performance Indicator | Result |
|
|
| Sub-Program Activity: Spectrum/Telecom Program | |
| Facilitation of the development and use of world-class information and telecommunications technologies and services while maintaining and promoting a fair, efficient and competitive communications marketplace | |
| Expected Result: Canadian interests and requirements pertaining to radiocommunications and telecommunications are reflected in international agreements and standards | |
| Performance Indicator | Results |
|
|
| Expected Result: Policies, regulations, standards and procedures are in place to enable the introduction of new radiocommunications/telecommunications technologies and services in the Canadian marketplace | |
| Performance Indicator | Results |
|
|
| Expected Result: Canadians have access to a reliable ICT infrastructure during times of emergency | |
| Performance Indicators | Results |
|
|
|
|
| Sub-Program Activity: Electronic Commerce Branch | |
| Development of regulations and policies to promote e-business development and growth in Canada and strategies to encourage e-business adoption and use among Canadian businesses through analysis and measurement | |
| Expected Result: Increased awareness and use of e-commerce and e-business tools by Canadian industry | |
| Performance Indicator | Results |
|
|
| Expected Result: Up-to-date policies, legislation and regulations, enabling the development and growth of Canadian industries in e-business/e-economy, both domestically and abroad | |
| Performance Indicator | Results |
|
|
| Sub-Program Activity: Consumer Policy | |
| Policy development, intergovernmental collaboration and the development of non-regulatory instruments for consumer protection | |
| Expected Result: Strengthened consumer research | |
| Performance Indicator | Result |
|
|
| Expected Result: Strengthened intergovernmental collaboration | |
| Performance Indicator | Result |
|
|
| Expected Result: Developed or strengthened non-regulatory instruments | |
| Performance Indicators | Results |
|
|
|
|
| Sub-Program Activity: Consumer Information and Coordination | |
| Dissemination of consumer information products and services, and strengthened capacity building for the consumer voluntary sector | |
| Expected Result: Improved access to consumer information provided by government | |
| Performance Indicators | Results |
|
|
|
|
| Expected Result: Improved capacity of consumer groups | |
| Performance Indicators | Results |
|
|
|
|
| Sub-Program Activity: Enforcement With Respect to Competition | |
| Expected Result: Marketplace awareness of the enforcement activities of the Competition Bureau | |
| Performance Indicator | Result |
|
|
| Expected Result: Companies cease their anti-competitive conduct following enforcement interventions | |
| Performance Indicator | Results |
|
(Note: Alternative Case Resolutions seek to achieve compliance with the law without contested enforcement measures. It is a means of achieving conformity by providing guidance on certain aspects of the law.) |
| Sub-Program Activity: Framework Policy and Advocacy With Respect to Competition | |
| Expected Result: Awareness of competition principles by government policy-makers and stakeholders | |
| Performance Indicator | Result |
|
|
| Expected Result: A modern policy framework | |
| Performance Indicator | Result |
|
|
| Sub-Program Activity: Services With Respect to Competition | |
| Expected Result: Provide businesses and consumers with quality, timely and efficient services | |
| Performance Indicator | Result |
|
|
Program Activity: Canadian Intellectual Property Office – Revolving Fund
No sub-program activities or sub-sub-program activities have been identified. Therefore, the lowest reporting level is the program activity level.
5.2.2 An Innovative Economy
| Strategic Outcome | |
| An innovative economy | |
| Program Activity: Policy Sector – S&T and Innovation | |
| Sub-Program Activity: Advisory Council on Science and Technology Secretariat | |
| Provision of secretariat services to the Advisory Council on Science and Technology (ACST) | |
| Expected Result: Provide the government's Advisory Council on Science and Technology with quality research and support services | |
| Performance Indicators | Results |
|
|
|
|
|
|
| Sub-Program Activity: Strategic Policy Branch | |
| Development of strategic policy frameworks to improve Canada's science and technology, and commercialization environment | |
| Expected Result: Integration of departmental and governmental objectives into the development of innovation policies | |
| Performance Indicator | Results |
|
|
| Sub-Program Activity: Micro-Economic Policy Analysis Branch | |
| Micro-economic analysis in support of science and technology policy development | |
| Expected Result: High-quality micro-economic research and analysis on significant policy issues as input to policy development | |
| Performance Indicators | Results |
| Number of: | |
|
|
|
|
|
|
|
|
|
|
| Sub-Program Activity: Innovation Policy Branch | |
| Development of science, technology and innovation policies that enhance Canada's innovation capacity through promotion of investments in R&D infrastructure and skills development, and by ensuring the technology adoption capacity of the marketplace | |
| Expected Result: Promotion of investment in R&D infrastructure and skills development, and promotion of the development of policies and programs supporting R&D, innovation and commercialization in the private sector | |
| Performance Indicator | Results |
|
|
| Sub-Sub-Program Activity: Canadian Institute for Advanced Research (CIAR) | |
| To bring together world-class researchers to tackle significant issues confronting Canadian society and challenging our understanding of the natural world | |
| Expected Result: Multidisciplinary teams of researchers are able to collaborate to push forward the frontiers of knowledge | |
| Performance Indicator | Results |
|
|
| Sub-Sub-Program Activity: Pierre Elliott Trudeau Foundation | |
| To support research and the dissemination of research findings in the following fields of study in the humanities and human sciences: Canadian studies, history, international relations, journalism, law, peace and conflict studies, philosophy, political economy, political science, sociology, and urban and community studies | |
| Expected Result: Expanded knowledge base in the social sciences and humanities and in public policy | |
| Performance Indicator | Results |
|
|
| Sub-Sub-Program Activity: Canada Foundation for Innovation | |
| Funds targeted to strengthen the capability of Canadian universities, colleges, research hospitals and other not-for-profit institutions to carry out world-class research and technology development | |
| Expected Result: The strengthening of research capability at Canadian research institutions | |
| Performance Indicator | Result |
|
|
| Expected Result: Attracting and retaining researchers at Canadian research institutions | |
| Performance Indicator | Results |
|
|
| Sub-Sub-Program Activity: Canada-Israel Industrial Research and Development Foundation (CIIRDF) | |
| Co-funding of a private sector foundation (50 percent contribution from Canada, 50 percent from Israel), which supports research and development collaboration between Canadian and Israeli firms | |
| Expected Result: Strengthened Canadian business through global R&D cooperation | |
| Performance Indicator | Result |
|
|
| Sub-Sub-Program Activity: Council of Canadian Academies | |
| Expected Result: More informed public debate and government decision making on public policy issues that have scientific and/or technological underpinnings | |
| Performance Indicator | Results |
|
|
| Sub-Program Activity: Manufacturing Industries Branch | |
| Development of initiatives that stimulate R&D to accelerate the commercialization of emerging technologies in priority manufacturing sectors | |
| Expected Result: Sustainable manufacturing practices | |
| Performance Indicators | Results |
|
|
|
|
|
|
| Sub-Program Activity: Energy and Environmental Industries Branch | |
| Development of initiatives to stimulate research, development and commercialization of emerging technologies in priority energy sectors and environmental industries | |
| Expected Result: Development of emerging technologies in energy and environmental industry sectors | |
| Performance Indicators | Results |
|
|
|
|
|
|
| Expected Result: Improved appreciation of issues and policies related to climate change | |
| Performance Indicators | Results |
|
|
|
|
| Sub-Sub-Program Activity: Hydrogen Economy | |
| Acceleration of the development of a hydrogen economy through investments in R&D, demonstration and deployment of hydrogen and fuel cell technologies | |
| Expected Result: Expanded knowledge base for climate change mitigation related to a hydrogen economy | |
| Performance Indicator | Result |
|
|
| Expected Result: Increased collaboration between partners and improved activity coordination | |
| Performance Indicator | Result |
|
|
| Sub-Program Activity: Service Industries Branch | |
| Development of initiatives that stimulate R&D to accelerate the commercialization of priority technologies in the service industries | |
| Expected Result: Improved awareness of international business opportunities by Canadian companies in the service industries sector | |
| Performance Indicator | Result |
|
|
| Sub-Program Activity: Aerospace, Defence and Marine Branch | |
| Development of initiatives that stimulate R&D to accelerate the commercialization of emerging technologies in priority aerospace, defence and marine sectors | |
| Expected Result: Development of Canadian technologies and innovations in the aerospace, space and defence industries | |
| Performance Indicators | Results |
|
|
|
|
|
|
|
|
|
|
| Expected Result: Increased awareness and knowledge of the ocean technology sector | |
| Performance Indicators | Results |
|
|
|
|
|
|
| Sub-Program Activity: Life Sciences Branch | |
| Development of initiatives that stimulate R&D and commercialization in the priority life sciences sectors | |
| Expected Result: Increased commercialization performance in Canada's life sciences (biotechnology and health) industries | |
| Performance Indicators | Results |
|
|
|
|
|
|
| Sub-Sub-Program Activity: Genome Canada | |
| The primary funding and information resource relating to genomics and proteomics in Canada, to enable Canada to become a world leader in key areas such as agriculture, environment, fisheries, forestry, health and new technology development, as well as ethical, environmental, economic, legal and social issues related to genomics (GE3LS) | |
| Expected Result: Effective management of the government's funding agreement with Genome Canada | |
| Performance Indicators | Results |
|
|
|
|
|
|
| Sub-Program Activity: Industrial Analysis and Sector Services Branch | |
| Support for the development of policies, programs and initiatives for priority sectors through policy analysis and research on issues related to the commercialization of emerging technologies | |
| Expected Result: Increased profile of industrial issues and policies involved in making the Canadian economy more innovative | |
| Performance Indicators | Results |
|
|
|
|
| Sub-Program Activity: Automotive and Industrial Materials Branch | |
| Development of initiatives that stimulate R&D to accelerate the commercialization of emerging technologies in priority aerospace, defence and automotive sectors | |
| Expected Result: Development of Canadian technologies and innovations in the automotive and industrial materials industries | |
| Performance Indicators | Results |
|
|
|
|
|
|
|
|
| Sub-Program Activity: Canadian Biotechnology Secretariat | |
| Horizontal policy advice and program management in support of Canadian Biotechnology Strategy partner departments and agencies, and secretariat services to the Canadian Biotechnology Advisory Committee | |
| Expected Result: Coordination of the development of the Government of Canada's biotechnology agenda | |
| Performance Indicator | Results |
|
|
| Expected Result: Support to the Canadian Biotechnology Advisory Committee | |
| Performance Indicators | Results |
|
|
|
|
|
|
| Expected Result: Communication of the Government of Canada's biotechnology initiative | |
| Performance Indicator | Result |
|
|
| Sub-Program Activity: Information and Communications Technologies Branch | |
| Strengthening of Canada's S&T capacity by addressing human resource requirements, international linkages and commercialization issues; delivery of CANARIE and Precarn on behalf of the Government of Canada | |
| Expected Result: Ongoing investment in the R&D infrastructure | |
| Performance Indicator | Result |
|
|
| Sub-Sub-Program Activity: CANARIE | |
| Collaborate with stakeholders to develop and use advanced networks, networking technologies and applications in order to deliver a range of benefits to Canadians and researchers | |
| Expected Result: An advanced research network across Canada | |
| Performance Indicators | Results |
|
|
|
|
| Sub-Sub-Program Activity: Precarn | |
| Support collaborative research for the development of the Canadian intelligent systems industry and encourage the diffusion and commercial exploitation of new technologies | |
| Expected Result: Increased development and use of intelligent systems technologies | |
| Performance Indicator | Results |
|
|
| Sub-Program Activity: CRC – Wireless and Photonics Research | |
| Conducting R&D on innovative concepts, systems and enabling technologies for the convergence of telecommunications systems and to improve the security, interoperability and reliability of communications networks in Canada | |
| Expected Result: The Communications Research Centre Canada (CRC) is well positioned to provide strategic advice, as well as direct assistance, for the development of policy, regulations and standards, as well as for economic development in the telecommunications sector, as new technical developments and challenges arise. | |
| Performance Indicators | Results |
|
|
|
|
| Sub-Program Activity: CRC – Defence R&D | |
| Provision of scientific knowledge and expertise in wireless communications to National Defence in order to improve decision making and operation capability of the Canadian Forces | |
| Expected Result: National Defence can make better and more informed decisions on new technologies related to future military communications systems | |
| Performance Indicator | Results |
|
|
| Sub-Program Activity: CRC – Research Support | |
| To provide business development, technology transfer, and information networks and systems support of CRC R&D efforts, liaison and collaboration with the international science and technology community; and to increase opportunities for the commercialization of technologies | |
| Expected Result: Canadian telecommunications industry has knowledge of and efficient access to CRC's intellectual property portfolio | |
| Performance Indicator | Results |
|
|
| Sub-Program Activity: TPC – R&D Support Program | |
| Strategic investments in industrial research, pre-competitive development and related studies | |
| Expected Result: Leverage of private sector R&D investment | |
| Performance Indicators | Results |
|
|
|
|
| Expected Result: Increased skills, knowledge and competencies of Canadian companies | |
| Performance Indicator | Result |
|
|
| Expected Result: Repayments recycled into program funds | |
| Performance Indicator | Result |
|
|
| Sub-Program Activity: TPC – h2 Early Adopters Program | |
| Investments in new hydrogen technology demonstration projects that will bring Canada into the hydrogen economy | |
| Expected Result: Accelerate the market adoption of hydrogen and hydrogen-compatible technologies | |
| Performance Indicator | Result |
|
|
| Expected Result: Leverage of private sector R&D investment | |
| Performance Indicators | Results |
|
|
|
|
5.2.3 Competitive Industry and Sustainable Communities
| Strategic Outcome | |
| Competitive industry and sustainable communities | |
| Program Activity: Policy Sector – Economic Development | |
| Sub-Program Activity: International and Intergovernmental Affairs – Economic Development | |
| Impact of international trade, investment and services negotiations on industry interests identified and assessed | |
| Expected Result: Alignment of federal and provincial/territorial innovation, industrial development and competitiveness policy | |
| Performance Indicator | Results |
|
The following federal-provincial-territorial (FPT) meetings were convened to discuss horizontal departmental-wide issues:
|
| Expected Result: Integration of departmental interests into the government's international policy positions | |
| Performance Indicator | Results |
|
(Due to a reorganization within Industry Canada, the IIA Directorate retains responsibility only for the 2nd Expected Result.) |
| Expected Result: Timely processing of notifications and applications for review filed by foreign investors under the Investment Canada Act | |
| Performance Indicator | Results |
|
|
| Sub-Program Activity: Strategic Policy Branch – Economic Development | |
| Development of strategic policy frameworks for economic and sustainable development | |
| Expected Result: Integration of departmental and governmental objectives into the development of economic and sustainable development policies | |
| Performance Indicator | Results |
|
|
| Sub-Sub-Program Activity: Sustainable Development Strategy | |
| Development and implementation of the Department's Sustainable Development Strategy | |
| Expected Result: Increased commercialization and adoption of eco-efficient tools and technologies by Canadian companies | |
| Performance Indicators | Results |
| Number of Canadian companies that have: | |
|
|
|
|
| Expected Result: Increased use by industry, institutions and communities of corporate responsibility and sustainability practices | |
| Performance Indicators | Results |
| Number of Canadian companies that have: | |
|
|
|
|
| Sub-Program Activity: Micro-Economic Policy Analysis Branch | |
| Micro-economic analysis in support of economic policy development | |
| Expected Result: High-quality micro-economic research and analysis on significant policy issues as input to policy development | |
| Performance Indicators | Results |
| Number of: | |
|
|
|
|
|
|
|
|
|
|
| Sub-Program Activity: Small Business Policy Branch | |
| High-quality research and analysis on small business issues as input to policy development | |
| Expected Result: Increased awareness and use of information relating to small business issues by policy-makers and other small business stakeholders | |
| Performance Indicator | Results |
|
|
| Sub-Program Activity: Canada Small Business Financing (CSBF) Program | |
| Administration of the Canada Small Business Financing Act and the Small Business Loans Act | |
| Expected Result: Access to debt financing for SMEs | |
| Performance Indicators | Results |
|
|
|
|
|
|
| Expected Result: Awareness of and satisfaction with the CSBF program on the part of participating lenders | |
| Performance Indicator | Result |
|
|
| Sub-Program Activity: FedNor | |
| Economic stability, growth, diversification, job creation and sustainable communities in Northern and rural Ontario | |
| Expected Result: Improved community capacity and long-term sustainable economic development in Northern and rural Ontario | |
| Performance Indicator | Result |
|
|
| Sub-Sub-Program Activity: Community Futures Program | |
| Community economic development in rural Ontario | |
| Expected Result: Community economic development plans implemented | |
| Performance Indicator | Result |
|
|
| Expected Result: Businesses created and strengthened | |
| Performance Indicator | Result |
|
|
| Sub-Sub-Program Activity: Northern Ontario Development Program | |
| Regional and community development in Northern Ontario | |
| Expected Result: Improved retention and development of youth in Northern Ontario through improved skills and networking | |
| Performance Indicator | Result |
|
|
| Expected Result: Increased investment through the development of strategic partnerships | |
| Performance Indicator | Result |
|
|
| Sub-Sub-Program Activity: Eastern Ontario Development Program | |
| Community economic development in Eastern Ontario | |
| Expected Result: Increased investment through the development of strategic partnerships | |
| Performance Indicator | Result |
|
|
| Expected Result: Businesses created | |
| Performance Indicator | Result |
|
|
| Sub-Program Activity: Sectoral Strategies and Services Branch / Canada-Ontario Infrastructure Program (COIP) | |
| Improved community infrastructure through investments in rural and municipal infrastructure in Ontario, with an emphasis on green municipal infrastructure such as water and wastewater systems | |
| Expected Result: Improved community infrastructure in Ontario | |
| Performance Indicator | Result |
|
|
| Sub-Program Activity: Aboriginal Business Canada | |
| Creation and expansion of viable businesses in Canada that are owned and controlled by Aboriginal peoples | |
| Expected Result: Maximizing the participation of Aboriginal people in the economy through support for the creation and expansion of viable businesses in Canada that are owned and controlled by Aboriginal people | |
| Performance Indicators | Result |
|
|
|
|
|
|
|
|
|
|
|
|
| Sub-Program Activity: Regional Delivery | |
| Delivery of programs and services across Canada | |
| Expected Result: Increased awareness and access to government business-related information, programs and services, and facilitated compliance for business | |
| Performance Indicator | Results |
|
Canada Business Service Centres:
|
| Expected Result: Increased use of self-service channels | |
| Performance Indicator | Results |
|
|
| Expected Result: Improved departmental understanding of regional socio-economic environment, issues, and implications for policy, programs, implementation and other initiatives | |
| Performance Indicator | Results |
|
|
| Sub-Program Activity: Section 41, Official Languages Act | |
| Improved participation by official-language minority communities (OLMCs) in existing federal economic development programs and services | |
| Expected Result: Encourage participation of OLMCs in Industry Canada's programs | |
| Performance Indicators | Results |
|
|
|
|
| Sub-Program Activity: Service to Business: Strategy and Innovation | |
| Advancement of the service-to-business vision and improve client-centred government services to business | |
| Expected Result: Improved availability of multi-jurisdictional permit and licence information accessible to business | |
| Performance Indicator | Result |
|
|
| Sub-Program Activity: Canada Business – National Secretariat | |
| Increased awareness and access to government business-related information, programs and services and facilitated compliance with regulations for businesses | |
| Expected Result: Increased awareness and access to government business-related information, programs and services and facilitated compliance for businesses | |
| Performance Indicator | Results |
|
|
| Expected Result: Increased use of self-service channels | |
| Performance Indicator | Result |
|
|
| Expected Result: Reduced complexity in accessing programs and services and compliance requirements for SMEs | |
| Performance Indicator | Results |
|
|
| Expected Result: Improved SME business planning and market research | |
| Performance Indicators | Results |
|
|
| Sub-Program Activity: Student Connections | |
| Increased knowledge and use of Internet and e-commerce by Canadian SMEs and seniors, and increased youth knowledge, skills and marketability for employment | |
| Expected Result: Increased knowledge and skills related to the Internet and e-commerce applications and technologies on the part of SMEs and seniors | |
| Performance Indicator | Result |
|
|
| Expected Result: Practical, short-term work experience for students in post-secondary IT-related studies | |
| Performance Indicator | Result |
|
|
| Sub-Program Activity: Manufacturing Industries Branch | |
| Development of initiatives to support global competitiveness and sustainable economic growth in priority manufacturing sectors | |
| Expected Result: Enhance international competitiveness and production of established industries (e.g., apparel and textiles, softwood lumber, plastics and chemicals) | |
| Performance Indicators | Results |
|
|
|
|
| Sub-Sub-Program Activity: Canadian Apparel and Textile Industries Program | |
| Expected Result: Increased competitiveness of Canadian apparel and textile firms | |
| Performance Indicator | Result |
|
|
| Sub-Program Activity: Energy and Environmental Industries Branch | |
| Development of initiatives to support global competitiveness and sustainable economic growth in priority energy sectors and environmental industries | |
| Expected Result: Competitiveness and growth in mature energy and environmental industries | |
| Performance Indicator | Results |
|
|
| Expected Result: Capabilities of Canadian companies promoted to international markets | |
| Performance Indicator | Result |
|
|
| Sub-Sub-Program Activity: Border Air Quality Strategy | |
| The Border Air Quality Strategy is a bilateral initiative to improve coordinated air quality management in Canada and the United States, and to advance Canada's 10-year Clean Air Agenda. Industry Canada and Natural Resources Canada are partners in the Canada-United States Emissions Cap and Trading Feasibility Study for a nitrogen oxides and sulphur dioxide cap and trade system, headed by Environment Canada and the U.S. Environmental Protection Agency. | |
| Expected Result: Evaluation of program elements necessary in a joint Canada-United States nitrogen oxides and sulphur dioxide cap and trade program | |
| Performance Indicator | Result |
|
|
| Expected Result: Contribution to research on the economic and technical feasibility of an emissions trading system | |
| Performance Indicator | Result |
|
|
| Sub-Program Activity: Service Industries Branch | |
| Development of initiatives that support global competitiveness and sustainable economic growth in priority service industries and service-related emerging technologies | |
| Expected Result: Competitiveness and growth in service industries (e.g., retail, logistics, professional services, language industries) | |
| Performance Indicators | Results |
|
|
|
|
| Expected Result: Increased collaboration on tourism industry issues among federal, provincial and territorial governments | |
| Performance Indicator | Result |
|
|
| Expected Result: Increased awareness by stakeholders of policies that affect the growth of the tourism industry | |
| Performance Indicators | Results |
|
|
|
|
| Expected Result: Increased awareness of opportunities for Canadian firms in domestic and global marketplaces via SourceCAN | |
| Performance Indicators | Results |
|
|
|
|
|
|
| Sub-Sub-Program Activity: Language Industry Initiative (LII) | |
| Fostering of cooperation with the private sector to build a strong, competitive industry; support for firms wishing to undertake marketing and branding activities | |
| Expected Result: Steering Committee / LII Operations Group – clear strategic direction | |
| Performance Indicators | Results |
|
|
|
|
| Expected Result: Marketing strategies – identifying national and international market opportunities | |
| Performance Indicator | Results |
|
|
| Expected Result: Increased awareness by language industries of national and international market opportunities | |
| Performance Indicators | Results |
|
|
|
|
|
|
| Expected Result: Increased awareness of language industries by target audiences | |
| Performance Indicators | Results |
|
|
|
|
| Expected Result: Increased awareness (knowledge) of Canadian language industries by Canadian representatives abroad | |
| Performance Indicator | Result |
|
|
| Sub-Program Activity: Aerospace, Defence and Marine Branch | |
| Development of initiatives that support global competitiveness and sustainable economic growth in aerospace, defence and marine sectors and aerospace and marine-related emerging technologies | |
| Expected Result: Competitiveness and growth of the aerospace, defence and space industries | |
| Performance Indicators | Results |
|
|
|
|
|
|
|
|
| Expected Result: Capabilities of Canadian companies promoted to international markets | |
| Performance Indicators | Results |
|
|
|
|
|
|
| Expected Result: Competitiveness and growth in mature marine industries | |
| Performance Indicators | Results |
|
|
|
|
| Sub-Sub-Program Activity: Structured Financing Facility (SFF) | |
| Stimulate economic activities in the Canadian shipbuilding and industrial marine industry by providing financial assistance to buyers/lessees of Canadian-built ships | |
| Expected Result: Increased awareness and knowledge of SFF benefits | |
| Performance Indicators | Results |
|
|
|
|
| Expected Result: Increased use of SFF by Canadian and foreign buyers or lessees | |
| Performance Indicators | Results |
|
|
|
|
|
|
|
|
| Sub-Program Activity: Life Sciences Branch – Economic Development | |
| Analysis and advice that supports global competitiveness and sustainable economic growth in the life sciences sector | |
| Expected Result: Promotion of life sciences industry to international trade and investment targets in the United States, Europe and Asia | |
| Performance Indicators | Results |
|
|
|
|
|
|
|
|
|
|
| Expected Result: Increased exports in Canada's life sciences sector | |
| Performance Indicator | Results |
|
|
| Expected Result: Increased international investment in Canada's life sciences industries | |
| Performance Indicator | Results |
|
|
| Sub-Program Activity: Industrial Analysis and Sector Services Branch – Economic Development | |
| Support for the development of policies, programs and initiatives for priority sectors and emerging technologies, by undertaking policy analysis and research on trade, investment and regulatory issues | |
| Expected Result: Increased profile of industrial issues and policies involved in making Canadian industries more competitive and Canadian communities more sustainable | |
| Performance Indicators | Results |
|
|
|
|
| Sub-Program Activity: Automotive and Industrial Materials Branch – Economic Development | |
| Development of initiatives that support global competitiveness and sustainable economic growth in aerospace, defence and automotive sectors and aerospace and automotive-related emerging technologies | |
| Expected Result: Competitiveness and growth of the automotive and industrial materials industries | |
| Performance Indicators | Results |
|
|
|
|
|
|
|
|
|
|
| Sub-Program Activity: Information and Communications Technologies Branch | |
| Improvement in the competitiveness and fostering of growth of the Canadian ICT industry | |
| Expected Result: Broad understanding of developments that affect sector growth in order to identify issues, gaps and opportunities for the ICT sector, to support directions for business development and policy activities | |
| Performance Indicator | Results |
|
|
| Expected Result: Informed advocacy for ICT stakeholder issues to influence government decisions on issues affecting the ICT industry | |
| Performance Indicator | Result |
|
|
| Expected Result: Increased business opportunities for the Canadian ICT sector | |
| Performance Indicators | Results |
|
|
|
|
|
|
| Sub-Program Activity: Information Highway Applications Branch | |
| Acceleration of the participation of Canadians and their communities in the digital economy by fostering community networks and improving both access to, and use of, ICTs for lifelong learning and economic development | |
| Expected Result: Assisting Canadian individuals and communities in overcoming barriers to access and use of ICTs | |
| Performance Indicators | Results |
|
|
|
|
| Sub-Sub-Program Activity: Broadband for Rural and Northern Development Pilot Program | |
| Ensures Canadian communities and businesses have access to reliable, modern ICT infrastructure by bringing broadband, or high-capacity, Internet to rural, remote Northern and First Nations communities | |
| Expected Result: Access by Canadian communities and businesses to reliable, modern ICT infrastructure by bringing broadband, or high-capacity, Internet to rural, remote, Northern and First Nations communities | |
| Performance Indicator | Result |
|
|
| Sub-Sub-Program Activity: Francommunaut�s virtuelles | |
| Aims to promote the active participation of Canada's French-speaking communities in ICTs to stimulate connectivity, access to the Internet, and the development of content and new media in French | |
| Expected Result: Improved access to French-language web applications, content and services on the part of Canada's Francophone and Acadian populations | |
| Performance Indicator | Result |
|
|
| Sub-Sub-Program Activity: National Satellite Initiative (NSI) | |
| Ensures Canadian communities and businesses have access to reliable, modern ICT infrastructure by bringing high-capacity Internet to communities in the Far North and Mid-North, and in isolated or remote areas of Canada, where satellite is the only reasonable means of connecting public institutions, residents and businesses | |
| Expected Result: Access by Canadian communities and businesses to reliable, modern ICT infrastructure by bringing high-capacity Internet to communities in the Far North and Mid-North, and in isolated or remote areas of Canada, via satellite | |
| Performance Indicator | Result |
|
|
Appendix
Linking Industry Canada's Report on Plans and Priorities (RPP) to the Departmental Performance Report (DPR)
The following table is a crosswalk of changes to the format and content of Industry Canada's DPR as compared with what was reported in the RPP (both for fiscal year 2006-07).
| Section of Document | Location of Information in RPP 2006-07 | Location of Information in DPR 2006-07 | Notable Changes in DPR for the Period Ended March 31, 2007 |
|---|---|---|---|
| Minister's Message | Section 1.1 | Section 1.1 |
|
| Management Representation Statement | Section 1.2 | Section 1.2 |
|
| Summary Information | Section 1.4 | Section 1.3 |
|
| Strengthening Management Practices at Industry Canada | Section 1.6 | Section 1.4 |
|
| Overall Departmental Performance | Sections 1.3 and 1.5 | Section 1.5 |
|
| Analysis of Program Activities by Strategic Outcome | Section 2 | Section 2 |
|
| Supplementary Information | Section 3 | Section 3 |
|
| Other Items of Interest | Section 4 | Section 4 |
|
| Items Available Online | Not applicable | Section 5 |
|
| Results Information for Sub-Program and Sub-Sub-Program Activities by Strategic Outcome | Appendix | Section 5 |
|